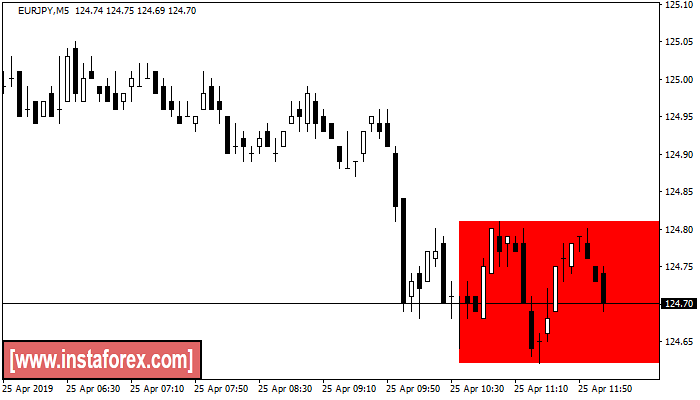
Bullish Rectangle
was formed on 25.04 at 09:08:49 (UTC+0)
signal strength 1 of 5
According to the chart of M5, EURJPY formed the Bullish Rectangle. This type of a pattern indicates a trend continuation. It consists of two levels: resistance 124.81 - 0.00 and support 124.62 – 124.62. In case the resistance level 124.62 - 124.62 is broken, the instrument is likely to follow the bearish trend.
The M5 and M15 time frames may have more false entry points.
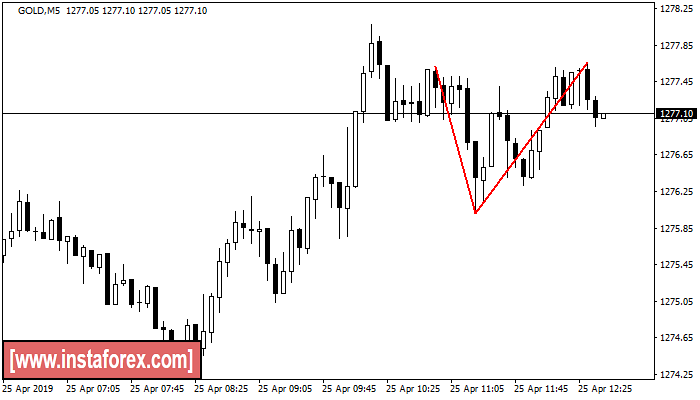
Double Top
was formed on 25.04 at 09:40:13 (UTC+0)
signal strength 1 of 5
The Double Top pattern has been formed on GOLD M5. It signals that the trend has been changed from upwards to downwards. Probably, if the base of the pattern 1276.01 is broken, the downward movement will continue.
The M5 and M15 time frames may have more false entry points.
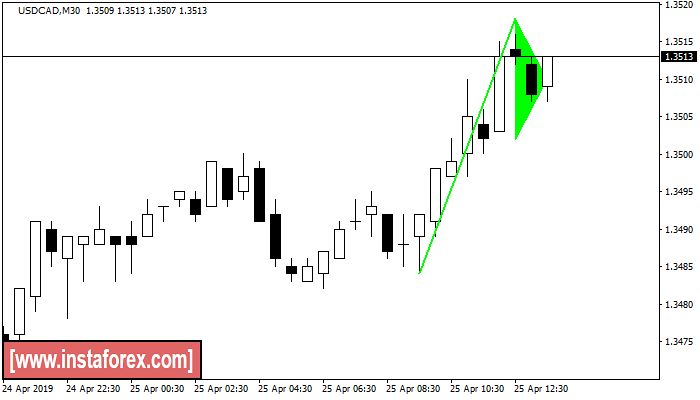
Bullish pennant
was formed on 25.04 at 10:42:20 (UTC+0)
signal strength 3 of 5
The Bullish pennant signal – Trading instrument USDCAD M30, continuation pattern. Forecast: it is possible to set up a buy position above the pattern’s high of 1.3518, with the prospect of the next move being a projection of the flagpole height.
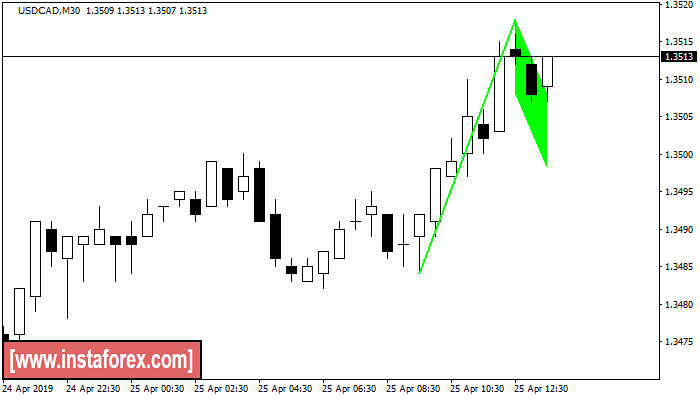
Bullish Flag
was formed on 25.04 at 10:42:27 (UTC+0)
signal strength 3 of 5
The Bullish Flag pattern has been formed on USDCAD at M30. The lower boundary of the pattern is located at 1.3508/1.3498, while the higher boundary lies at 1.3518/1.3508. The projection of the flagpole is 34 points. This formation signals that the upward trend is most likely to continue. Therefore, if the level of 1.3518 is broken, the price will move further upwards.
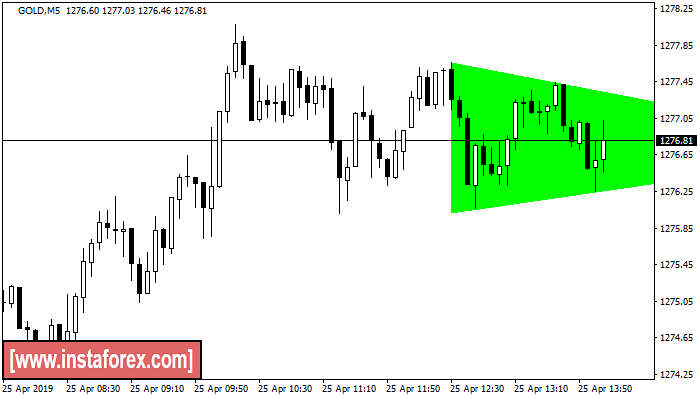
Bearish Symmetrical Triangle
was formed on 25.04 at 11:08:16 (UTC+0)
signal strength 1 of 5
According to the chart of M5, GOLD formed the Bearish Symmetrical Triangle pattern. This pattern signals a further downward trend in case the lower border 1277.66 is breached. Here, a hypothetical profit will equal the width of the available pattern that is 164 pips.
The M5 and M15 time frames may have more false entry points.
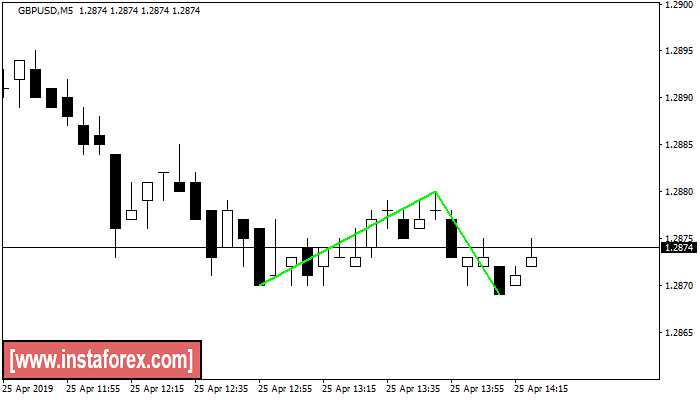
Double Bottom
was formed on 25.04 at 11:25:23 (UTC+0)
signal strength 1 of 5
The Double Bottom pattern has been formed on GBPUSD M5. This formation signals a reversal of the trend from downwards to upwards. The signal is that a buy trade should be opened after the upper boundary of the pattern 1.2880 is broken. The further movements will rely on the width of the current pattern 10 points.
The M5 and M15 time frames may have more false entry points.
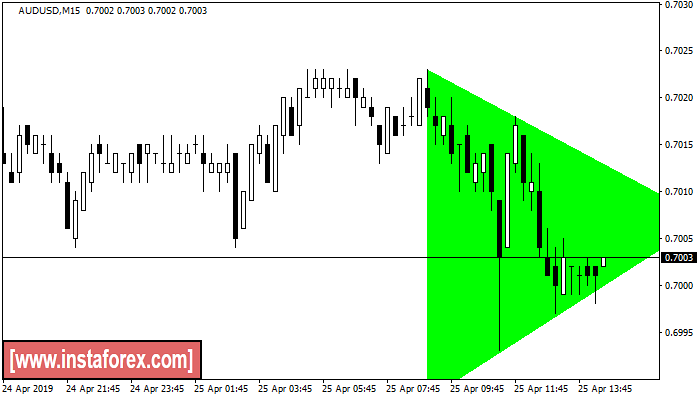
Bearish Symmetrical Triangle
was formed on 25.04 at 11:30:41 (UTC+0)
signal strength 2 of 5
According to the chart of M15, AUDUSD formed the Bearish Symmetrical Triangle pattern. This pattern signals a further downward trend in case the lower border 0.7023 is breached. Here, a hypothetical profit will equal the width of the available pattern that is 35 pips.
The M5 and M15 time frames may have more false entry points.
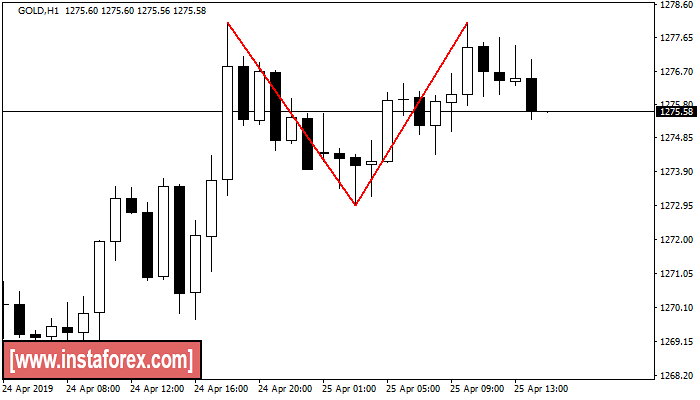
Double Top
was formed on 25.04 at 12:00:09 (UTC+0)
signal strength 4 of 5
On the chart of GOLD H1 the Double Top reversal pattern has been formed. Characteristics: the upper boundary 1278.08; the lower boundary 1272.95; the width of the pattern 513 points. The signal: a break of the lower boundary will cause continuation of the downward trend targeting the 1272.55 level.
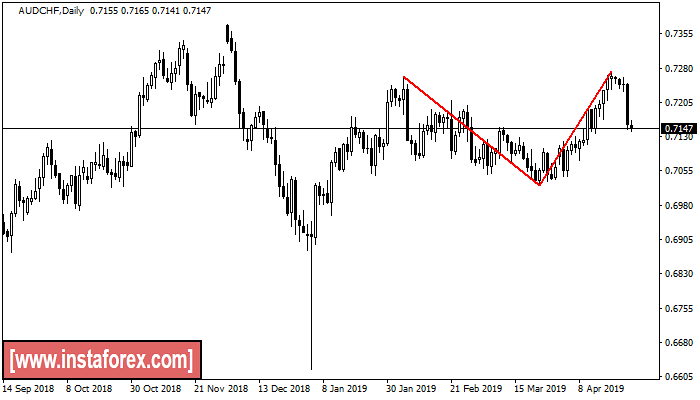
Double Top
was formed on 25.04 at 12:15:49 (UTC+0)
signal strength 5 of 5
The Double Top pattern has been formed on AUDCHF D1. It signals that the trend has been changed from upwards to downwards. Probably, if the base of the pattern 0.7023 is broken, the downward movement will continue.