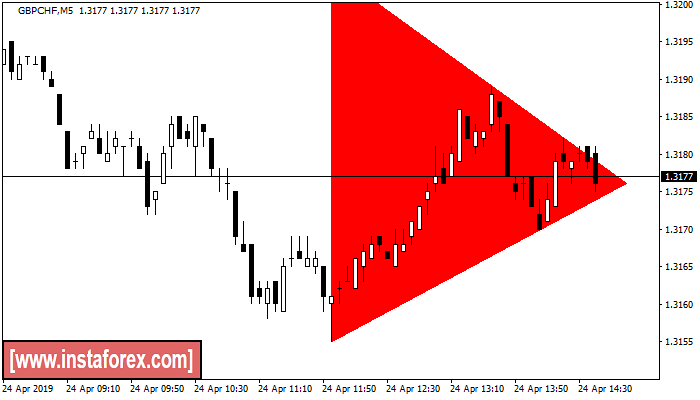
Bullish symmetrical triangle
was formed on 24.04 at 11:45:35 (UTC+0)
signal strength 1 of 5
According to the chart of M5, GBPCHF formed the Bullish symmetrical triangle pattern. Description: This is the pattern of a trend continuation. 1.3155 and 1.3205 are the coordinates of the upper and lower borders respectively. The pattern width is measured on the chart at -50 pips. Outlook: If the upper border 1.3155 is broken, the price is likely to continue its move by 1.3161 pips.
The M5 and M15 time frames may have more false entry points.
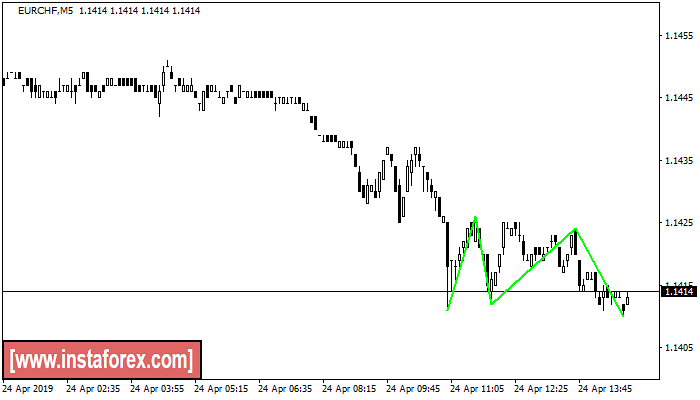
Triple Bottom
was formed on 24.04 at 11:50:29 (UTC+0)
signal strength 1 of 5
The Triple Bottom pattern has formed on the chart of EURCHF M5. Features of the pattern: The lower line of the pattern has coordinates 1.1426 with the upper limit 1.1426/1.1424, the projection of the width is 15 points. The formation of the Triple Bottom pattern most likely indicates a change in the trend from downward to upward. This means that in the event of a breakdown of the resistance level 1.1411, the price is most likely to continue the upward movement.
The M5 and M15 time frames may have more false entry points.
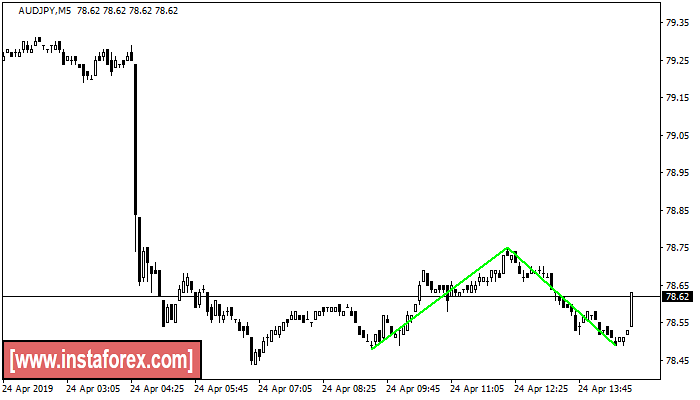
Double Bottom
was formed on 24.04 at 11:55:24 (UTC+0)
signal strength 1 of 5
The Double Bottom pattern has been formed on AUDJPY M5; the upper boundary is 78.75; the lower boundary is 78.49. The width of the pattern is 27 points. In case of a break of the upper boundary 78.75, a change in the trend can be predicted where the width of the pattern will coincide with the distance to a possible take profit level.
The M5 and M15 time frames may have more false entry points.
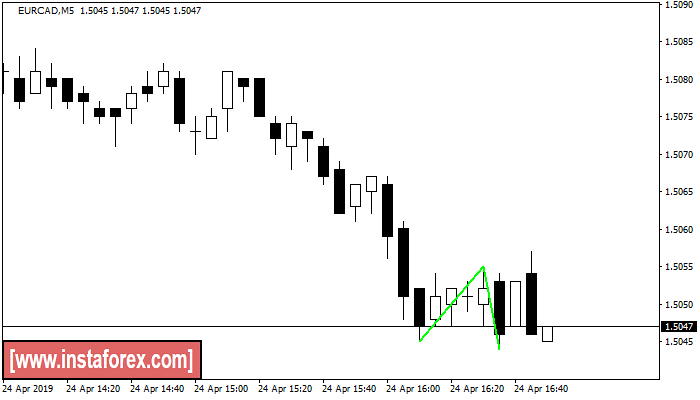
Double Bottom
was formed on 24.04 at 13:50:22 (UTC+0)
signal strength 1 of 5
The Double Bottom pattern has been formed on EURCAD M5. This formation signals a reversal of the trend from downwards to upwards. The signal is that a buy trade should be opened after the upper boundary of the pattern 1.5055 is broken. The further movements will rely on the width of the current pattern 10 points.
The M5 and M15 time frames may have more false entry points.
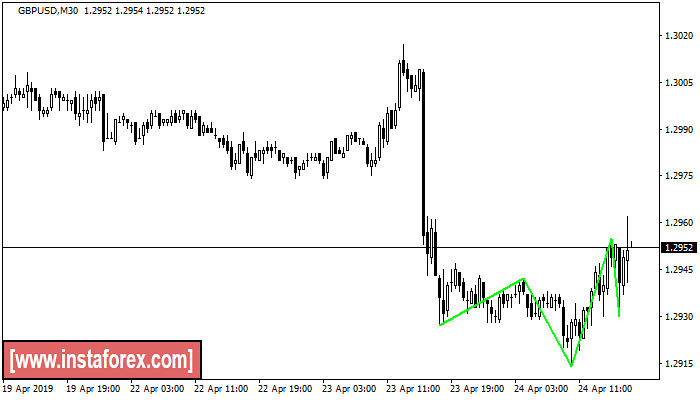
Inverse Head and Shoulder
was formed on 24.04 at 14:30:35 (UTC+0)
signal strength 3 of 5
According to M30, GBPUSD is shaping the technical pattern – the Inverse Head and Shoulder. In case the Neckline 1.2942/1.2955 is broken out, the instrument is likely to move toward 1.2985.
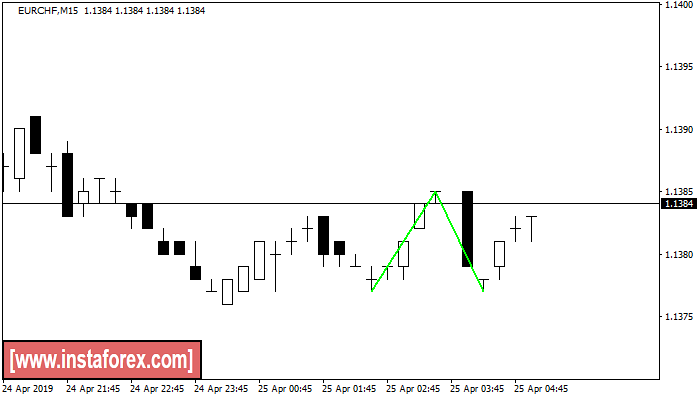
Double Bottom
was formed on 25.04 at 02:18:21 (UTC+0)
signal strength 2 of 5
The Double Bottom pattern has been formed on EURCHF M15; the upper boundary is 1.1385; the lower boundary is 1.1377. The width of the pattern is 8 points. In case of a break of the upper boundary 1.1385, a change in the trend can be predicted where the width of the pattern will coincide with the distance to a possible take profit level.
The M5 and M15 time frames may have more false entry points.
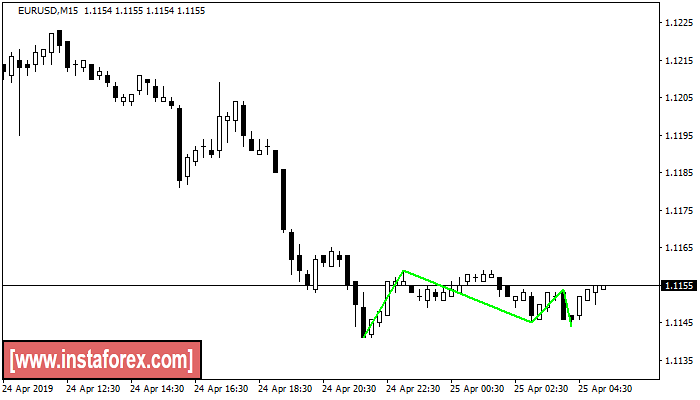
Triple Bottom
was formed on 25.04 at 02:22:02 (UTC+0)
signal strength 2 of 5
The Triple Bottom pattern has been formed on EURUSD M15. It has the following characteristics: resistance level 1.1159/1.1154; support level 1.1141/1.1144; the width is 18 points. In the event of a breakdown of the resistance level of 1.1159, the price is likely to continue an upward movement at least to 1.1168.
The M5 and M15 time frames may have more false entry points.
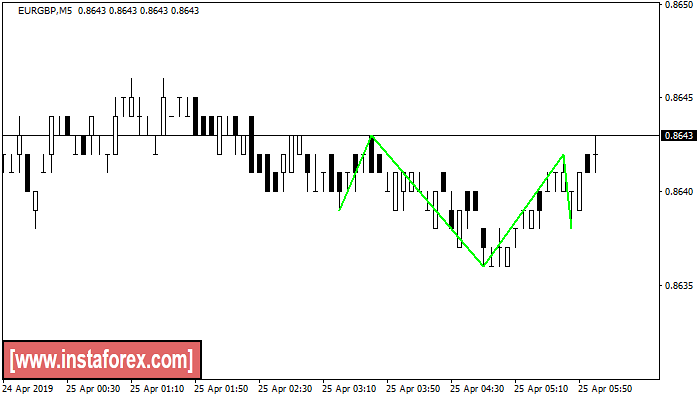
Inverse Head and Shoulder
was formed on 25.04 at 03:06:56 (UTC+0)
signal strength 1 of 5
According to M5, EURGBP is shaping the technical pattern – the Inverse Head and Shoulder. In case the Neckline 0.8643/0.8642 is broken out, the instrument is likely to move toward 0.8657.
The M5 and M15 time frames may have more false entry points.
Inverse Head and Shoulder
was formed on 25.04 at 03:30:45 (UTC+0)
signal strength 1 of 5
According to the chart of M5, EURJPY produced the pattern termed the Inverse Head and Shoulder. The Head is fixed at 124.87 while the median line of the Neck is set at 125.05/125.03. The formation of the Inverse Head and Shoulder Pattern clearly indicates a reversal of the downward trend. In means that in case the scenario comes true, the price of EURJPY will go towards 125.18.
The M5 and M15 time frames may have more false entry points.
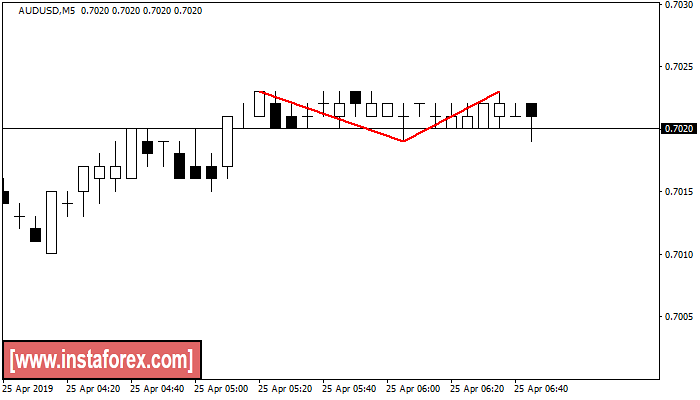
Double Top
was formed on 25.04 at 03:50:21 (UTC+0)
signal strength 1 of 5
The Double Top pattern has been formed on AUDUSD M5. It signals that the trend has been changed from upwards to downwards. Probably, if the base of the pattern 0.7019 is broken, the downward movement will continue.
The M5 and M15 time frames may have more false entry points.