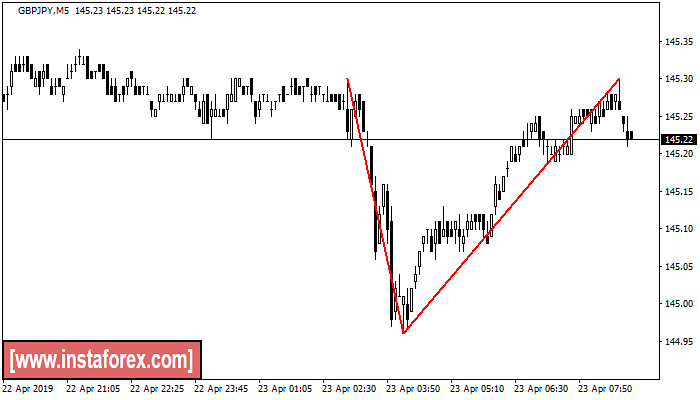
Double Top
was formed on 23.04 at 05:56:37 (UTC+0)
signal strength 1 of 5
The Double Top pattern has been formed on GBPJPY M5. It signals that the trend has been changed from upwards to downwards. Probably, if the base of the pattern 144.96 is broken, the downward movement will continue.
The M5 and M15 time frames may have more false entry points.
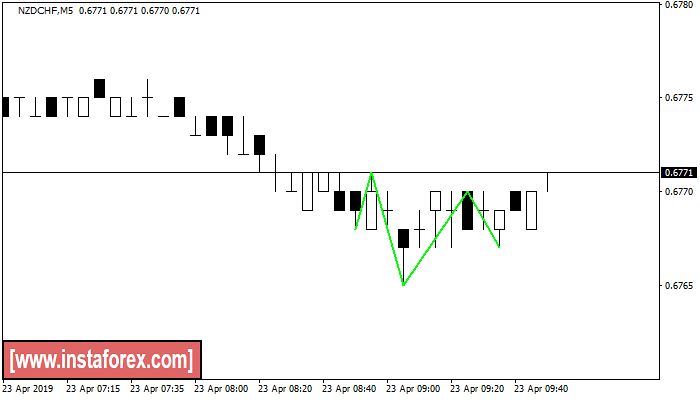
Inverse Head and Shoulder
was formed on 23.04 at 06:52:21 (UTC+0)
signal strength 1 of 5
According to the chart of M5, NZDCHF produced the pattern termed the Inverse Head and Shoulder. The Head is fixed at 0.6765 while the median line of the Neck is set at 0.6771/0.6770. The formation of the Inverse Head and Shoulder Pattern clearly indicates a reversal of the downward trend. In means that in case the scenario comes true, the price of NZDCHF will go towards 0.6785.
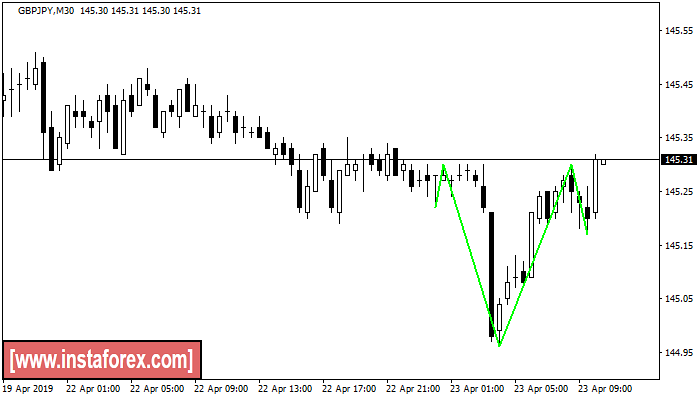
Inverse Head and Shoulder
was formed on 23.04 at 07:30:18 (UTC+0)
signal strength 3 of 5
According to the chart of M30, GBPJPY formed the Inverse Head and Shoulder pattern. The Head’s top is set at 145.30 while the median line of the Neck is found at 144.96/145.17. The formation of the Inverse Head and Shoulder pattern evidently signals a reversal of the downward trend. In other words, in case the scenario comes true, the price of GBPJPY will go towards 145.60
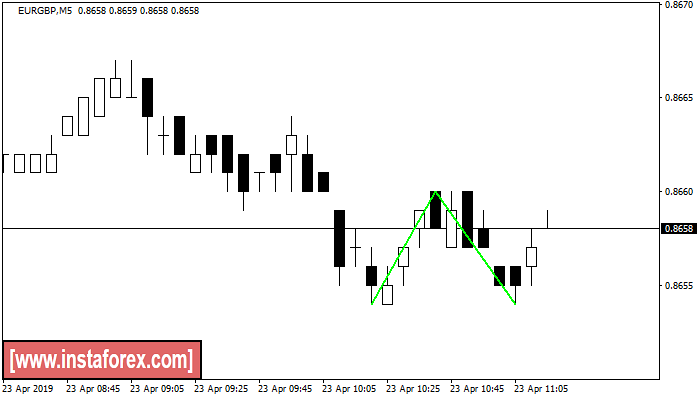
Double Bottom
was formed on 23.04 at 08:15:34 (UTC+0)
signal strength 1 of 5
The Double Bottom pattern has been formed on EURGBP M5; the upper boundary is 0.8660; the lower boundary is 0.8654. The width of the pattern is 6 points. In case of a break of the upper boundary 0.8660, a change in the trend can be predicted where the width of the pattern will coincide with the distance to a possible take profit level.
The M5 and M15 time frames may have more false entry points.
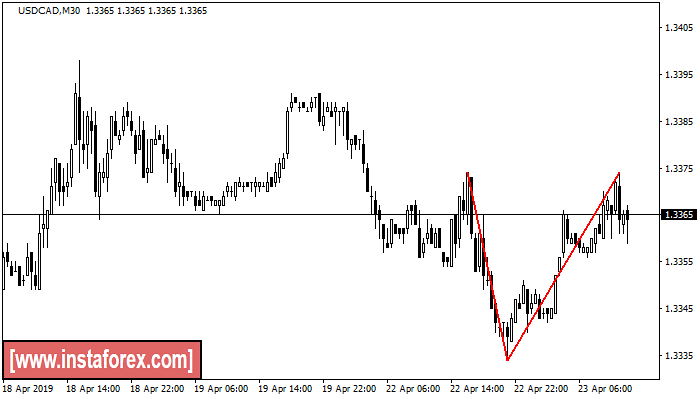
Double Top
was formed on 23.04 at 09:31:07 (UTC+0)
signal strength 3 of 5
The Double Top pattern has been formed on USDCAD M30. It signals that the trend has been changed from upwards to downwards. Probably, if the base of the pattern 1.3334 is broken, the downward movement will continue.
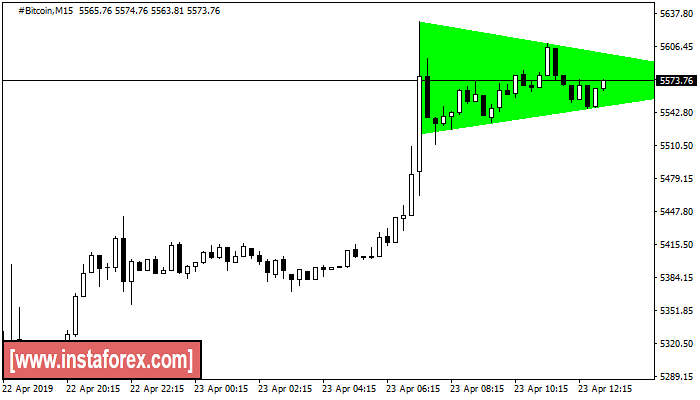
Bearish Symmetrical Triangle
was formed on 23.04 at 10:11:09 (UTC+0)
signal strength 2 of 5
According to the chart of M15, #Bitcoin formed the Bearish Symmetrical Triangle pattern. Trading recommendations: A breach of the lower border 5630.16 is likely to encourage a continuation of the downward trend.
The M5 and M15 time frames may have more false entry points.
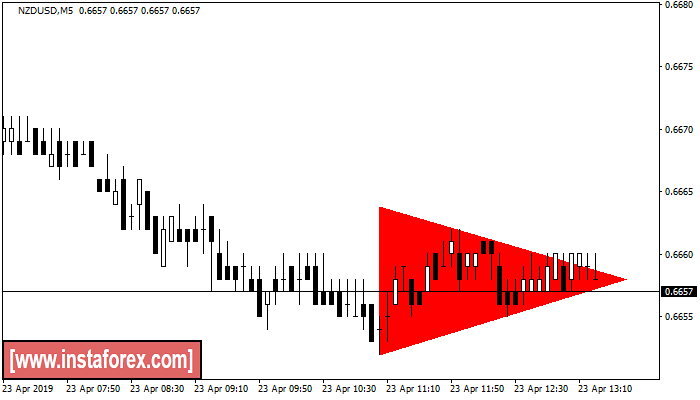
Bullish symmetrical triangle
was formed on 23.04 at 10:25:42 (UTC+0)
signal strength 1 of 5
According to the chart of M5, NZDUSD formed the Bullish symmetrical triangle pattern. Description: This is the pattern of a trend continuation. 0.6652 and 0.6664 are the coordinates of the upper and lower borders respectively. The pattern width is measured on the chart at -12 pips. Outlook: If the upper border 0.6652 is broken, the price is likely to continue its move by 0.6643 pips.
The M5 and M15 time frames may have more false entry points.
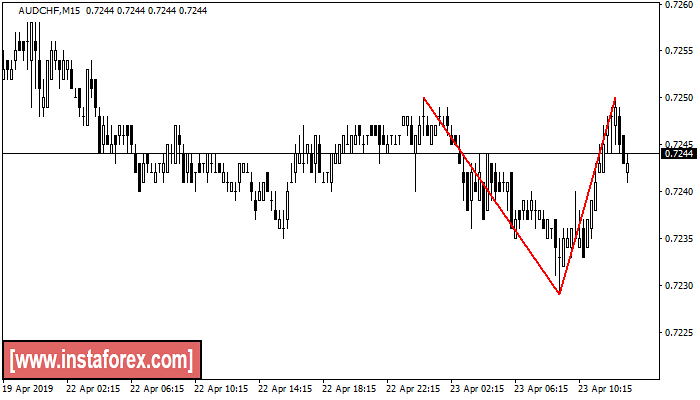
Double Top
was formed on 23.04 at 10:30:38 (UTC+0)
signal strength 2 of 5
The Double Top pattern has been formed on AUDCHF M15. It signals that the trend has been changed from upwards to downwards. Probably, if the base of the pattern 0.7229 is broken, the downward movement will continue.
The M5 and M15 time frames may have more false entry points.
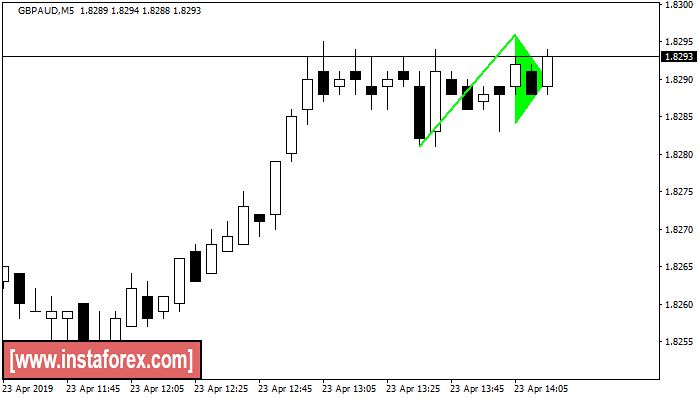
Bullish pennant
was formed on 23.04 at 11:18:11 (UTC+0)
signal strength 1 of 5
The Bullish pennant signal – Trading instrument GBPAUD M5, continuation pattern. Forecast: it is possible to set up a buy position above the pattern’s high of 1.8296, with the prospect of the next move being a projection of the flagpole height.
The M5 and M15 time frames may have more false entry points.
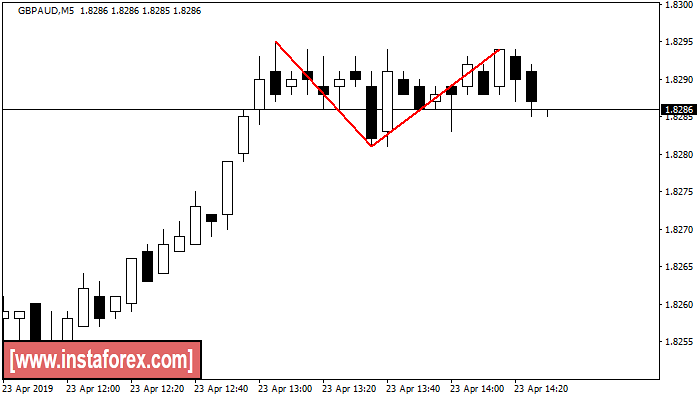
Double Top
was formed on 23.04 at 11:30:42 (UTC+0)
signal strength 1 of 5
The Double Top reversal pattern has been formed on GBPAUD M5. Characteristics: the upper boundary 1.8295; the lower boundary 1.8281; the width of the pattern is 13 points. Sell trades are better to be opened below the lower boundary 1.8281 with a possible movements towards the 1.8266 level.
The M5 and M15 time frames may have more false entry points.