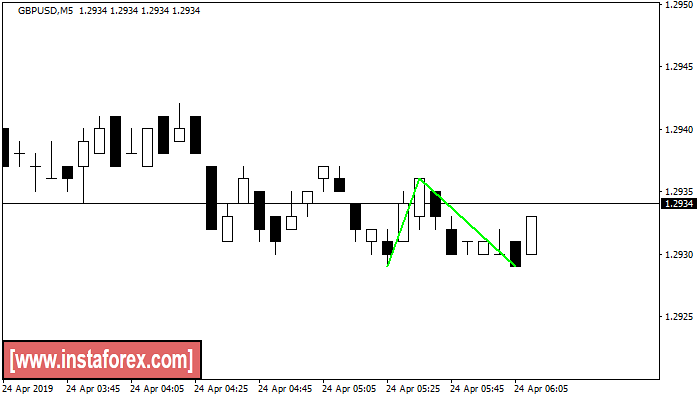
Double Bottom
was formed on 24.04 at 03:16:04 (UTC+0)
signal strength 1 of 5
The Double Bottom pattern has been formed on GBPUSD M5; the upper boundary is 1.2936; the lower boundary is 1.2929. The width of the pattern is 7 points. In case of a break of the upper boundary 1.2936, a change in the trend can be predicted where the width of the pattern will coincide with the distance to a possible take profit level.
The M5 and M15 time frames may have more false entry points.
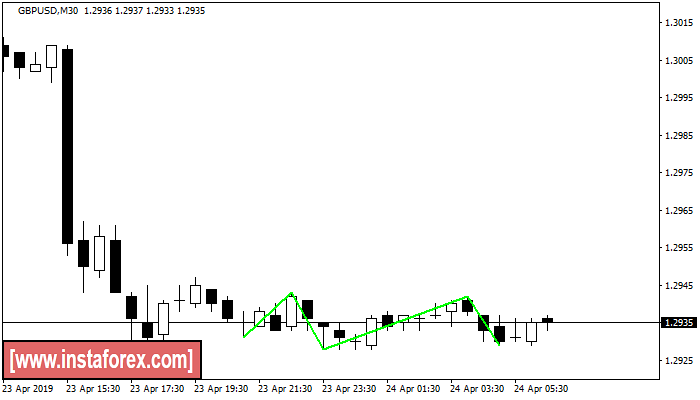
Triple Bottom
was formed on 24.04 at 04:00:31 (UTC+0)
signal strength 3 of 5
The Triple Bottom pattern has been formed on GBPUSD M30. It has the following characteristics: resistance level 1.2943/1.2942; support level 1.2931/1.2929; the width is 12 points. In the event of a breakdown of the resistance level of 1.2943, the price is likely to continue an upward movement at least to 1.2958.
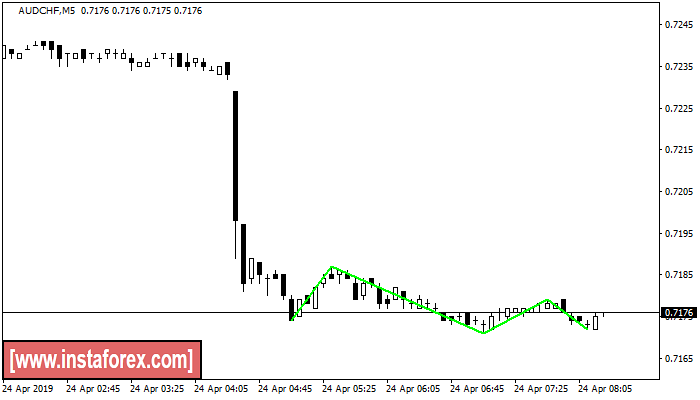
Triple Bottom
was formed on 24.04 at 05:21:21 (UTC+0)
signal strength 1 of 5
The Triple Bottom pattern has formed on the chart of AUDCHF M5. Features of the pattern: The lower line of the pattern has coordinates 0.7187 with the upper limit 0.7187/0.7179, the projection of the width is 13 points. The formation of the Triple Bottom pattern most likely indicates a change in the trend from downward to upward. This means that in the event of a breakdown of the resistance level 0.7174, the price is most likely to continue the upward movement.
The M5 and M15 time frames may have more false entry points.
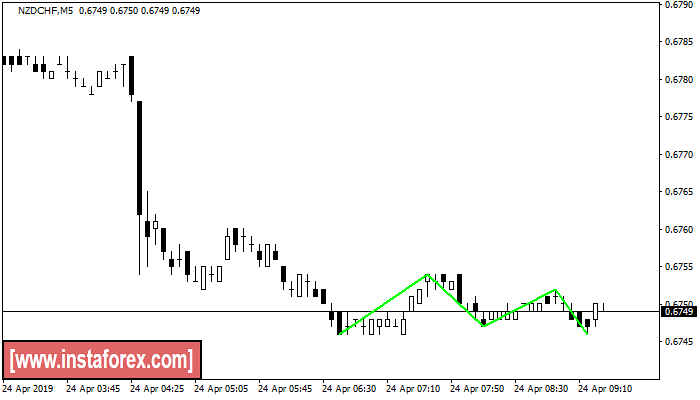
Triple Bottom
was formed on 24.04 at 06:25:18 (UTC+0)
signal strength 1 of 5
The Triple Bottom pattern has formed on the chart of the NZDCHF M5 trading instrument. The pattern signals a change in the trend from downwards to upwards in the case of breakdown of 0.6754/0.6752.
The M5 and M15 time frames may have more false entry points.
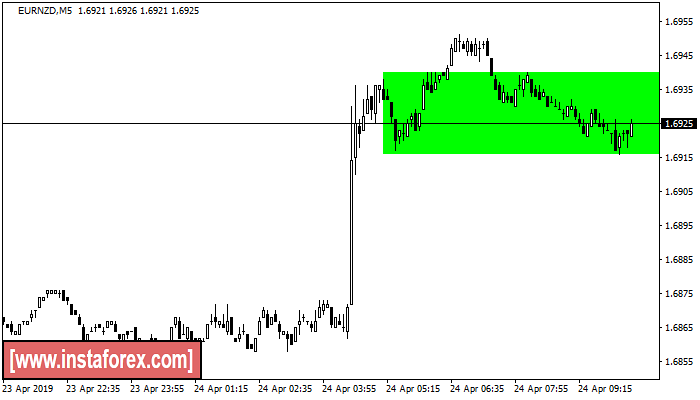
Bearish Rectangle
was formed on 24.04 at 07:23:03 (UTC+0)
signal strength 1 of 5
According to the chart of M5, EURNZD formed the Bearish Rectangle which is a pattern of a trend continuation. The pattern is contained within the following borders: the lower border 1.6916 – 1.6916 and upper border 1.6940 – 1.6940. In case the upper border is broken, the instrument is likely to follow the upward trend.
The M5 and M15 time frames may have more false entry points.
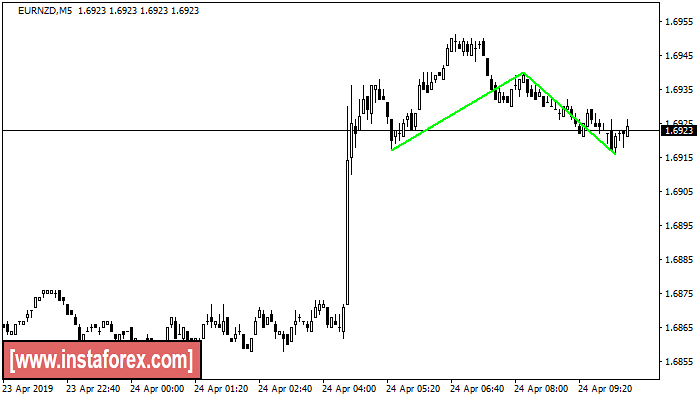
Double Bottom
was formed on 24.04 at 07:25:31 (UTC+0)
signal strength 1 of 5
The Double Bottom pattern has been formed on EURNZD M5; the upper boundary is 1.6940; the lower boundary is 1.6916. The width of the pattern is 23 points. In case of a break of the upper boundary 1.6940, a change in the trend can be predicted where the width of the pattern will coincide with the distance to a possible take profit level.
The M5 and M15 time frames may have more false entry points.
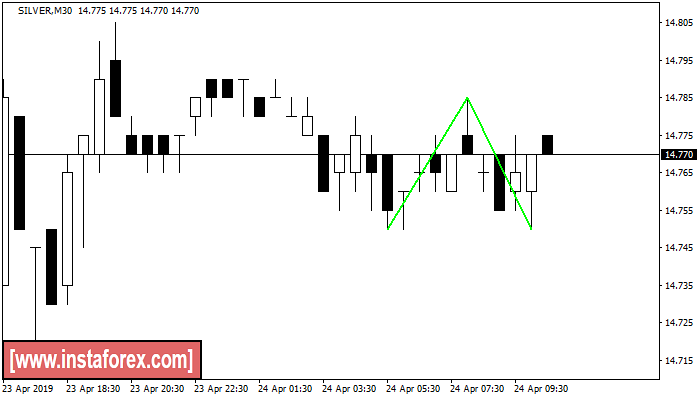
Double Bottom
was formed on 24.04 at 07:31:04 (UTC+0)
signal strength 3 of 5
The Double Bottom pattern has been formed on SILVER M30. Characteristics: the support level 14.75; the resistance level 14.79; the width of the pattern 35 points. If the resistance level is broken, a change in the trend can be predicted with the first target point lying at the distance of 35 points.
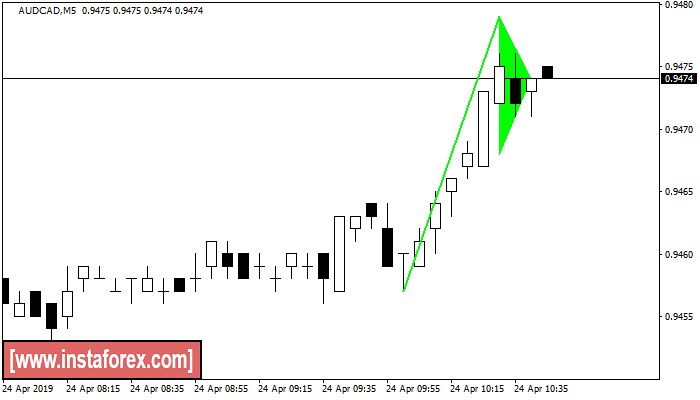
Bullish pennant
was formed on 24.04 at 07:46:04 (UTC+0)
signal strength 1 of 5
The Bullish pennant graphic pattern has formed on the AUDCAD M5 instrument. This pattern type falls under the category of continuation patterns. In this case, if the quote can breaks out high, is expected to continue the upward trend to level 0.9494.
The M5 and M15 time frames may have more false entry points.
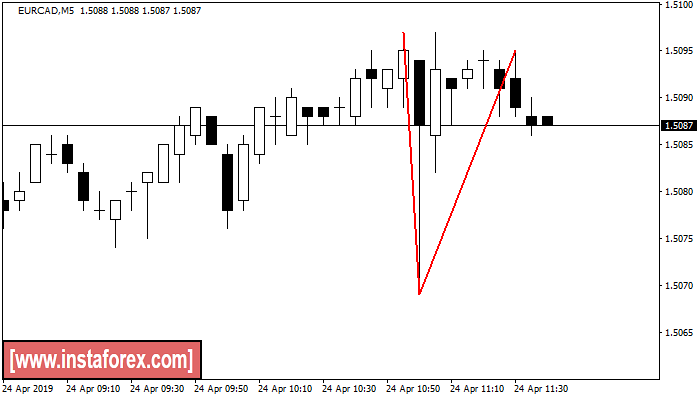
Double Top
was formed on 24.04 at 08:40:33 (UTC+0)
signal strength 1 of 5
On the chart of EURCAD M5 the Double Top reversal pattern has been formed. Characteristics: the upper boundary 1.5095; the lower boundary 1.5069; the width of the pattern 26 points. The signal: a break of the lower boundary will cause continuation of the downward trend targeting the 1.5054 level.
The M5 and M15 time frames may have more false entry points.
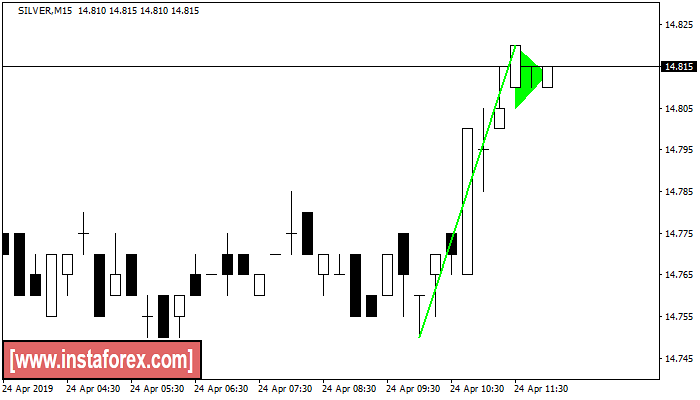
Bullish pennant
was formed on 24.04 at 09:06:09 (UTC+0)
signal strength 2 of 5
The Bullish pennant pattern is formed on the SILVER M15 chart. It is a type of the continuation pattern. Supposedly, in case the price is fixed above the pennant’s high of 14.82, a further uptrend is possible.
The M5 and M15 time frames may have more false entry points.