BTC USD 81,038.9 Gold USD 4,378.12
Time now: Jun 1, 12:00 AM

Analysis GBP/JPY

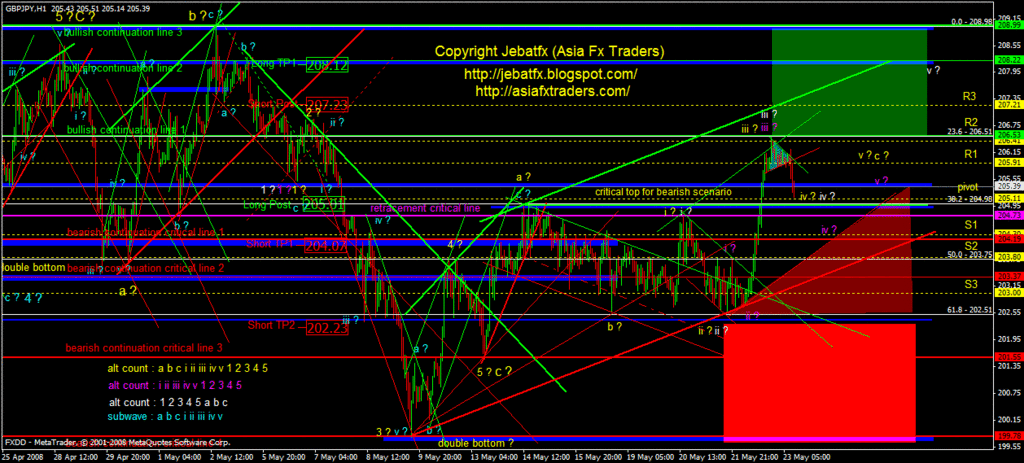
23may08415pm1h-1.gif


At this moment, I believed market already in retracement phase to complete wave iv before another bullish continuation to complete wave v. Unless we see a breakout to the retracement critical line, preferably wave iv (yellow/white) already completed. Otherwise we may consider an alt count in magenta.

But according to the technical analysis at BSTS daily and weekly chart, it not showing a good signal for a strong bullish trend which therefore please be carefull for any "bullish trap" scenario. So, advisable to wait an entry for a bearish reversal trend instead of bullish continuation. And also, please consider that wave v maybe only a truncated wave. Good luck and happy weekends.
 
Last edited:
23may081054pm1hhy1.gif


Due to the breakout of my previous retracement critical line, I have to recount the possible wave and came out as stated in the updated chart. I believed wave iv will be completed soon and preferably there will be a bullish continuation trend to complete wave v either a truncated or an impulsive wave.

Therefore, please look any good signal for a bullish continuation trend and later (favourably by next week) for a bearish reversal trend after completion of wave v. Happy weekends
 
Price make a retracement and try to breakout the daily pivot 205.05. If breakout, my prediction is price will move downward to find another support level at 204.38 or reaction at bottom trendline around 203.70. Otherwise price maybe move upward if cannot breakout the pivot or middle trendline and perhaps make a double top or continue move upward to find the next level of resistants to break (pink horizontal lines).


gja3hb4.gif


Now price already touch my previous prediction support at 204.38 and I'm looking for the next support at bottom trendline if price manage to breakout from this level soon. However, because of tonight is end of the week for trading day and market will be closed later probably price difficult to achieve on that level. Therefore we will see what happen next week. Good luck & happy weekend to all CG members.


gja4or3.gif
 
Gbp vs Jpy 1H, 4H & Daily Pre Market Overview

25may08pmo1hpa2.gif


Chart 1H - At this moment, I believed wave iv already completed and looking forward for a bullish continuation to complete wave v. Please noted that there is 3 possible scenario for wave v later which is either :-

1) Yellow truncated - which ic wave v only perform a double top before another major bearish reversal trend.
2) Magenta truncated - which is wave v will be more shorter before anoher major bearish reversal trend.
3) White impulse - which is wave v will be an impulsive wave with condition there will be a true strong breakout to the bullish continuation critical line 1.

Advisable to look for a good bearish reversal signal later from BSTS.

25may08pmo4hxe4.gif


Chart 4H - Please analyse all the alternate counts and my 3 divided zones which are :-

1) Green Rectangle Zone - bias to a bullish trend which is preferably for alt count in white.
2) Maroon Triangle Zone - bias to a bearish bias trend which is preferably once wave v is completed.
3) Red Rectangle Zone - bias to a strong bearish trend which is preferably market in determination to complete subwave c in aqua and wave B in yellow.

25may08pmodailyet0.gif


Chart Daily - Please noted that I did some changes for yellow wave count and as long the upper green major trendline stay as a strong resistance, preferably we shall see a major bearish trend later to complete subwave c (cyan) and wave b (yellow) or wave 5 and C in magenta. Otherwise if the trendline is taken and its a true breakout, then perhaps market is favourably to alt count in white. Look carefully for any breakout to my teal triangle zones.

Summary :

1) Looking forward for a bullish continuation trend to complete wave v.

2) Wave v could be a truncated wave (magenta or yellow) or an impulsive wave (white).

3) Please analyse all 3 possible counts and determine which one is more favourable by applying to it with your trading system (BSTS).

4) Advisable to standby for a major bearish reversal trend once wave v is completed.

Good luck.
 
Tiada kata-kata yang lebih baik dari Jebat/prof/One.
Just to include my chart TF4H.I'm looking for possibility of higher C at around 208.15-97.Hovever break 203.30 lower target is the near term.
gj4h-7.gif
 
Last edited:
23may08415pm1h-1.gif


At this moment, I believed market already in retracement phase to complete wave iv before another bullish continuation to complete wave v. Unless we see a breakout to the retracement critical line, preferably wave iv (yellow/white) already completed. Otherwise we may consider an alt count in magenta.

But according to the technical analysis at BSTS daily and weekly chart, it not showing a good signal for a strong bullish trend which therefore please be carefull for any "bullish trap" scenario. So, advisable to wait an entry for a bearish reversal trend instead of bullish continuation. And also, please consider that wave v maybe only a truncated wave. Good luck and happy weekends.


penuh warna warni la ko punya chart:)paid
 
penuh warna warni la ko punya chart:)paid

saja je masta, warna warna malaysia. Harap mudah sikit pembaca nak faham if colour coded. Good luck.

26may081030am1hoy5.gif


I believed market in progress to complete wave v (either magenta/yellow/white) and looking forward for a bearish reversal trend later this week. Please refer to my previous 1H PMO analysis comments for further detail. Preferably - a truncated wave v. Have a nice day.
 
27may081215am1hbj7.gif


I strongly believed wave v in progress and looking forward for a bearish reversal signal later once wave v is completed within this few days. Therefore please watch closely the magenta and yellow count. Otherwise if there is a true breakout to my bullish continuation critical line 1, then this scenario would be invalid. Good luck.
 
27may08925am1hzb6.gif


Expecting for a completion of wave v later, which preferably a truncated wave (magenta or yellow). Advisable to wait for a bearish reversal signal later from BSTS. Please watch closely the teal triangle for any breakout. Please noted that this scenario will be invalid if there is any true breakout to the bullish continuation line 1 later which favourably to count in white. Happy trading.
 
27may08752pm1htj8.gif


Until this moment, price already make a false breakout to my previous upper green triangle trendline. Please noted that there got possibility that a truncated wave v already completed (magenta). An establishment of a Head & Shoulder pattern (yellow triangle x 3) and a breakout to the bearish continuation critical line 1 would bolster this idea.

Otherwise if the price going further up, then we left with 2 more possibility either the yellow count or white count. Therefore, please make an entry with SL when there is a good bearish reversal signal from BSTS. Good luck.
 

Live Forex Chart

Currency
Rates
EUR / USD
1.14860
USD / JPY
156.877
GBP / USD
1.33765
USD / CHF
0.82250
USD / CAD
1.39985
EUR / JPY
180.138
AUD / USD
0.71167
Back
Top
Log in Register