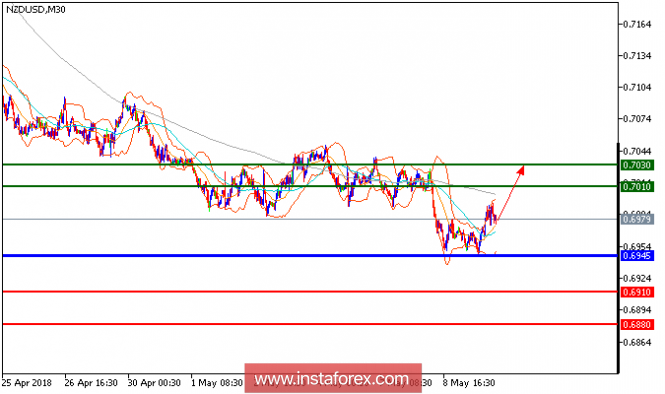
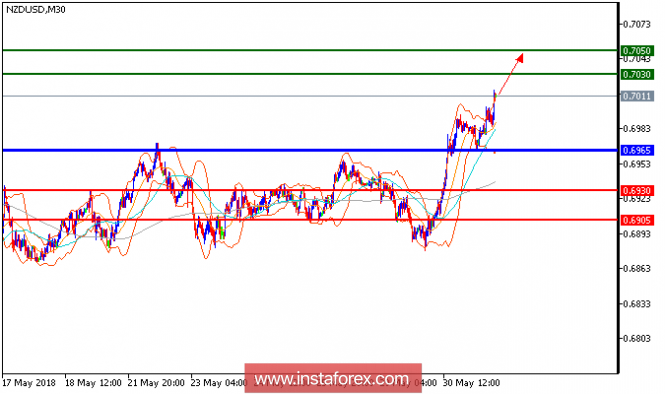
NZD/USD is expected to trade with bullish outlook and pair is expected to continue its rebound. The pair validated a bullish reversal yesterday and is expected to post a new rebound. The relative strength index is positive above its neutrality area at 50. Last but not least, a bullish cross has been identified between the 20-period and 50-period moving averages. Therefore, as long as 0.6945 is not broken, look for further advance to 0.7010 and 0.7030 in extension.
Chart Explanation: The black line shows the pivot point. Currently, the price is above the pivot point, which is a signal for long positions. If it remains below the pivot point, it will indicate short positions. The red lines show the support levels, while the green line indicates the resistance levels. These levels can be used to enter and exit trades.
Resistance levels: 0.7010, 0.7030, and 0.7075.
Support levels: 0.6910, 0.6880, and 0.6850.
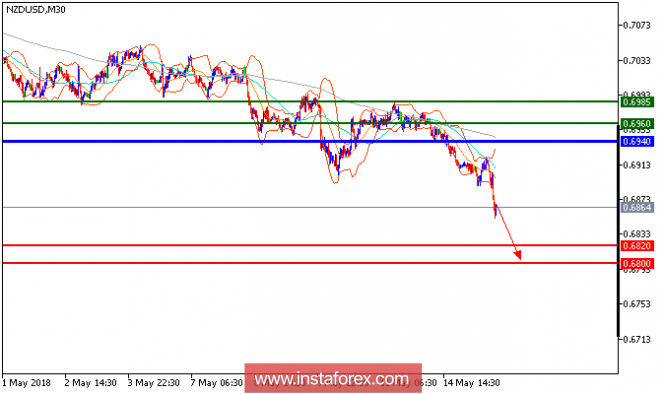
All our downside targets which we predicted in yesterday's analysis have been hit. The pair recorded a series of lower tops and lower bottoms since May 11, which confirmed a negative outlook. Both declining 20-period and 50-period moving averages should push prices lower. The relative strength index is bearish and calls for a further downside. Hence, as long as 0.6940 holds on the upside, look for a drop with targets at 0.6820 and 0.6800 in extension.
Chart Explanation: The black line shows the pivot point. Currently, the price is above the pivot point which is a signal for long positions. If it remains below the pivot point, it will indicate short positions. The red lines show the support levels, while the green line indicates the resistance levels. These levels can be used to enter and exit trades.
Resistance levels: 0.6960, 0.6985, and 0.7010
Support levels: 0.6820, 0.6800, and 0.6750
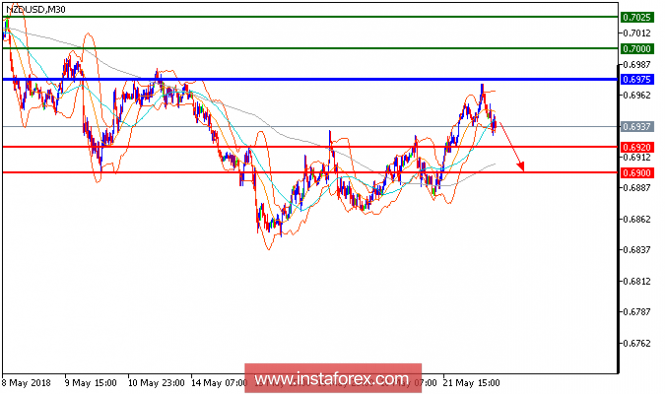
NZD/USD is expected to trade with a bearish outlook. The pair accelerated on the downside and is trading below its declining 20-period and 50-period moving averages. The relative strength index broke below its oversold level of 30, but has not displayed any reversal signal. To conclude, as long as 0.6975 is not surpassed, look for a drop to 0.6920 . A break below this level would trigger a further downside to 0.6900.
Chart Explanation: The black line shows the pivot point. Currently, the price is above the pivot point which is a signal for long positions. If it remains below the pivot point, it will indicate short positions. The red lines show the support levels, while the green line indicates the resistance levels. These levels can be used to enter and exit trades.
Resistance levels: 0.7000, 0.7025, and 0.7050
Support levels: 0.6920, 0.6900, and 0.6850
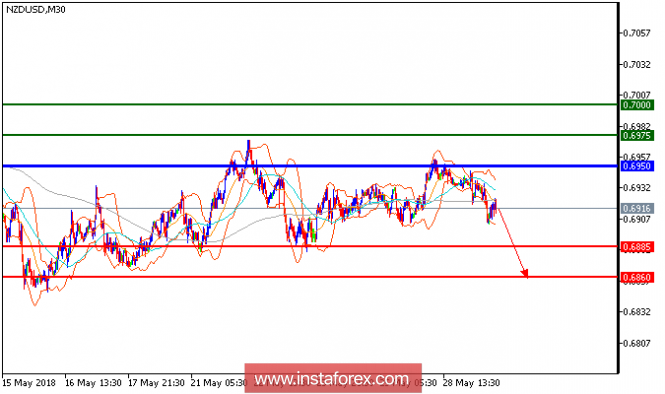
NZD/USD is under pressure. The pair is trading in a lower range, and is likely to test the next support at 0.6885 in the coming trading hours. A bearish cross has been identified between the 20-period and 50-period moving averages (a negative signal). Last but not least, the relative strength index is below its neutrality area at 50. In which case, as long as 0.6950 is not surpassed, look for a new pullback towards 0.6885.
Chart Explanation: The black line shows the pivot point. Currently, the price is above the pivot point which is a signal for long positions. If it remains below the pivot point, it will indicate short positions. The red lines show the support levels, while the green line indicates the resistance levels. These levels can be used to enter and exit trades.
Resistance levels: 0.6975, 0.7000, and 0.7040
Support levels: 0.6885, 0.6860, and 0.6825
Fundamental outlook:
Earlier today New Zealand business confidence and firms' views of their own activity eased 4 points in May, with a net 27% of businesses now pessimistic about the year ahead. Companies' views of their own activity dipped to +14, the lowest since November. New Zealand business confidence has softened, sending a warning signal to the still fledgling center-left government. It seems there is plenty to worry about with ANZ's measure of business confidence sinking toward the cycle lows after last year's election.
Chart Explanation: The black line shows the pivot point. Currently, the price is above the pivot point which is a signal for long positions. If it remains below the pivot point, it will indicate short positions. The red lines show the support levels, while the green line indicates the resistance levels. These levels can be used to enter and exit trades.
Resistance levels: 0.7030, 0.7050, and 0.7075
Support levels: 0.6930, 0.6905, and 0.6835
Overview:
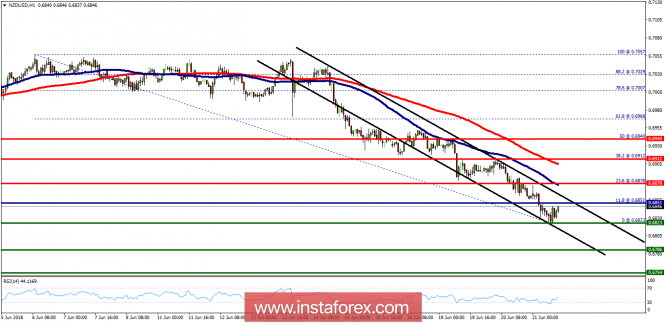
The NZD/USD pair faces resistance at 0.6878, while strong resistance is seen at 0.6912. Support is found at 0.6823 and 0.6786 levels. Today, the NZD/USD pair continues to move downwards from 0.6851 level. The pair fell from 0.6851 level to the bottom around 0.6823. In consequence, the NZD/USD pair broke support at 0.6878 which turned into resistance.
The 0.6878 level is expected to act as minor resistance. Hence, we expect the NZD/USD pair to continue moving in the bearish trend from 0.6878 level towards the target at 0.6823.
In the long term, if the pair succeeds in passing through 0.6823 level , the market will indicate the bearish opportunity below 0.6823 level in order to reach the second target at 0.6786 in the H1 time frame. However, the 0.6786 mark remains a significant support zone. Thus, the trend will probably rebound again from 0.6754 level as long as this level is not breached.