BTC USD 84,751.8 Gold USD 4,359.75
Time now: Jun 1, 12:00 AM

SuperForex Technical Analysis & Daily Chart

fxmysia

Fun Poster
Messages
870
Joined
Oct 30, 2009
Messages
870
Reaction score
6
Points
15
EUR/USD Technical Analysis

General Analysis

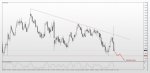
On the background of the latest news from the presidential election in America the EUR/USD currency pair started to decline sharply.

At the time when Clinton was in the lead the dollar began to fall but when it became known that Trump is likely to win this rally market turned around and started to increase.

Right now there is a decreasing formation on the chart and yesterday's daily candle has a very high volatility of almost 420 points, which in itself could lead to a short-term price correction today.

The Stochastic indicator show us the prevalence of a decline in the EUR/USD rate and gives a clear signal to sell.

The closest support level for the price reduction will be the level 1.0800, with whose penetration the new target to fall will open (1.0720 and 1.0680).

The Next Few Days

We expect a continuation of the decrease in this currency instrument. Most likely we will see testing of the support level at 1.0800 next week.

There is a possibility of a short-term correction but after the results of the latest news from the American region the general direction for the currency pair EUR/USD is down.


https://superforex.com/analytics/1100
 

Attachments

  • 62.6 KB Views: 31
Last edited:
AUD/USD Technical Analysis & Daily Chart
08/11/16 10:44 AM

Article Image
General Analysis
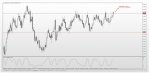
At the end of last week the currency pair AUD/USD broke through the resistance level at 0.7710. Over the last month this level was a significant barrier for the price growth. Meanwhile, the resistance at 0.7710 was an upper bound of the price channel 0.7710-0.7450. After breaking through the level the price has fixed above the level and now it shows the so-called "back testing."

According to the rules of technical analysis the possible price movement due to the penetration of the resistance line is measured by the channel height, so we can see the Australian dollar at 0.7830 in the near future.

The Stochastic indicator shows us a clear Buy but the signal line is already included in the overbought zone.

The Next Few days
We recommend opening long positions on the AUD/USD after the start of the upward movement from the support at 0.7710. The point of entry must be sought at hourly and half-hourly timeframes. You can open a buy position after the formation of a "doji" near the support or other reversal figures.

We recommend to set up the S/L order at 0.7670.
 

Attachments

GBP/JPY and The Golden Opportunity
15/11/16 11:40 AM

Article Image
Last week we focused on the American election on November 8 and we saw the surprising result of Donald Trump being elected as the next American president despite most people and polls seemingly favoring Hillary Clinton.

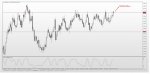
On November 9 the GBP/JPY pair declined after facing selloff trades on the background of the American presidential election. The pair touched the ascending trendline on a 4h timetrame at 127.20 and in its demand zone we can see the RSI Indicator 4 was touching level 10, after which the pair quickly began to rise again after touching the demand zone.

Now the pair is trading around 134.40 and it’s expected that the GBP/JPY will make a correction to touch the support key around 131.50 and retest the broken downside trend line, then rise back.

Currently we can see the last upside wave from the bottom 126.67 to the last top at 135.60. We expect that the pair will build the corrective waves as we mentioned to touch 50% at least to 131.50, as we said, within the upcoming days.

If we look at the RSI 4 Indicator we’ll see it reached level 90, and the below trend indicator gave us the brown color sell signal.

The Next Few Days

For the time being the pair has been recovering some composure, so the required action to place sell positions will have to wait till the pair trades below 134.20. When this is done we can sell the pair and take profits at 132.90 as first target and 131.50 as a second one.

On the other hand, if the pair reaches up to 135.70 we have to buy it till 136.30 and wait for the next report from SuperForex Research Team.

 
AUD/USD Technical Analysis & Daily Chart
08/11/16 10:44 AM


Article Image
General Analysis
At the end of last week the currency pair AUD/USD broke through the resistance level at 0.7710. Over the last month this level was a significant barrier for the price growth. Meanwhile, the resistance at 0.7710 was an upper bound of the price channel 0.7710-0.7450. After breaking through the level the price has fixed above the level and now it shows the so-called "back testing."

According to the rules of technical analysis the possible price movement due to the penetration of the resistance line is measured by the channel height, so we can see the Australian dollar at 0.7830 in the near future.

The Stochastic indicator shows us a clear Buy but the signal line is already included in the overbought zone.

The Next Few days
We recommend opening long positions on the AUD/USD after the start of the upward movement from the support at 0.7710. The point of entry must be sought at hourly and half-hourly timeframes. You can open a buy position after the formation of a "doji" near the support or other reversal figures.

We recommend to set up the S/L order at 0.7670.
 

Attachments

CAD/JPY Short Review & Forecast
16/11/16 11:06 AM

Article Image
The Forex market, which is now entirely under the influence of the US dollar rates, remains fragile. This is especially true if we are talking about highly volatile trading tools.

The Canadian dollar strengthened against the Japanese yen, not solely because CAD/JPY is a cross rate. Changes in the political situation in the United States, the USD strengthening, positive forecasts for the American economy, recent data about the growth in retail trades and the reduction of unemployment in the States, have all had a positive impact on the economy of the neighboring country, Canada.

On the other hand, we need to consider also the situation on the commodity market. Oil this week began rising in price, due to new hopes that the oil-exporting countries may finally reach some agreement on reducing the crude oil extraction. The only question is under what conditions this would come to be.
 

Attachments

As of today (Friday, November 25) the oil prices have sunk by 1% as a result of a combination of factors – the consistently strong dollar, Saudi Arabia’s increase in exports to Asia, and a smaller demand for imports in China.

Brent crude oil is currently trading at $48.42, down 1.2%, though some of this may be a result of the general inactivity in the United States as the country celebrates a Thanksgiving long weekend. The WTI crude is at $47.41 per barrel, also 1.2% down from its price at the previous market close.

The main reason for the drop in prices is the dollar that is currently in its 13-year highest point. With an expensive dollar the absolute value of oil in importing countries becomes greater, so they try to compensate by curbing on their supply, which generally decreases the price of oil.

There is, of course, the upcoming OPEC meeting to consider – oil exporting countries are expected to agree on a reduction in oil extraction, which would help alleviate the oversupplied market and stabilize prices. However, even if a decision is reached, it won’t come into at least until February. There are speculations that Saudi Arabia may try to market more to Asian countries in January, before the limitations (if there are any) come into effect, according to Reuters. This would be seen as a response to Russia, as the two countries seem to be fighting over China, more specifically who will be the number one oil supplier to the biggest importer in the world. Previously it was the Saudis, but recently Russia gained an advantage over them.

The OPEC meeting on November 30 is supposed to bring more clarity and calm the oil market substantially. However, there were other meetings recently that failed to produce the desired effect because OPEC member states seem to be in a disagreement as to who should cut how much of their oil extraction. Most of these countries’ GDP is entirely reliant on oil revenue, so it’s no wonder why some would be unwilling to cut production.

In light of these agreement struggles traders are not very optimistic – they expect that even if a decision is reached (which might not happen), it might not be of the appropriate scale in order to compensate for the massive oversupply of the past two years.
 
USD/SEK: Brief Review & Forecast
28/11/16 10:57 AM

Article Image
The US dollar achieved its many years' maximum level over the past weeks and influenced the rates of most trading tools; the USD/SEK is no exception. Positive data about the economy of Sweden - a 3% GDP growth in 2016 and inflation level below target, have not changed the situation in favor of the Swedish Krona under the current situation on the market.

USD/SEK daily chart
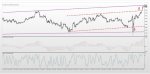
We can see on the chart a rapid upward trend which has been present since April 2016. It’s not worth waiting for the trend's reversal in the near future. The USD can continue its growth and keep at a high level on expectations of rate changes by the Federal Reserve and the policy of Donald Trump.

The MACD oscillator shows that the peak of prices has been reached and after this the price will go down. This is arguable but in the near future, indeed, we can expect a certain correction of the price, so in the short-term it's better to open deals to sell. In the middle term the price will remain in the frames of the current uptrend.
 
EUR/CHF Technical
General Analysis
Yesterday's trading day for the EUR/CHF currency pair showed an unusually big volatility during the day and by the end of the day closed with a parity at the level of 1.0774.
First, the initiative on the market was for the Bulls and the price began to rise rapidly reaching its peak level at 1.0815, thereby breaking the resistance level 1.0800.
However, the price was unable above this level and after the opening of the US session the market turned around and the price began to decline.

Following the results of the day the pair closed at the same level at which it started its move this morning - 1.0774.

The Next Few Days
Testing the resistance level 1.0800 with a further decline speaks about the weakness of the uptrend and the fact that it is possible for the price to resume its movement in the medium-term downtrend.

We recommend closing all previously open long position on the EUR/CHF and considering the possibility of selling after a decline below 1.0750.

The target point for the profit for selling below 1.0750 will be the levels 1.0705 and 1.0690. Analysis & Daily Chart
 
jkGUjLo.jpg


Analisa Teknikal GBPUSD

Pada hari ini di United Kingdom, Bank of England telah mengeluarkan sebuah laporan mengenai inflasi dimana angka inflasi semasa akan diumumkan dan samada mereka mencapai aras sasaran. Berlatarbelakngkan peningkatan terkini terhadap kadar faedah asas sehingga 0.5%, kami mengjangkakan Bank of England akan menerukan untuk mengambil langkah agar menguatkan matawang kebangsaan. Walaubagaimanapun, berlatarbelakangkan konflik politik, termasuk rundingan berpanjangan sehingga penggal Brexit, dimana masih mempunyai impak negatif terhadap matawang United Kingdom, kami melihat pergerakan carta adalah mendatar.

Semasa mengkaji carta tersebut, kami boleh melihat bahawa pasangan menemukan rintangan di aras 1.3285 dan kini menghampirinya sekali lagi. Walaubagaimanapun, indikator teknikal menunjukkan kepada kami bahawa pergerakan ke atas mula kehilangan momentum dan mungkin tidak menghampiri aras ini.

Pada ketika ini, Stochastic mencatatkan jualan dan RSI berkurangan sangat tinggi.

Untuk kes ini, kami mengjangkakan pergerakan jangka sederhana di saluran, dimana garisan terendah untuk kami adalah di aras 1.3190. Sekiranya berlaku perlanggaran pada aras ini, dijangkakan laluan seterusnya untuk harga menuju ke aras 1.3135.
 
e42d256c6e2b9608d4db7bc860f11da6.jpg


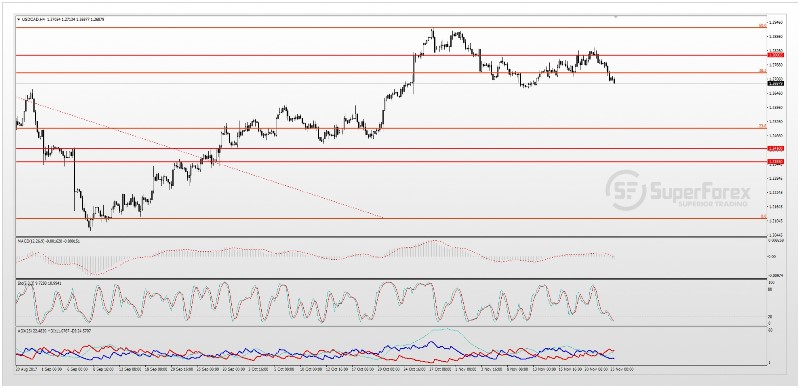
Analisa Teknikal USD/CAD


Hari ini merupakan Hari Kesyukuran yang diraikan di Amerika Syarikat dan bursa saham AS tidak beroperasi pada hari tersebut.

Semalam, beberapa angka petunjuk makroekonomi memberi kesan kepada keadaan ekonomi yang dikeluarkan di Amerika. Data yang telah di keluarkan menunjukkan campuran yang dinamik. Dolar AS bersambung untuk mengalami kerugian berkaitan dengan matawang utama semenjak Selasa.

Selain itu, dolar tertekan oleh beberapa angka untuk faktor fundamental yang lain berkaitan dengan permutasi didalam Fed, dan juga prospek untuk penerimaan pembaharuan cukai.

Bagi dolar Canada pula, pada ketika ini ia adalah relatif stabil dan berlawanan dengan latarbelakang kenaikan harga minyak, ia cuba untuk menguatkan posisi.
Semasa mempertimbangkan carta, kami boleh memerhati pergerakan menurun telah terbentuk dari aras 1.2810.

Petunjuk teknikal juga mengesahkan pergerakan harga menurun, oskilator MACD menghampiri tanda kosong dan condong kepada zone negatif. Stochastic meneruskan untuk berada di zon terlebih jual, dan ADX pasti kepada aliran turun.

Kami cadangkan untuk melihat kepada poin untuk memasuki posisi jual berdekatan aras 1.2700.
 

Live Forex Chart

Currency
Rates
EUR / USD
1.14861
USD / JPY
157.333
GBP / USD
1.33913
USD / CHF
0.82153
USD / CAD
1.39967
EUR / JPY
180.714
AUD / USD
0.71357
Back
Top
Log in Register