BTC USD 84,355.8 Gold USD 4,274.11
Time now: Jun 1, 12:00 AM

NPBFX - npbfx.com

XAG/USD: technical analysis on 13/07/2017

Good afternoon, dear forum visitors!

NPBFX offers the latest release of analytics on the XAG/USD for a better understanding of the current market situation and more efficient trading.

XAG/USD, D1

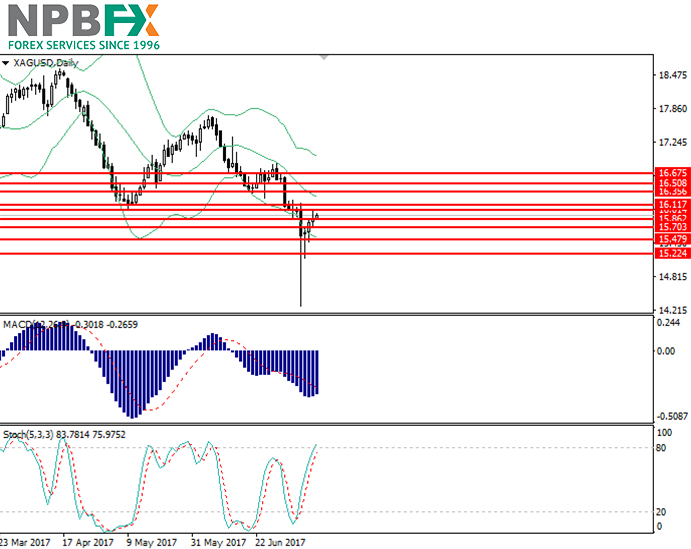
On the D1 chart the instrument is testing the support level of 15.85. Bollinger Bands are directed downwards, while the price range remains unchanged which is the reason for changing the trend into the downward one. MACD histogram is in the negative zone keeping the sale signal. Stochastic entered the overbought zone.
32.jpg


XAG/USD, H4

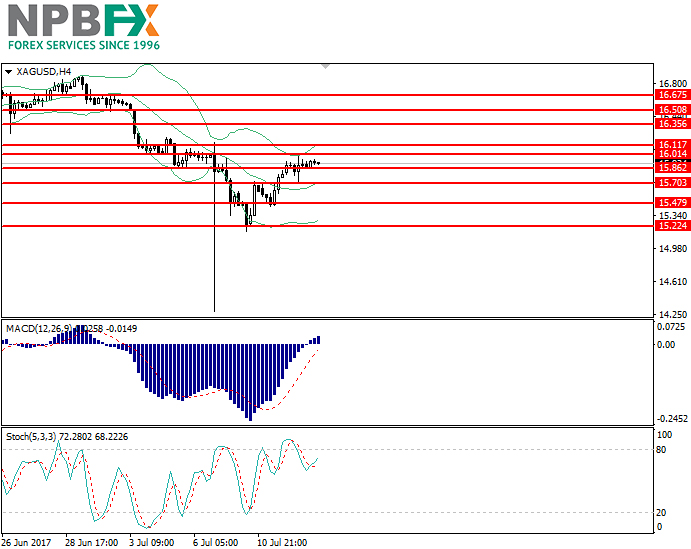
On the H4 chart the instrument is trading in the upper part of Bollinger Bands. The indicators is reversing upwards, and the price range has slightly widened confirming the continuation of the current trend. MACD histogram is near the balance zone with its volumes growing and is forming a weak buy signal. Stochastic is approaching the overbought zone.
322.jpg


Key levels

Support levels: 15.85, 15.48, 15.30, 15.22.

Resistance levels: 16.00, 16.11, 16.35, 16.50, 16.65.

Trading tips

Long positions may be opened from the current price with targets at 16.25, 16.35 and stop-loss at 15.80. The period of implementation is 1 day.

Short positions may be opened from the level of 15.80 with targets at 15.50 and stop-loss at 15.95. The period of implementation is 1 day.

Use more opportunities of the NPBFX analytical portal: trading signals for commodities

How can a trader determine if it’s worth buying or selling XAG now or better waiting for a more favorable period? Use trading signals for commodities from the top 10 technical indicators on the NPBFX portal and make the right decisions! All registered users have free and unlimited access to the minutely updated trading signals (MA10, BBands, Ichimoku, Stochastic, ZigZag, etc.) for Gold, Silver, Brent and WTI Crude oil.

If you have any questions about trading instruments, you can always ask an analyst in the online chat on the portal and get a free consultation of an experienced specialist.

Use the current recommendations of analysts on XAG/USD and trade efficiently with NPBFX.
 
How to be confident in your trading decisions? Use technical indicators on the NPBFX portal!

Good afternoon, dear forum visitors!

Ind.jpg


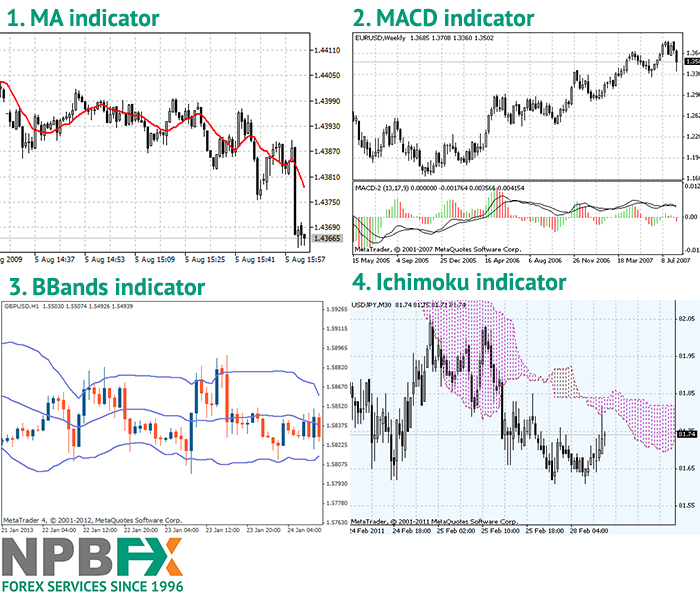
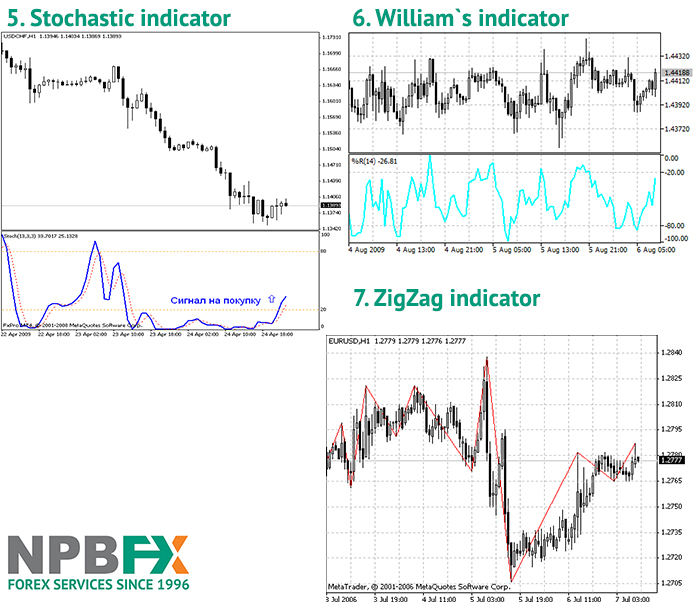
Technical indicators allow traders to assess the current situation and future trends in the Forex market, helping to prognose the price fluctuations on which you can earn. Exactly the indicators form trading signals for buying, selling or waiting for the trading instruments. Market indicators are a kind of the basis for a trader's decision on selling or buying currency, as well as they are useful with other instruments, for example, CFD contracts. On the NPBFX analytical portal you can find free trading signals based on the 10 most popular technical indicators - MA10, MA20, MA50, MA100, MACD, BBands, Ichimoku, Stochastic, William`s, ZigZag, which will be discussed more detailed today.

The review of 10 main indicators on the NPBFX online portal

Traders actively use several basic graphic indicators, which give the most exact and reliable prognoses. So they are used on the NPBFX analytical portal to generate trading signals. The indicators on the analytical portal are divided into two types depending on their purpose:

1. Trend indicators show the starting point of trend and its end or reversal, trading on Forex without them is almost impossible. The most favorable time to work with these indicators is the when long price trends are observed on the market. These indicators include:

• MA10, MA20, MA50, MA100. MA indicator (the moving average) is presented on the portal for the most popular and informative periods - 10, 20, 50 or 100 days (MA10, MA20, MA50, MA100, respectively). Example: The 100-day moving average is very suitable for determining trend in the long term. And indeed, if the price has been going in one direction for 100 days, then it is not so easy to reverse the trend. MA are also the basis for many other technical indicators, such as Bollinger Bands and MACD.

• BBands - Bollinger Bands indicator reflects current changes in market volatility, confirms direction, warns about continuation or stopping of trend, consolidation periods, volatility for breakthroughs, and also points to local max. and min. The indicator shows the trading activity: in case of its increase, the bands expand and backwards, their narrowing indicates the price breakdown. Example: there are several methods working with BBands, for example, when approaching the upper level of resistance, it’s time to sell, and when you approach the lower level of support, to buy.

• ZigZag - can be very useful for traders using Eliot waves theory for analysis to establish the main waves and all sorts of corrective kickbacks. The main point of Zigzag's work is to filter out market noise (chaotic price movements). Example: if a trader finds that price movements are less than 5% are insignificant, then Zigzag ignores all price fluctuations less than 5%. However, Zigzag does not make predictions, and only indicates significant price changes in the past. But when used with other analytical tools (for example, Bollinger Bands), it can exactly confirm the signals to the input or output.

ind1.jpg


2. Oscillators help to identify overbought and oversold conditions on the Forex market. Overbought market is considered when the price is near its upper limit, and its further increase is unlikely. The oversold zone is characterized by such a low price that its further decline is unlikely at the moment. As a rule, traders buy currency during the period of oversold market, and sell during the overbought period. Although the analysis and use of oscillators performs best in a stationary market, they also determine the time of trend revers.

• MACD - gives you an opportunity to enter the trade at the beginning of the trend and exit before it ends. In the settings you will see 3 parameters: 1 and 2 parameters - the periods for calculating the fast and slow moving average, and also the histogram - the number of bars for calculating the difference between the moving averages. Example: crossing of moving averages, i.e. absence of a difference between them, serves as a signal for the beginning of a new trend.

• Ichimoku - Ichimoku indicator consists of 5 lines: Tenkan-sen, Kijun-sen, Senkou Span A, Senkou Span B, Chinkou Span. The distance between the lines of Senkou is hatched on the chart and is called the Ishimoku cloud. If the price is between these lines, the market is considered non-trendy and the edges of the cloud form then the support and the resistance levels. Example: if the Chinkou Span line crosses the price chart from bottom to top, this is a signal to buy, and backwards.

• Stochastic - Stochastic oscillator consists of two lines: fast and slow. The second one is the most significant, because by its dynamics traders can judge on the most important changes in the market. Stochastic has a rating scale from 0 to 100, allowing you to set the percentage place of the last closing price in the total price range for a certain period of time. Example: if the rate is higher than 80, then the closing price is near the upper limit of the range (overbought market), if below 20, then close to the bottom (oversold).

• William`s – William’s Percent Range, a simple but effective indicator, similar to Stochastic. Example: the values of the indicator in the range from -80% to -100% indicate a state of oversold, and in the range from -0% to -20% indicate that the market is overbought. The indicator William’s Percent Range has a curious ability to anticipate price reversals. It almost always forms a peak and turns down for a certain period of time before the price reaches a peak and turns down. Similarly, William’s Percent Range usually forms a depression and turns up in advance.

ind2.jpg


A useful addition to technical indicators is the indicator "Forex Marker Review", which allows you to determine which positions prevail in the market - to buy or sell.

You can find out more about popular indicators in the section of educational video courses on the NPBFX analytical portal.

Register and receive free and unlimited access to the trading signals, indicators and other useful instruments on the NPBFX online portal to improve the efficiency of your trading.
 
USD/CAD: wave analysis on 20/07/2017

Good afternoon, dear forum visitors!

NPBFX offers the latest release of analytics on the USD/CAD for a better understanding of the current market situation and more efficient trading.

Current trend

The trend is downward.

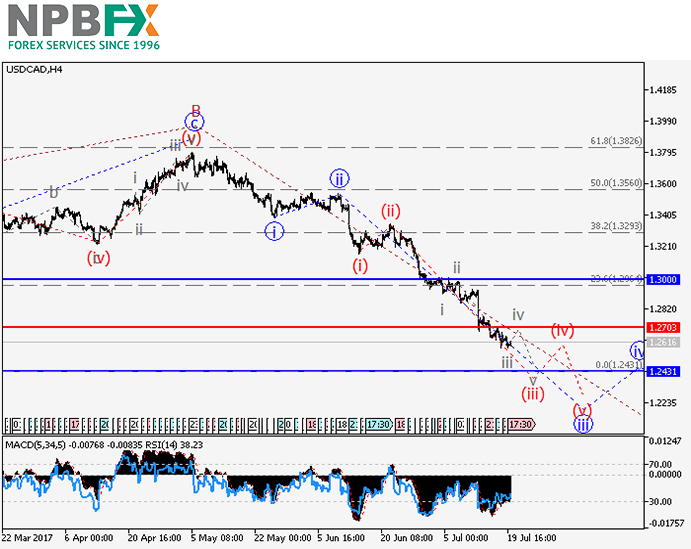
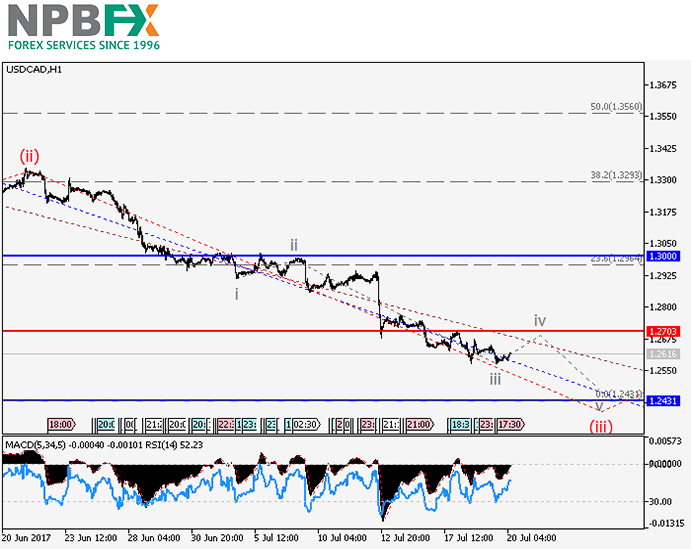
On the 4-hour chart the downward momentum within the wave C of the higher level is developing. Locally the third wave of the lower level (iii) of iii of C is developing. If the assumption is correct, the pair will fall to the level of 1.2430. The level of 1.2703 is critical for this scenario.

91.jpg


90.jpg


Main scenario

Short positions can be opened during the correction, below the level of 1.2703 with the target at 1.2430.

Alternative scenario

The breakout and the consolidation of the price above the level of 1.2703 will let the pair grow to the level of 1.3000.

Use more opportunities of the NPBFX analytical portal: economic calendar

Be ready for any market changes through global events using the economic calendar on the NPBFX portal. The calendar contains all the most important events of the world economy and prognoses for them. In order to get free and unlimited access to the economic calendar and other useful instruments on the portal, you need to pass a one-time registration on the NPBFX website.

If you have any questions about trading instruments, you can always ask an analyst in the online chat on the portal and get a free consultation of an experienced specialist.

Use the current recommendations of analysts on USD/CAD and trade efficiently with NPBFX.
 
AUD/USD: wave analysis on 21/07/2017

Good afternoon, dear forum visitors!

NPBFX offers the latest release of analytics on the AUD/USD for a better understanding of the current market situation and more efficient trading.

Current trend

The pair is in correction. The trend is upward.

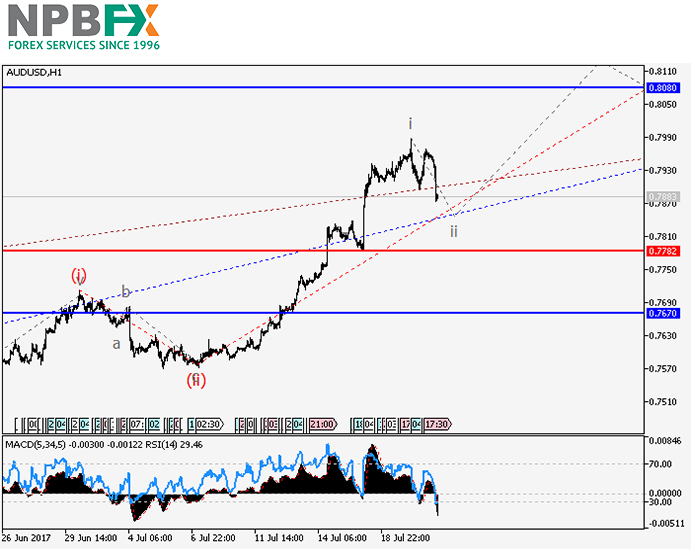
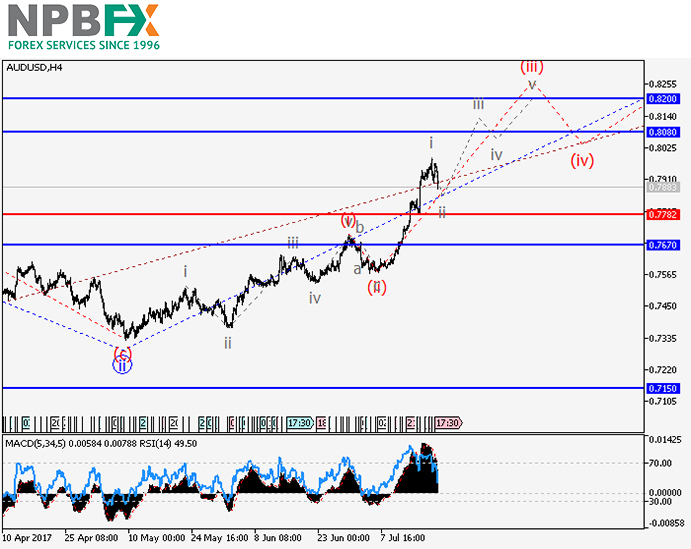
The upward momentum as a third wave of the higher level iii is forming. Locally the third wave of the lower level (iii) is developing, within it the wave i of (iii) of the lower level has formed, and the correction ii of (iii) is ending. If the assumption is correct, the pair will grow to the levels of 0.8080–0.8200. The level of 0.7782 is critical for this scenario.

77-1.jpg


88-1.jpg


Main scenario

Long positions can be opened during the correction, above the level of 0.7782 with the targets at 0.8080, 0.8200.

Alternative scenario

The breakdown and the consolidation of the price below the level of 0.7782 will let the pair go down to the level of 0.7670.

Use more opportunities of the NPBFX analytical portal: аnalytics

You can find more actual analytical reviews on other popular currency pairs, metals and CFDs on the NPBFX online portal. Daily analytics with charts, current market prognoses and trading scenarios in the Feed section are available. Get free and unlimited access to the online portal after registering on the official website of NPBFX Company.

If you have any questions about trading instruments, you can always ask an analyst in the online chat on the portal and get a free consultation of an experienced specialist.

Use the current recommendations of analysts on AUD/USD and trade efficiently with NPBFX.
 
Special Swap Free account in NPBFX - trade without swaps and commissions

Good afternoon, dear forum visitors!

swap-free-en.png


Today, trading on the Forex is widely available for almost every trader in the world, but some categories of traders can’t take all of its possibilities fully because of religious beliefs. These restrictions concern, for example, the transfer of open positions on another day with swap points paying. NPBFX offers Swap Free accounts in order to make trading convenient and available for traders whose religion prohibits such transactions.

What is a real Swap Free in NPBFX: 0% of commissions and swaps

Swap Free account is a service that provides access to a trading account on conditions of absence of swap operations while transferring open trading positions to the next business day. Usually trading accounts without swap points are provided on special terms, when a separate commission is charged for transferring an open position for the next day, which can be in % or a fixed amount. I.e. swap points are still paid under other conditions.

NPBFX Company completely frees its clients with Swap Free accounts from additional levies and provides a real Swap Free account with transparent terms. Clients can transfer positions with 0% commissions and swap points, that allows traders to trade without violating their religious beliefs.

What trading instruments are available for trading on Swap Free terms?

32 trading instruments on the terms of Swap Free are available for trading in NPBFX:

• currency pairs AUDNZD, CADCHF, CADJPY, CHFJPY, EURCAD, EURCHF, EURGBP, EURJPY, EURUSD, GBPAUD, GBPCAD, GBPCHF, GBPJPY, GBPUSD, NZDCAD, USDCAD, USDCHF, USDJPY, AUDCAD, AUDCHF, AUDJPY, AUDUSD, EURAUD, EURNZD, GBPNZD, NZDCHF, NZDJPY, NZDUSD;
• metals XAGUSD, XAUUSD;
• oil and natural gas XTIUSD, XNGUSD.

How to connect a Swap Free service account?

1. Open a trading account in the Personal cabinet.
2. Send a request of connection to Swap free in NPBFX and receive a confirmation of it.
3. Make a deposit to a trading account and start profitable trading.

Apply for registration a Swap Free account and start earning on Forex without any restrictions with NPBFX.
 
USD/CAD: wave analysis on 25/07/2017

Good afternoon, dear forum visitors!

NPBFX offers the latest release of analytics on the USD/CAD for a better understanding of the current market situation and more efficient trading.

Current trend

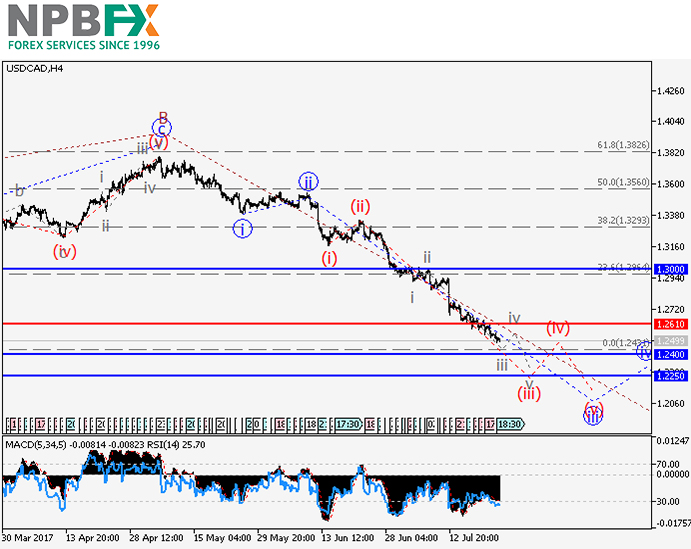
The pair can lower.
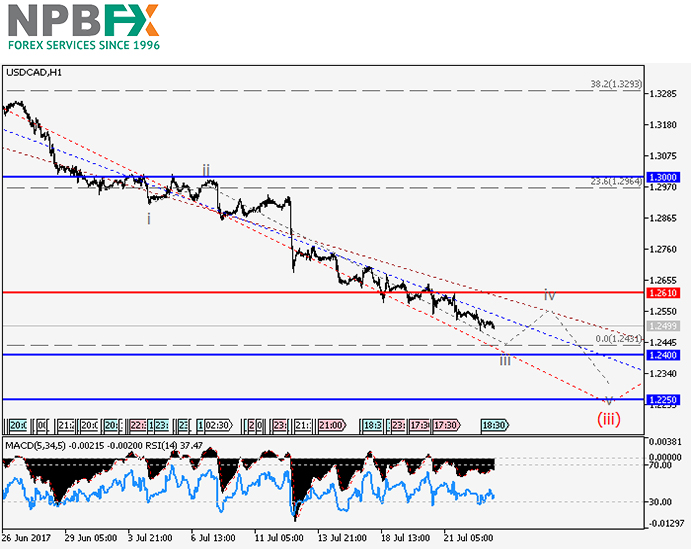
On the 4-hour chart the downward momentum within the wave C of the higher level is developing. Locally the third wave of the lower level (iii) of iii of C, within which the lengthening of the wave structure is developing, is forming. If the assumption is correct, the pair will fall to the levels of 1.2400–1.2250. The level of 1.2610 is critical for this scenario.

4.jpg


3.jpg


Main scenario

Short positions can be opened during the correction, below the level of 1.2610 with the targets at 1.2400–1.2250.

Alternative scenario

The breakout and the consolidation of the price above the level of 1.2610 will let the pair grow to the level of 1.3000.

Use more opportunities of the NPBFX analytical portal: аnalytics

You can find more actual analytical reviews on other popular currency pairs, metals and CFDs on the NPBFX online portal. Daily analytics with charts, current market prognoses and trading scenarios in the Feed section are available. Get free and unlimited access to the online portal after registering on the official website of NPBFX Company.

If you have any questions about trading instruments, you can always ask an analyst in the online chat on the portal and get a free consultation of an experienced specialist.

Use the current recommendations of analysts on USD/CAD and trade efficiently with NPBFX.
 
EUR/USD: wave analysis on 27/07/2017

Good afternoon, dear forum visitors!

NPBFX offers the latest release of analytics on the EUR/USD for a better understanding of the current market situation and more efficient trading.

Current trend

The trend is upward.

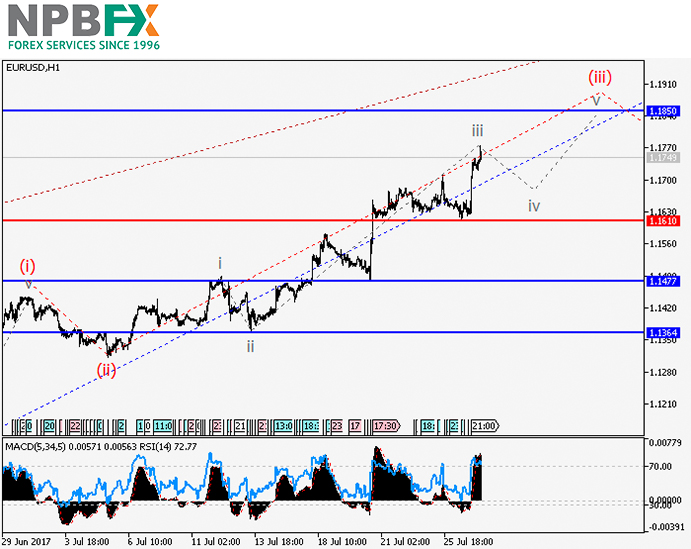
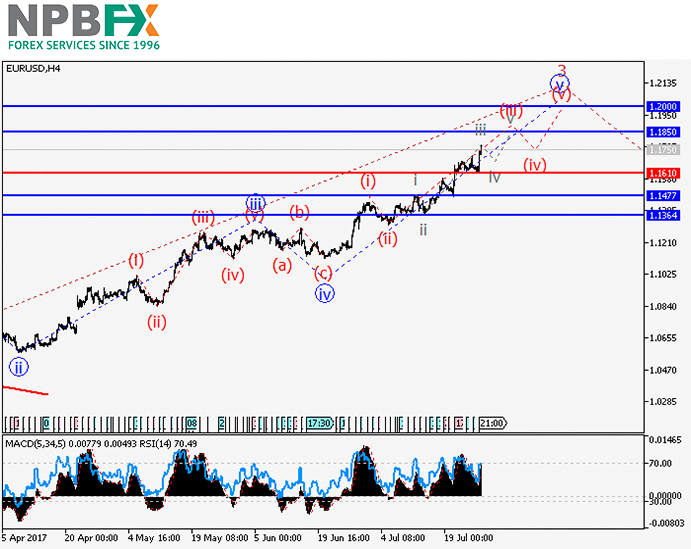
The upward trend is developing on the H4 chart as the third wave of the higher level 3. Currently a “bullish” impulse seems be forming as the third wave (iii) of v of 3 of the lower level. If the assumption is correct, the growth of the pair will continue to 1.1850. A critical level for this scenario is 1.1610.

3-2.jpg


4-1.jpg


Main scenario

Buy positions may be opened from corrections, above the level of 1.1610 with target at 1.1750.

Alternative scenario

The breakdown and the consolidation of the price below the level of 1.1610 will let the pair fall to the level of 1.1477.

Use more opportunities of the NPBFX analytical portal: E-book

If you just recently started to be interested in trading on FOREX and would like to deepen your knowledge, an electronic Beginner's Guide to FOREX Trading will be an excellent helper for you here. The book consists of 5 chapters and reflects fundamental concepts of the foreign exchange market to start successful trading. From the main chapters of the E-book you can learn about the concepts and history of FOREX, currencies and trend lines, technical indicators, types of orders, trading on news, psychology of trading, risk management and much more.

If you have any questions about trading instruments, you can always ask an analyst in the online chat on the portal and get a free consultation of an experienced specialist.

Use the current recommendations of analysts on EUR/USD and trade efficiently with NPBFX.
 
USD/CHF: wave analysis on 31/07/2017

Good afternoon, dear forum visitors!

NPBFX offers the latest release of analytics on the USD/CHF for a better understanding of the current market situation and more efficient trading.

Current trend

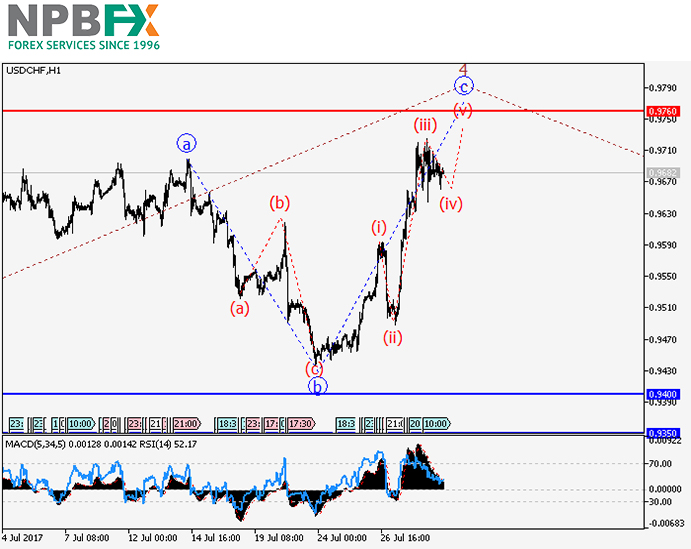
The pair is in correction.

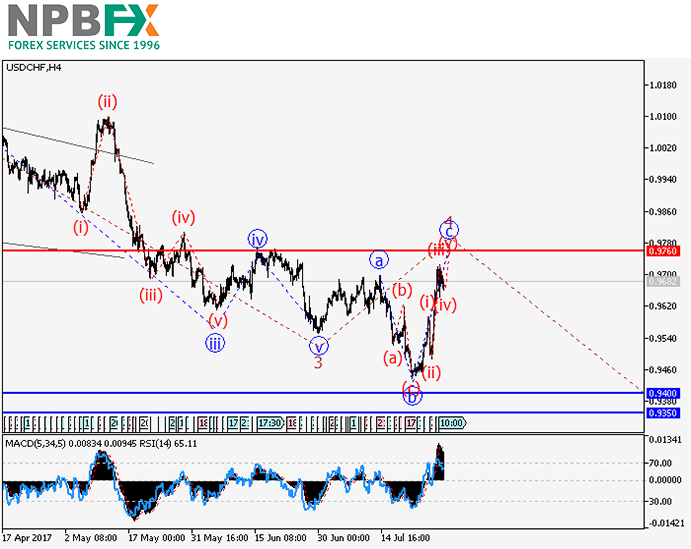
On the 4-hour chart the formation of the upward correction as a fourth wave 4 of the higher level, shaped as an irregular flat, is ending. Locally the development of the wave c of 4 is ending. If the assumption is correct, the pair will lower to the levels of 0.9400–0.9350 after the end of correction. The level of 0.9760 is critical for this scenario.

34.jpg


35.jpg


Main scenario

Short positions can be opened after the end of correction below the level of 0.9760 with the targets at 0.9400–0.9350.

Alternative scenario

The breakout and the consolidation of the price above the level of 0.9760 will let the pair grow to the levels of 0.9800–0.9850.

Use more opportunities of the NPBFX analytical portal: economic indicators

Regular monitoring of global economic indicators plays an important role in trading, because of their strong influence on FOREX market and possibility to provoke significant price fluctuations. For the convenience of traders the "Education" section on the NPBFX portal contains the most popular and significant world economic indices with a detailed description, their possible impact on the economy and exchange rates (GDP, consumer price index, unemployment rate, Nonfarm Payrolls (NFP), etc.).

If you have any questions about trading instruments, you can always ask an analyst in the online chat on the portal and get a free consultation of an experienced specialist.

Use the current recommendations of analysts on USD/CHF and trade efficiently with NPBFX.
 
EUR/GBP: Ichimoku clouds on 02/08/2017

Good afternoon, dear forum visitors!

NPBFX offers the latest release of analytics on the EUR/GBP for a better understanding of the current market situation and more efficient trading.

Current trend

42.jpg


43.jpg


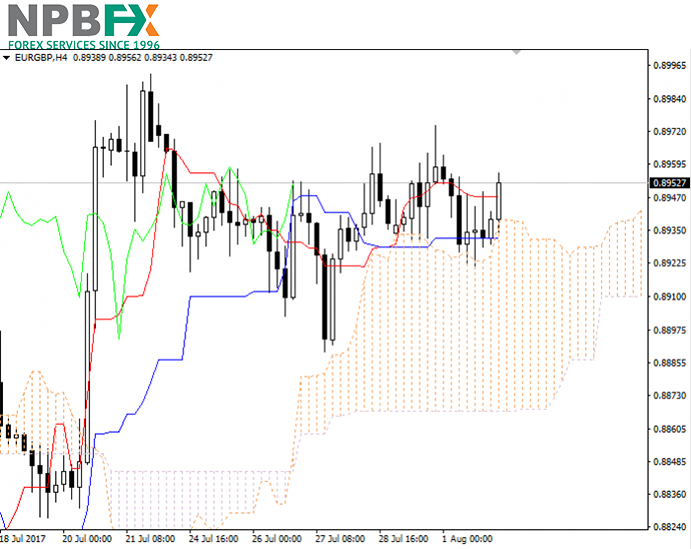
Let's look at the four-hour chart. Tenkan-sen line is above Kijun-sen, the lines are horizontal . Confirmative line Chikou Span is above the price chart, current cloud is ascending. The instrument is trading above Tenkan-sen and Kijun-sen lines; the Bullish trend is still strong. The closest support level is the upper border of the cloud (0.89336). One of the previous maximums of Chikou Span line is expected to be a resistance level (0.89739).

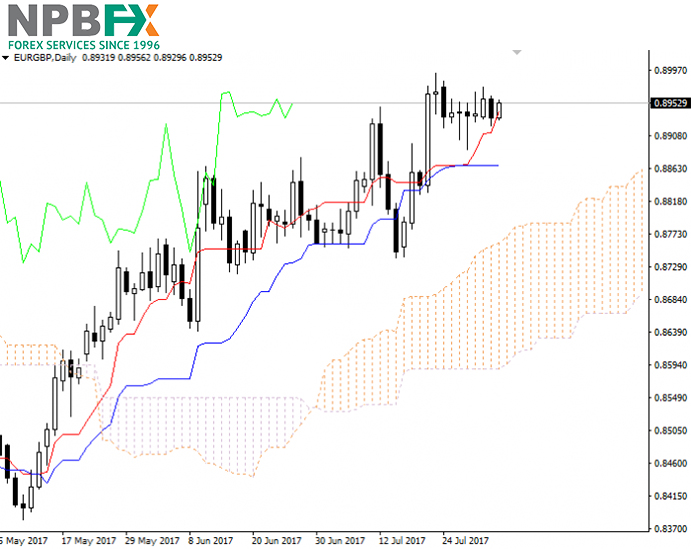
On the daily chart Tenkan-sen line is above Kijun-sen, the red line is directed upwards, while the blue one remains horizontal. Confirmative line Chikou Span is above the price chart, current cloud is ascending. The instrument is trading above Tenkan-sen and Kijun-sen lines; the Bullish trend is still strong. The closest support level is Tenkan-sen line (0.88625). One of the previous maximums of Chikou Span line is expected to be a resistance level (0.89980).

Recommendation

It is recommended to open long positions at current price with the target at the level of previous maximum of Chikou Span line (0.89739) and Stop Loss at the upper border of the cloud (0.89336).

Use more opportunities of the NPBFX analytical portal: analytics

You can find more actual analytical reviews on other popular currency pairs, metals and CFDs on the NPBFX online portal. Daily analytics with charts, current market prognoses and trading scenarios in the Feed section are available. Get free and unlimited access to the online portal after registering on the official website of NPBFX Company.

If you have any questions about trading instruments, you can always ask an analyst in the online chat on the portal and get a free consultation of an experienced specialist.

Use the current recommendations of analysts on EUR/GBP and trade efficiently with NPBFX.
 
Last edited:
AUD/USD: general analysis on 07/08/2017

Good afternoon, dear forum visitors!

NPBFX offers the latest release of analytics on the AUD/USD for a better understanding of the current market situation and more efficient trading.

Current trend

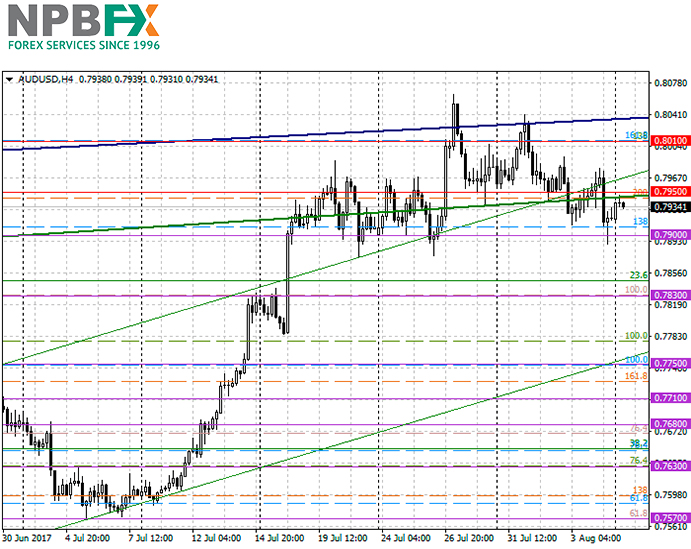
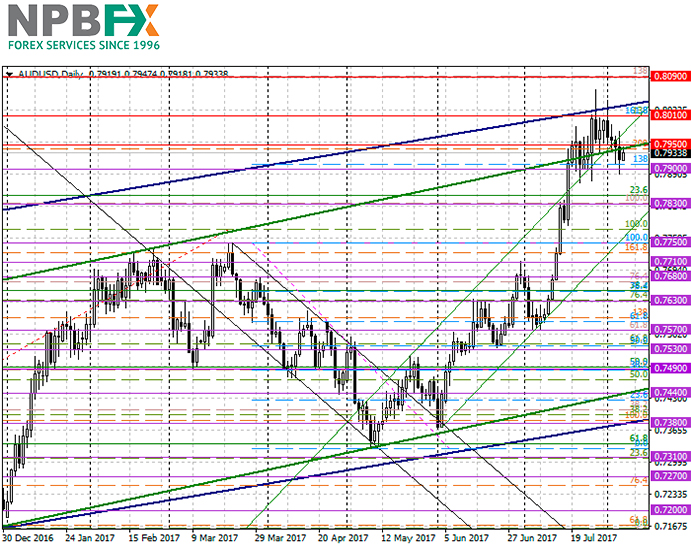
Last week, the "double top" pattern appeared on the AUD/USD chart. This formation shows the strength of the resistance zone, in this case 0.8010-0.8050. This zone is further strengthened by the upper boundary of the two-year channel (blue on D1). As a result, the whole last week the pair spent in correction, weakening to the US dollar.

This week, in Australia, the consumer sentiment index, housing credit data and inflation data will be published. But today market is waiting for the US events: stats on the labor market conditions index, at 16:00 GMT+2, the speech of Fed representative Neil Kashkari, at 19:25 GMT+2, and, at 21:00 GMT+2, the change in the volume of consumer credit.

The main scenario for the next two days is continuation of the consolidation of the pair.

Support and resistance

Support levels: 0.7900, 0.7830, 0.7750.

Resistance levels: 0.7950, 0.8010, 0.8090, 0.8160.

5.jpg


6.jpg


Trading tips

Short positions can be opened at the market price, the targets are 0.7900, 0.7830, the stop-loss is 0.8000.

Long positions will become relevant at the level of 0.7950, the targets – 0.8010, 08090, stop-loss – 0.7930.

Use more opportunities of the NPBFX analytical portal: economic calendar

Be ready for any market changes through global events using the economic calendar on the NPBFX portal. The calendar contains all the most important events of the world economy and prognoses for them. In order to get free and unlimited access to the economic calendar and other useful instruments on the portal, you need to pass a one-time registration on the NPBFX website.

If you have any questions about trading instruments, you can always ask an analyst in the online chat on the portal and get a free consultation of an experienced specialist.

Use the current recommendations of analysts on AUD/USD and trade efficiently with NPBFX.
 

Latest Posts

Live Forex Chart

Currency
Rates
EUR / USD
1.13806
USD / JPY
158.893
GBP / USD
1.32196
USD / CHF
0.82796
USD / CAD
1.41372
EUR / JPY
180.791
AUD / USD
0.70125
Back
Top
Log in Register