BTC USD 84,095.2 Gold USD 4,285.46
Time now: Jun 1, 12:00 AM

NPBFX - npbfx.com

EUR/USD: wave analysis on 16/06/2017

Good afternoon, dear forum visitors!

NPBFX offers the latest release of analytics on the EUR/USD for a better understanding of the current market situation and more efficient trading.

Current trend

The pair can lower.

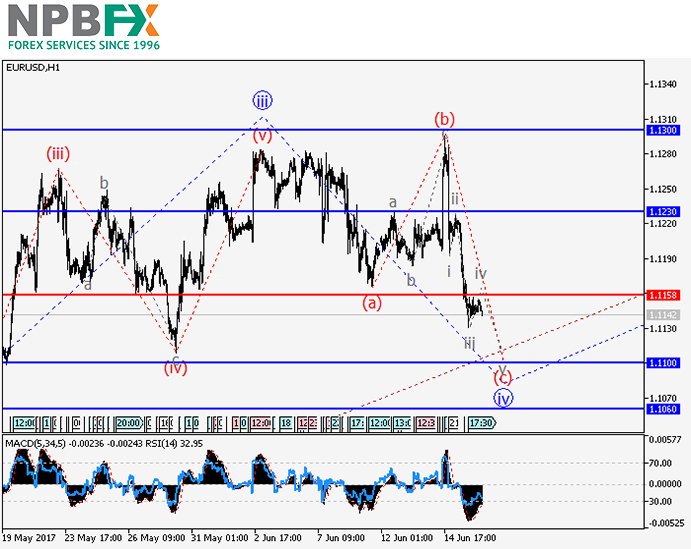
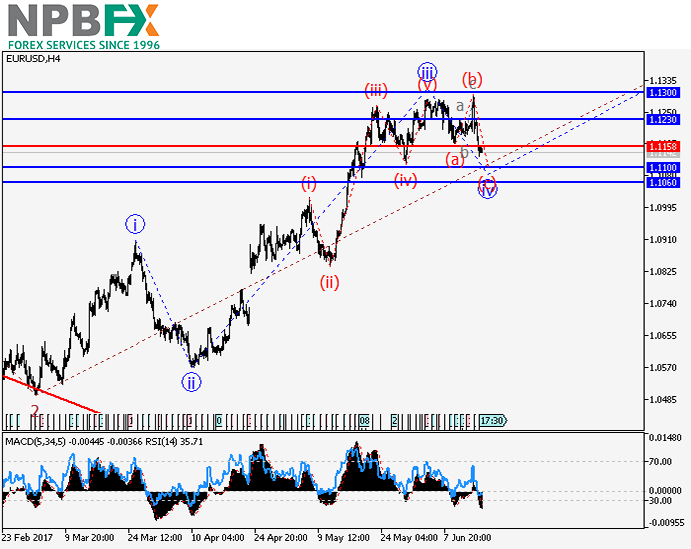
On the 4-hour chart the third wave of the highest level 3 is developing. At the moment the downward correction as a wave iv of 3, within which the downward momentum as a wave (c) is forming, is developing. If the assumption is correct, the pair will lower to the level of 1.1100-1.1060. The level of 1.1158 is critical for this scenario.
7-1.jpg


6-2.jpg


Trading scenario

Sell the pair below the level of 1.1158 with the target at 1.1100-1.1060.

Alternative scenario

The breakout and the consolidation of the price above the level of 1.1158 will let the pair to grow to the level of 1.1230.

Use more opportunities of the NPBFX analytical portal: economic calendar

Be ready for any market changes through global events using the economic calendar on the NPBFX portal. The calendar contains all the most important events of the world economy and prognoses for them. In order to get free and unlimited access to the economic calendar and other useful instruments on the portal, you need to pass a one-time registration on the NPBFX website.

If you have any questions about trading instruments, you can always ask an analyst in the online chat on the portal and get a free consultation of an experienced specialist.

Use the current recommendations of analysts on EUR/USD and trade efficiently with NPBFX.
 
USD/JPY: general analysis on 19/06/2017

Good afternoon, dear forum visitors!

NPBFX offers the latest release of analytics on the USD/JPY for a better understanding of the current market situation and more efficient trading.

Current trend

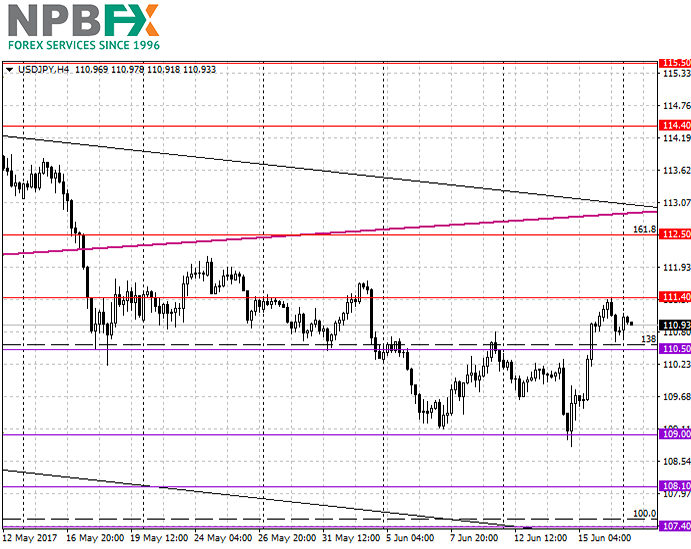
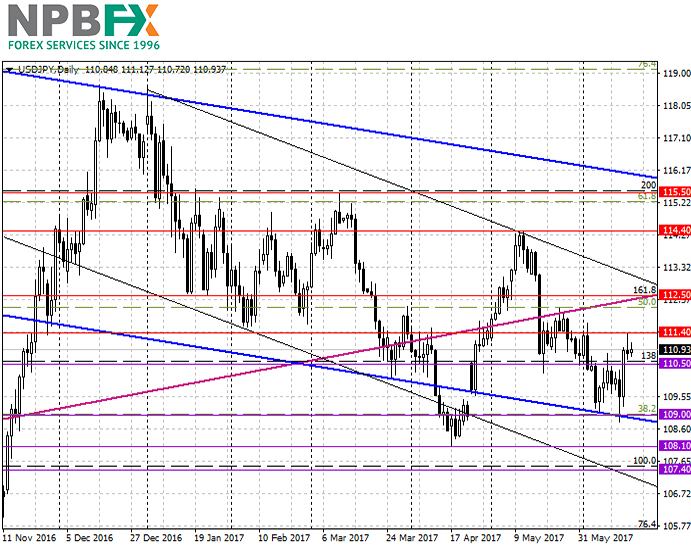
During the second week the USD/JPY pair is trading within the narrow range between the levels of 109.00 and 110.50. The support level 109.00 is additionally strengthened by the lower border of the blue channel on the D1. Last week the USA FRS interest rate decision and the following FOMC commentaries attracted the investors to the USD, so the USD/JPY pair reversed upwards from the 2 weeks flat.

In Friday the Bank of Japan decision to leave the interest rate on the minimal level confirmed the super mild BoJ policy, and the growth of the pair was expected, but despite all the positive got fro, the FRS the USD has suddenly fallen. The new week began with the downward gap, which confirms the investors’ uncertainty in the Yellen’s commentaries, which are diverging with the real economic situation in the USA. In addition the Japan Trade Balance data were published tonight, which was much lower than expected, which made the JPY fall faster than the weakening USD, and USD/JPY pair began this week with the strengthening.

The BoJ Monetary Policy Meeting Minutes will be published this week on Wednesday. The Fed's William Dudley speech is due at 14:00 (GMT+2) in the USA.

In the nearest two days the consolidation of the pair is expected.

Support and resistance

Support levels: 110.50, 109.00, 108.10, 107.40.

Resistance levels: 111.40, 112.50, 114.40.

5-1.jpg


6-3.jpg


Trading scenario

Open short positions at the current price with the target at 109.00 and 108.10, stop loss is at 111.60.

Buy the pair at the level of 111.40 with the target at 112.50 and 114.40, stop loss is at 110.60.

Use more opportunities of the NPBFX analytical portal: weekly FOREX forecast

You can learn more about the current situation on USD/JPY and get acquainted with the weekly analytical forecast in the "Video reviews" section on the NPBFX portal. Also weekly video reviews contain trends, key levels, trading recommendations for such popular instruments as EUR/USD, GBP/USD, AUD/USD, Gold. In order to get free and unlimited access to video forecast and other useful instruments on the portal, you need to register on the NPBFX website.

In order to get unlimited access to the Weekly FOREX forecast and other useful instruments on the portal, you need to register on the NPBFX website.

If you have any questions about trading instruments, you can always ask an analyst in the online chat on the portal and get a free consultation of an experienced specialist.

Use the current recommendations of analysts on USD/JPY and trade efficiently with NPBFX.
 
GBP/USD: general review on 22/06/2017

Good afternoon, dear forum visitors!

NPBFX offers the latest release of analytics on the GBP/USD for a better understanding of the current market situation and more efficient trading.

Current trend

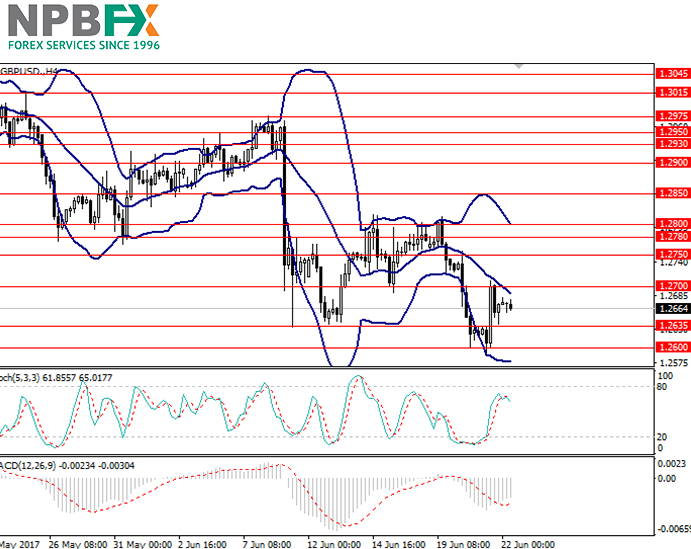
The pair GBP/USD continues to show instability in view of political events in the UK. Yesterday the pair dropped during early trading having tested the support level 1.2600. But after the promises of Prime Minister Theresa May to organize the Brexit procedure as mildly as possible, the price moved to 1.2700. Due to high volatility it is impossible to forecee futher movements of the price, and current marker instability may remain until the beginning of Brexit negotiations.

Today in the absence of important macroeconomic releases from the UK and the USA attention should be paid to technical indicators.

Support and resistance

On the H4 chart the pair is trading between the middle and lower lines of Bollinger Bands and is showing side movement. MACD histogram is in the negative zone with the sale signal weakening. Stochastic is in the neutral area showing side movement and does not give a clear signal for entering the market.

Support levels: 1.2635, 1.2600.

Resistance levels: 1.2700, 1.2750, 1.2780, 1.2800.

44444.jpg


Trading tips

Short positions may be opened from the current level with targets at 1.2600 and stop-loss at 1.2700.

Long positions may be opened from the level of 1.2720 with targets at 1.2780 and stop-loss at 1.2690.

The period of implementation is 1-2 days.

Use more opportunities of the NPBFX analytical portal: analytics

You can find more actual analytical reviews on other popular currency pairs, metals and CFDs on the NPBFX online portal. Daily analytics with charts, current market prognoses and trading scenarios in the Feed section are available. Get free and unlimited access to the online portal after registering on the official website of NPBFX Company.

If you have any questions about trading instruments, you can always ask an analyst in the online chat on the portal and get a free consultation of an experienced specialist.

Use the current recommendations of analysts on GBP/USD and trade efficiently with NPBFX.
 
Gold: Ichimoku clouds on 28/06/2017

Good afternoon, dear forum visitors!

NPBFX offers the latest release of analytics on the XAU/USD for a better understanding of the current market situation and more efficient trading.

Current trend

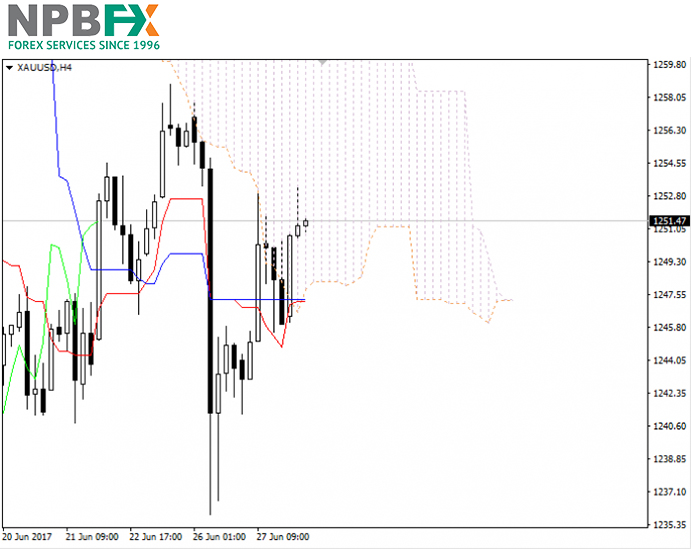
55-2.jpg


Let's look at the four-hour chart. Tenkan-sen line is below Kijun-sen, the lines are horizontal . Confirmative line Chikou Span is crossing the price chart from below, current cloud is going to reverse from descending to ascending. The instrument is trading above Tenkan-sen and Kijun-sen lines; the Bullish trend is still strong. The closest support level is the lower border of the cloud (1248.26). The closest resistance level is the lower border of the cloud (1260.81).

66-3.jpg


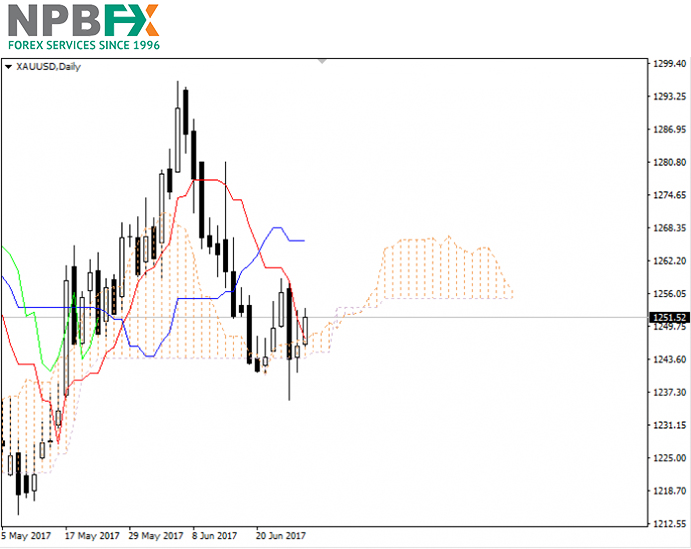
Let's look at the four-hour chart. Tenkan-sen line is below Kijun-sen, the lines are horizontal . Confirmative line Chikou Span is crossing the price chart from below, current cloud is going to reverse from descending to ascending. The instrument is trading above Tenkan-sen and Kijun-sen lines; the Bullish trend is still strong. The closest support level is the lower border of the cloud (1248.26). The closest resistance level is the lower border of the cloud (1260.81).On the daily chart Tenkan-sen line is below Kijun-sen, the red line is directed downwards, while the blue one remains horizontal. Confirmative line Chikou Span is crossing the price chart from below, current cloud is ascending. The instrument is trading between Tenkan-sen and Kijun-sen lines. The closest support level is the upper border of the cloud (1247.32). The closest resistance level is Kijun-sen line (1265.92).

Recommendation

It is recommended to open long positions at current price with the target at the level of previous maximum of Chikou Span line (1256.24) and Stop Loss at the upper border of the cloud (1248.52).

Use more opportunities of the NPBFX analytical portal: analytics

You can find more actual analytical reviews on other popular currency pairs, metals and CFDs on the NPBFX online portal. Daily analytics with charts, current market prognoses and trading scenarios in the Feed section are available. Get free and unlimited access to the online portal after registering on the official website of NPBFX Company.

If you have any questions about trading instruments, you can always ask an analyst in the online chat on the portal and get a free consultation of an experienced specialist.

Use the current recommendations of analysts on XAU/USD and trade efficiently with NPBFX.
 
AUD/JPY: Ichimoku clouds on 29/06/2017

Good afternoon, dear forum visitors!

NPBFX offers the latest release of analytics on the AUD/JPY for a better understanding of the current market situation and more efficient trading.

Current trend

77-1.jpg


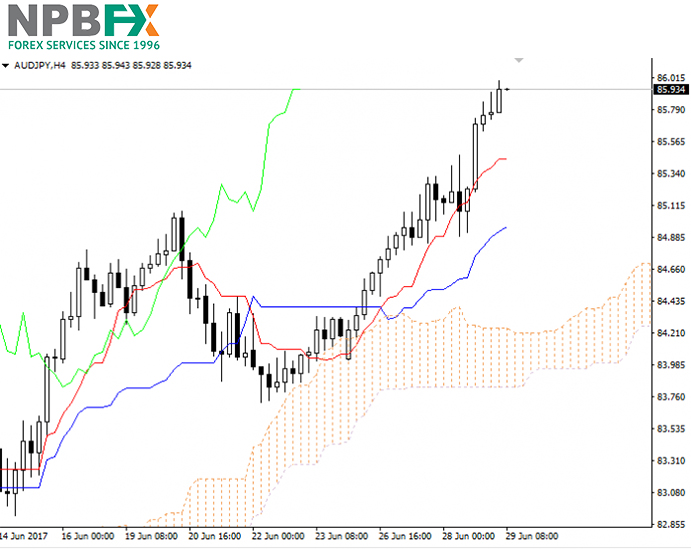
Let's look at the four-hour chart. Tenkan-sen line is above Kijun-sen, the blue line is directed upwards, while the red one remains horizontal. Confirmative line Chikou Span is above the price chart, current cloud is ascending. The instrument is trading above Tenkan-sen and Kijun-sen lines; the Bullish trend is still strong. The closest support level is Tenkan-sen line (85.449). One of the previous maximums of Chikou Span line is expected to be a resistance level (86.553).

88-1.jpg


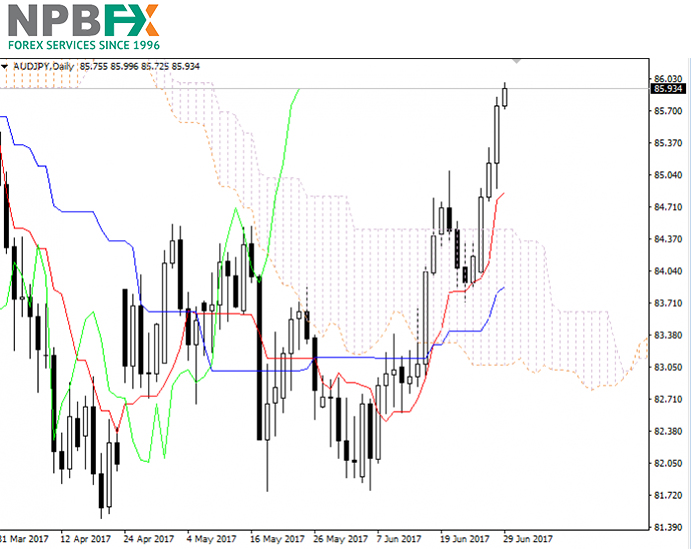
On the daily chart Tenkan-sen line is above Kijun-sen, both lines are directed upwards. Confirmative line Chikou Span is above the price chart, current cloud is ascending. The instrument is trading above Tenkan-sen and Kijun-sen lines; the Bullish trend is still strong. The closest support level is Tenkan-sen line (84.852). One of the previous maximums of Chikou Span line is expected to be a resistance level (86.720).
Recommendation

It is recommended to open long positions at current price with Take Profit at the level of previous maximum of Chikou Span (86.553) line and Stop Loss at the level of Kijun-sen line (85.065).

Use more opportunities of the NPBFX analytical portal: economic calendar

Be ready for any market changes through global events using the economic calendar on the NPBFX portal. The calendar contains all the most important events of the world economy and prognoses for them. In order to get free and unlimited access to the economic calendar and other useful instruments on the portal, you need to pass a one-time registration on the NPBFX website.

If you have any questions about trading instruments, you can always ask an analyst in the online chat on the portal and get a free consultation of an experienced specialist.

Use the current recommendations of analysts on AUD/JPY and trade efficiently with NPBFX.
 
Changes in trading schedule on July 4, 2017 (Independence Day in the US)

Good afternoon, dear forum visitors!

The NPBFX Company would like to inform you about the changes in trading hours during the Independence Day in the US on July 4, 2017:

FOREX (currency): without changes;
XAUUSD, XAGUSD (gold and silver): a break in trading 17: 00-22: 00 GMT;
XBRUSD, XTIUSD, XNGUSD (Brent crude, WTI, natural gas): a break in trading 16: 45-22: 00 GMT.

Please, consider this information when making trading decisions.
 
Where to invest profitably: choosing between RoboX and ZuluTrade

Good afternoon, dear forum visitors!

43logo1.jpg


Not so long ago the NPBFX Company has opened an opportunity for its clients to connect to the two innovative platforms for trading - RoboX and ZuluTrade. The new services have aroused a great interest. Today we offer a comparison of the two services by key parameters especially for those who have not made a choice yet. You will know what are the main differences and similarities between the RoboX and ZuluTrade, which of the services is optimal for different investment purposes.

What do the RoboX and ZuluTrade offer?

The RoboX service allows to manage investor’s money in automatic mode and make profit without additional efforts. You set preferential trading risks, and the system automatically selects strategies, forming a balanced investment portfolio.

22.jpg


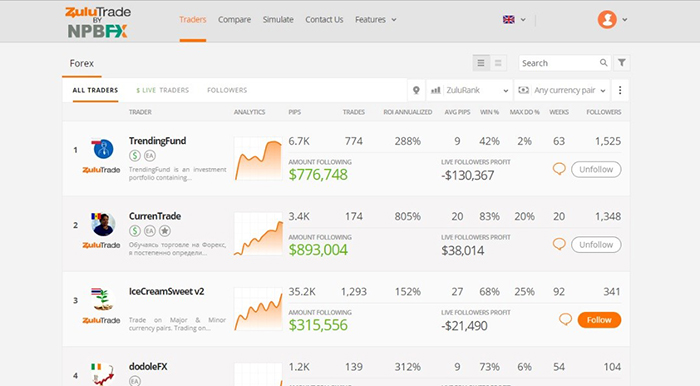
The ZuluTrade platform provides an opportunity to choose a real trader by yourself according to a clever efficiency algorithm, the successful deals of whom you want to copy on your own trading account.

331.jpg


Comparison of RoboX and ZuluTrade services

Both services offer traders to make profitable investments with no need for self trading. This way of making profit may be interesting to investors who want to achieve maximum profitability and efficiency of investments, while minimizing the time spent on education and personal participation in trading.

The main functional differences between the two platforms are that RoboX: a) completely excludes the human factor from trade by trading in an automatic mode, B) doesn’t provide an opportunity to make changes in trading process.

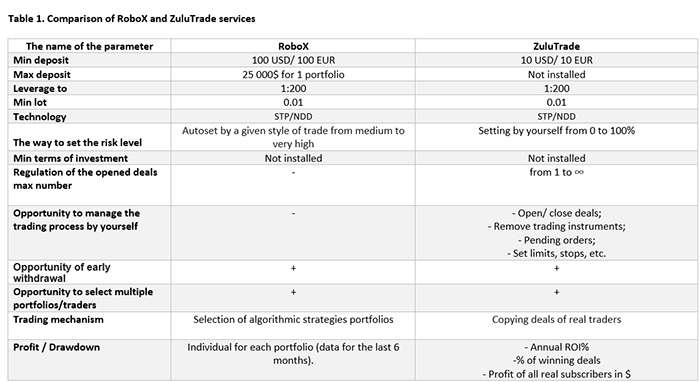
On the contrary, investors in ZuluTrade a) choose real traders to copy their deals by rating and B) can manage own trading account, making the necessary adjustments if desired. More differences between the services can be found in the table below:

44.jpg


Before investing, NPBFX recommend to answer the questions of the investor's checklist. The answers will help to make an optimal choice of service for profitable investment that is an appropriate right for you.

Investor's checklist

1. What is your experience of trading on Forex / investment?
2. Are you ready to spend time on daily control of your investments?
3. Do you want to have an opportunity of trading the invested funds by yourself if necessary?
4. What kinds of investment services are you already familiar with (PAMMs, etc.)?
5. What was your past investment result? Analyze your successes and failures to avoid mistakes in the future.
6. Indicate the available amount of investment.
7. Evaluate the risks to suit your trading style (for example, moderate or aggressive), the level of allowable drawdown.
8. Consider the desired investment terms.
9. Define the desired objectives for the nearest future and long-term ones - for example, minimizing losses or maximizing profits.
10. Are you more likely to trust reliable automated trading systems or professional traders in managing your capital?

Now on the base of your individual parameters and the opportunities of both services (in Table 1), you can choose an appropriate investment service.

How to become a RoboX investor?

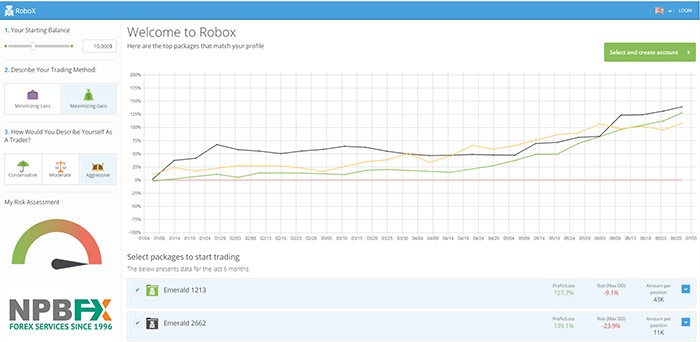
To start investing in RoboX, you need to define goals and set just three parameters: 1) starting balance (from $ 500 to $ 25,000), 2) trading method (minimizing loss or maximizing gain) and 3) trading style (conservative, moderate, aggressive). Then the system will automatically select for you several investment portfolios based on set parameters with risk, profit/loss, drawdown in %.

How to become a ZuluTrade investor?

In order to start copying deals to your account in ZuluTrade, after registration you need to select appropriate traders using the rating. While choosing, you can set profitability parameters for the period of interest and traded pairs. The next step is to subscribe to traders whose deals will be automatically synchronized with your account. Also, the platform offers the investor a wide range of options for customizing and managing the trading account (set the lot volume, number of opened orders, limits, stops, traded pairs, etc.).

The efficiency of RoboX and ZuluTrade investments

Many investors have already managed to assess the profitability of trading using these platforms RoboX and ZuluTrade. For example, one of the most successful portfolios in RoboX Emerald 1213 provides a yield up to 151% with a drawdown of 30.3%, and ROI for TOP-1 traders in ZuluRank - TrendingFund is 292% with a drawdown of 2%. Efficiency in both services can be equally high and depends, first of all, on the start settings – the level of risk, the amount of investment, the choice of a trader for copying deals, etc.

You can start profitable investment in both RoboX and ZuluTrade services already today after registering the Personal Account on the NPBFX website.
 
Last edited:
EUR/GBP: Ichimoku clouds on 05/07/2017

Good afternoon, dear forum visitors!

NPBFX offers the latest release of analytics on the EUR/GBP for a better understanding of the current market situation and more efficient trading.

Current trend

9.jpg


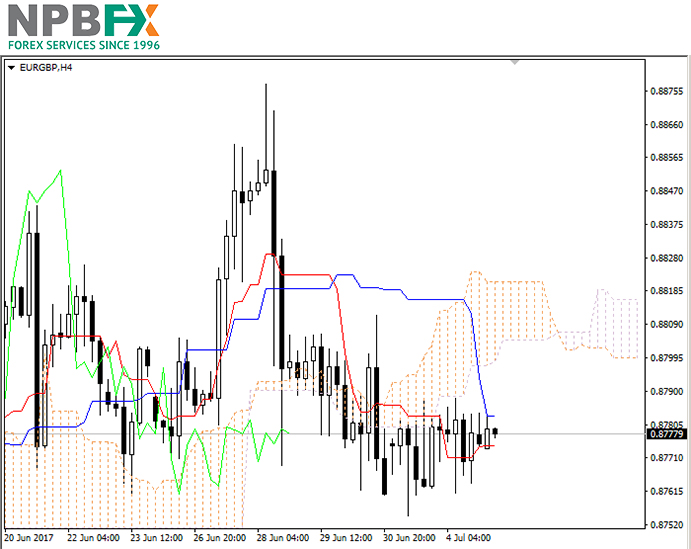
Let's look at the four-hour chart. Tenkan-sen line is below Kijun-sen, the lines are horizontal . Confirmative line Chikou Span is below the price chart, current cloud is descending. The instrument is trading between Tenkan-sen and Kijun-sen lines. Tenkan-sen and Kijun-sen lines have become support (0.8774) and resistance (0.8782) levels respectively.

99.jpg


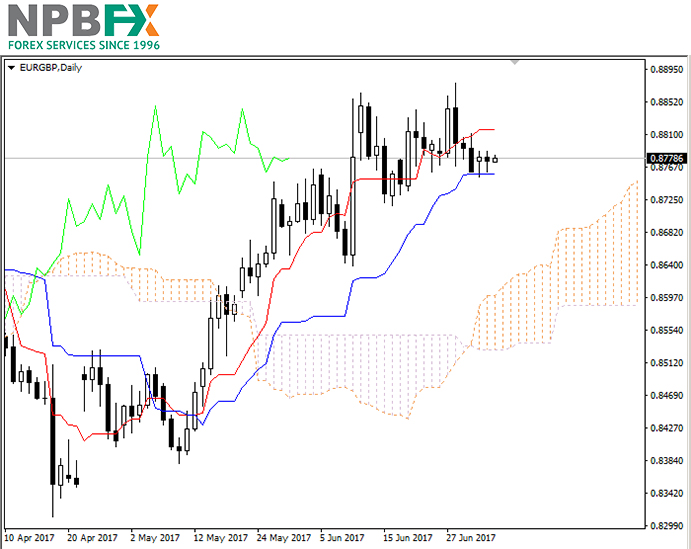
On the daily chart Tenkan-sen line is above Kijun-sen, the lines are horizontal . Confirmative line Chikou Span is above the price chart, current cloud is ascending. The instrument is trading between Tenkan-sen and Kijun-sen lines. The closest support level is Kijun-sen line (0.8757). The closest resistance level is the lower border of the cloud (0.8787).

Recommendation

On the four-hour chart we can see a correction of the downward movement. On the daily chart the instrument is trading within the cloud. It is recommended to open long positions at current price with Take Profit at the level of previous maximum of Chikou Span (0.8825) line and Stop Loss at the level of Kijun-sen line (0.8757).

Use more opportunities of the NPBFX analytical portal: glossary

Beginning traders certainly face a lot of specialized concepts and lexicon on FOREX, which are often not fully been understood. Swap, tick, hedge, margin calls are often unfamiliar to beginning traders. But the lack of knowledge of these fundamentals make a competent market vision impossible. So glossary on the NPBFX analytical portal could be an excellent helper in this case, which contains all the main definitions with explanations in a compact and accessible form. All concepts are arranged in alphabetical order, so that you can easily and quickly find and explore a new concept for yourself.

If you have any questions about trading instruments, you can always ask an analyst in the online chat on the portal and get a free consultation of an experienced specialist.

Use the current recommendations of analysts on EUR/GBP and trade efficiently with NPBFX.
 
AUD/JPY: Ichimoku clouds on 06/07/2017

Good afternoon, dear forum visitors!

NPBFX offers the latest release of analytics on the AUD/JPY for a better understanding of the current market situation and more efficient trading.

Current trend

999.jpg


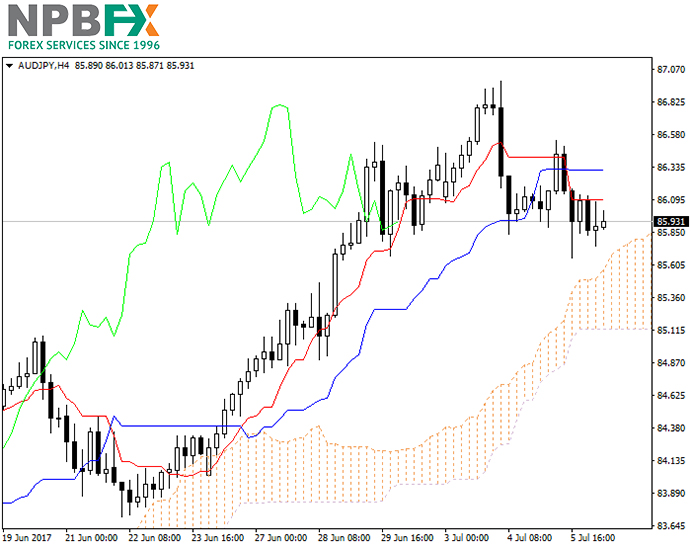
Let's look at the four-hour chart. Tenkan-sen line is below Kijun-sen, the lines are horizontal. Confirmative line Chikou Span is crossing the price chart from above, current cloud is ascending. The instrument has broken down Tenkan-sen and Kijun-sen lines. The closest support level is the lower border of the cloud (85.700). The closest resistance level is Tenkan-sen line (86.100).

888.jpg


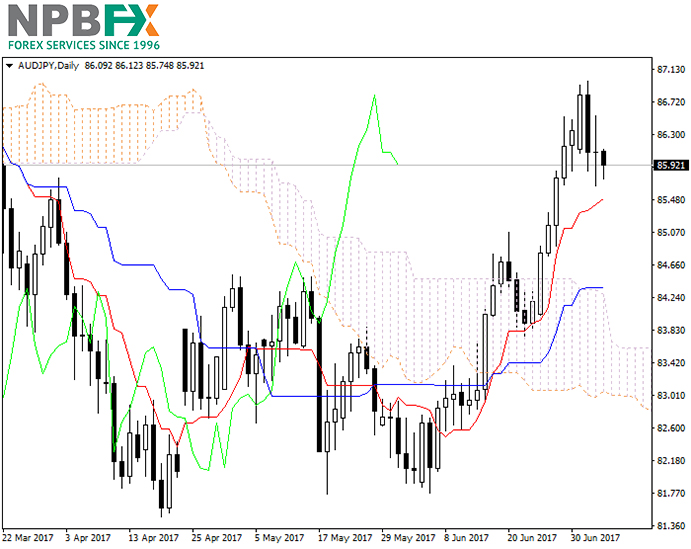
On the daily chart Tenkan-sen line is above Kijun-sen, the red line is directed upwards, while the blue one remains horizontal. Confirmative line Chikou Span is above the price chart, current cloud is ascending. The instrument is trading above Tenkan-sen and Kijun-sen lines; the Bullish trend is still strong. The closest support level is Tenkan-sen line (85.500). One of the previous maximums of Chikou Span line is expected to be a resistance level (86.800).

Recommendation

On the four-hour chart we've got a signal of trend reversal from ascending to descending. On the daily chart the Bullish trend is still strong. It is recommended to open long positions at current price with Take Profit at the level of previous maximum of Chikou Span (86.800) line and Stop Loss at the level of Kijun-sen line (85.500).

Use more opportunities of the NPBFX analytical portal: trading signals

Make right trade decisions on sell or buy AUD/JPY and other popular instruments using trading signals on the NPBFX portal. All registered users have free access to signals from the top 10 trading indicators (MA10, BBands, Ichimoku, Stochastic, ZigZag, etc.) with also general recommendations on the portal.
If you have any questions about trading instruments, you can always ask an analyst in the online chat on the portal and get a free consultation of an experienced specialist.

Use the current recommendations of analysts on AUD/JPY and trade efficiently with NPBFX.
 
AUD/USD: wave analysis on 10/07/2017

Good afternoon, dear forum visitors!

NPBFX offers the latest release of analytics on the AUD/USD for a better understanding of the current market situation and more efficient trading.

Current trend

The correction continues.

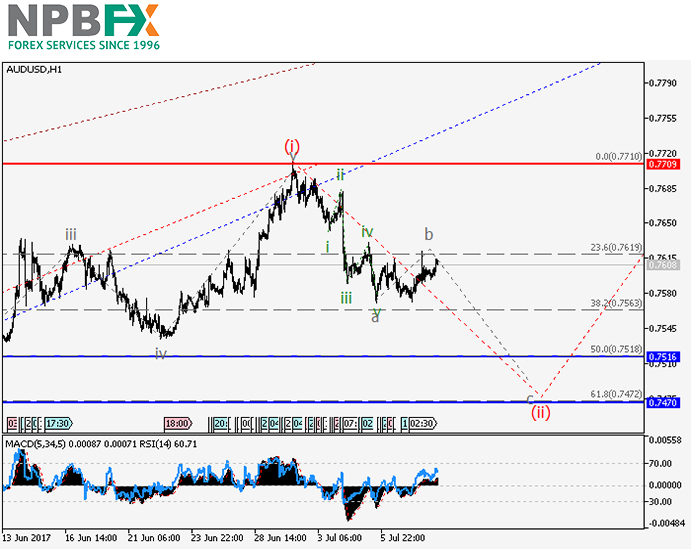
The downward correction as a second wave (ii) within the third wave of the higher level iii is forming. Locally the zigzag is developing, and within it the formation of the wave c of (ii) and the lowering of the pair to the levels of 0.7516–0.7470 is expected. The level of 0.7709 is critical for this scenario.

7.jpg


7.jpg


Trading tips

Short positions can be opened during the correction, below the level of 0.7709 with the target at 0.7516–0.7470.

Alternative scenario

The breakout and the consolidation of the price above the level of 0.7709 will let the pair grow to the level of 0.7850 and higher.

Use more opportunities of the NPBFX analytical portal: economic indicators

Regular monitoring of global economic indicators plays an important role in trading, because of their strong influence on FOREX market and possibility to provoke significant price fluctuations. For the convenience of traders the "Education" section on the NPBFX portal contains the most popular and significant world economic indices with a detailed description, their possible impact on the economy and exchange rates (GDP, consumer price index, unemployment rate, Nonfarm Payrolls (NFP), etc.).

If you have any questions about trading instruments, you can always ask an analyst in the online chat on the portal and get a free consultation of an experienced specialist.

Use the current recommendations of analysts on AUD/USD and trade efficiently with NPBFX.
 

Latest Posts

Live Forex Chart

Currency
Rates
EUR / USD
1.13910
USD / JPY
157.285
GBP / USD
1.32505
USD / CHF
0.82827
USD / CAD
1.41455
EUR / JPY
179.163
AUD / USD
0.70328
Back
Top
Log in Register