BTC USD 76,429.8 Gold USD 4,306.28
Time now: Jun 1, 12:00 AM

My trading journal using technical analysis

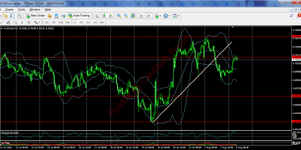
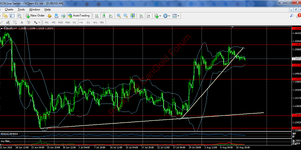
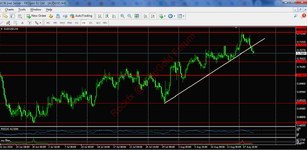
The AUDUSD pair's upward movement has approached the resistance level of 0.7019. The local uptrend line on H1 was previously broken downwards. If the pair rebounds downwards from the aforementioned resistance level of 0.7019, the support level of 0.6961 could be a selling target.
 

Attachments

  • 92.4 KB Views: 9
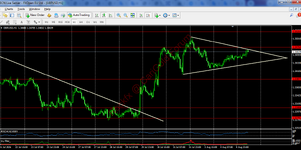
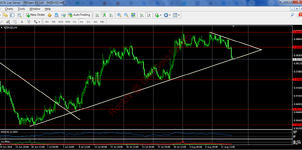
For the GBPUSD pair, the price is within a triangle formed on H1. Therefore, we need to wait for a breakout of one of its sides. If the upper side is broken, the resistance at 1.3520 could be a buy target. If the lower side is broken, the support at 1.3387 could be a sell target.
 

Attachments

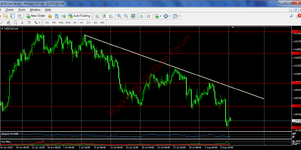
The USDCAD pair's downward movement was held back by the 1.3928 support level. After a rebound from this level, the 1.4000 resistance level could be a potential buy target. If this level is broken upward, the 1.4077 resistance level could be a secondary target.
 

Attachments

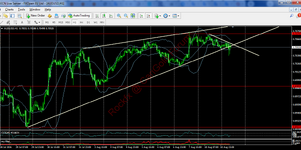
A wedge has formed on the H1 timeframe for the AUDUSD pair. The price is attempting to break below the lower edge of this wedge. If the breakout is successful and the price consolidates below the lower edge, I will consider selling, targeting the support level at 0.6989 for a downside move.
 

Attachments

The EURUSD pair rebounded downward from the resistance level of 1.1580. The local uptrend line on H4 was also broken downwards. Therefore, selling is now the priority, with the support level of 1.1517 as the initial target. If the price breaks below this level and consolidates below it, the support level of 1.1474 could be the second target.
 

Attachments

For the NZDUSD pair, the downward price approached the local upward trend line on H4. After this, we should monitor the price's reaction to this level. If the price breaks and consolidates below this line, the target for continued downward movement could be support at 0.5764. If the price bounces upward, the resistance at 0.5859 could be a buy target.
 

Attachments

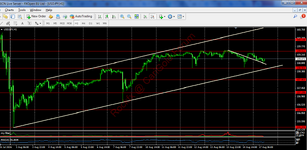
The USD/JPY price is moving in an ascending channel. On the H1 timeframe, a range has formed between the support level at 158.56 and the resistance level at 159.512. If the price breaks above this resistance level and continues to move in the direction of the established uptrend, the next target could be the resistance level at 160.13.
 

Attachments

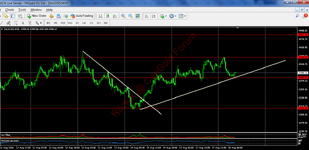
The XAUUSD pair's downward pullback once again contained the 4385 support level, pushing the price higher. I'm considering buying with the first target being the 4434 resistance level. If the price breaks above it and consolidates above it, the second target could be the 4487 resistance level.
 

Attachments

For the AUDUSD pair, the price broke below the local uptrend line formed earlier on H4. The immediate selling target could be the support level at 0.7043. If this level is broken below, the second target could be the support level at 0.7004. If the price bounces upward from 0.7043, the resistance level at 0.7091 could be the buying target.
 

Attachments

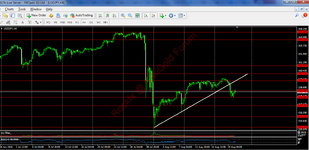
After bouncing upward from support at 158.00, the USDJPY pair reached resistance at 158.56. If this resistance level is broken upward, the target for continued upward movement could be resistance at 159.51 and a retest of the broken side of the local upward trend line on the H4 timeframe.
 

Attachments

Live Forex Chart

Currency
Rates
EUR / USD
1.14724
USD / JPY
155.651
GBP / USD
1.34043
USD / CHF
0.82524
USD / CAD
1.39939
EUR / JPY
178.680
AUD / USD
0.71097
Back
Top
Log in Register