BTC USD 82,944.3 Gold USD 4,194.30
Time now: Jun 1, 12:00 AM

My trading journal using technical analysis

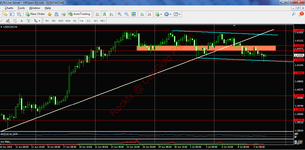
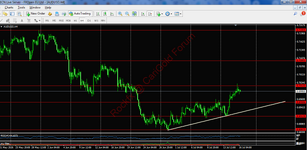
The USDCAD price finally reached the channel's lower boundary and bounced upward from it. The target for an upward rebound could be the area between 1.4193 and 1.4175, from where the downward movement could continue.
 

Attachments

  • 78.1 KB Views: 13
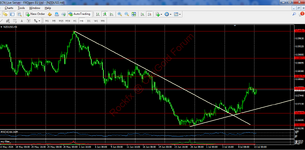
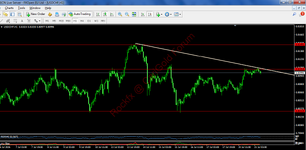
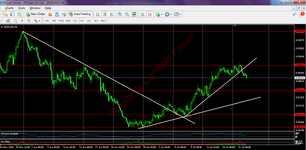
The NZDUSD pair previously broke above the local downtrend line formed earlier on H4. During its bullish move, the pair approached the resistance level of 0.5771. If it breaks and consolidates above it, the next buy target could be the resistance level of 0.5817.
 

Attachments

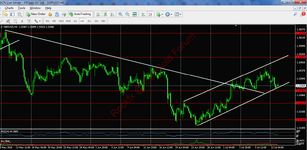
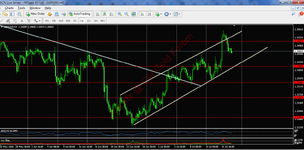
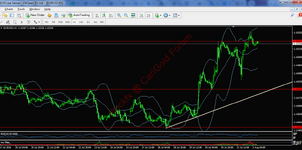
For the GBPUSD pair, after breaking above the local downtrend line on H4, the price continues to move within the ascending channel. After rebounding upward from the lower boundary, the upper boundary of the channel and the resistance level of 1.3509 could be the buying target.
 

Attachments

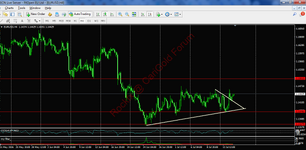
On the GBPUSD pair, the price moved up to my previously identified target—the resistance level of 1.3509—but then made a false breakout. I'm considering selling within the formed ascending channel, targeting its lower boundary and the support level of 1.3398.
 

Attachments

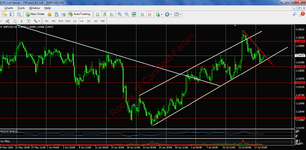
On the GBPUSD pair, the price reached my previously outlined target—the lower boundary of the ascending channel—during its downward movement, rebounding upward from it. If the downward local trend line (in red) is broken upward, the resistance level at 1.3509 could be the target for the upward movement.
 

Attachments

Live Forex Chart

Currency
Rates
EUR / USD
1.12030
USD / JPY
158.285
GBP / USD
1.32415
USD / CHF
0.82966
USD / CAD
1.42645
EUR / JPY
177.327
AUD / USD
0.69840
Back
Top
Log in Register