BTC USD 85,854.3 Gold USD 4,346.18
Time now: Jun 1, 12:00 AM

My trading journal using technical analysis

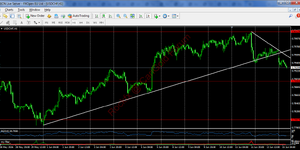
An ascending channel has formed on the USDCAD H1 chart. The price is approaching its upper boundary, which could be a potential downward reversal point. The RSI indicator is also showing divergence, which could also confirm an imminent reversal. If there's a downward rebound, the first sell target could be the support level at 1.3869.
 

Attachments

  • 80.6 KB Views: 10
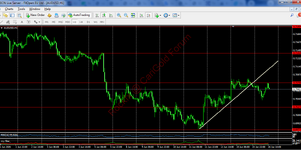
The USDCHF pair shows an ascending channel within a range on the H4 timeframe, bordered by resistance at 0.7923 and support at 0.7775. However, a downward rebound from the upper boundaries of the range and ascending channel occurred earlier. The downward movement may continue to the lower boundary of this ascending channel.
 

Attachments

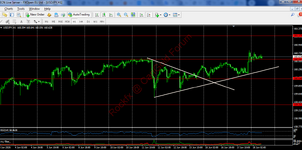
The USDJPY pair has formed an uptrend. A breakout and consolidation above 160.00 occurred. A pullback to this level is possible for a retest, followed by an upward rebound, where the next target for a continued bullish move could be the resistance level at 160.81.
 

Attachments

Nice breakdown. The 160 retest is the key bit for me - if it holds cleanly, bullish continuation makes sense. I’d just be careful chasing too close to 160.80 because yen pairs can whip hard around big round levels
 
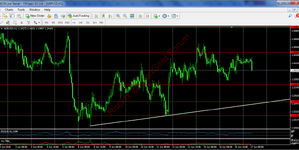
The GBPUSD pair's upward movement was capped by the resistance level of 1.3443, pushing the price downward. The first target for this pullback could be support at 1.3383. If it breaks down and consolidates below it, the second target could be support at 1.3351, where the local uptrend is also located on H1.
 

Attachments

Live Forex Chart

Currency
Rates
EUR / USD
1.14664
USD / JPY
157.470
GBP / USD
1.33702
USD / CHF
0.82127
USD / CAD
1.40314
EUR / JPY
180.561
AUD / USD
0.71228
Back
Top
Log in Register