BTC USD 83,033.1 Gold USD 4,191.95
Time now: Jun 1, 12:00 AM

My personal FX pairs and XAUUSD analysis

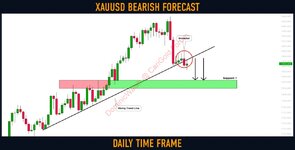
Gold (#XAUUSD): Bearish Outlook For This Week Explained

An important thing happened on 🔻Gold this week.
After a strong bearish movement, the price reached a major rising trend line.
The price was coiling on that since Monday.
On Thursday, it was broken, though.

The price closed below that, forming a bearish engulfing candle.

I believe that the market may keep falling next week.
Next support on focus is 1817 - 1833 area.
 

Attachments

  • 146.3 KB Views: 32
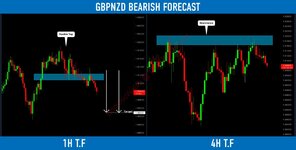
#GBPNZD: Bearish Move From Key Level

🔻GBPNZD reached an important supply cluster last week.
The price formed a double top pattern on an hourly time frame approaching that.

I expect a bearish continuation to 1.903
 

Attachments

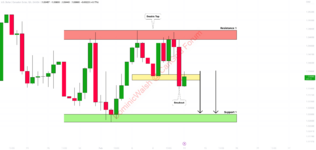
USDCAD is trading within a wide horizontal trading range on a daily.
Approaching its resistance, the price formed a triple-top pattern.
Its neckline was broken on Friday.

I expect a bearish move to 1.328 now.
 

Attachments

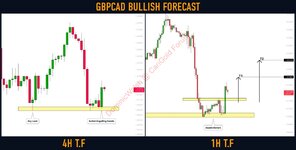
GBPCAD is taking off from a key horizontal support.
The price has formed a bullish engulfing candle on 4h, approaching that structure.
A double bottom on an hourly time frame was formed.

I expect a pullback to: 1.618 / 1.622
 

Attachments

Here is my latest structure analysis for ⚠️NZDUSD.
Resistance 1: 0.6412 - 0.644 area
Resistance 2: 0.6505 - 0.6538 area
Support 1: 0.619 - 0.6226 area
Support 2: 0.6155 - 0.6165 area
Support 3: 0.606 - 0.6095 area
Consider these structures for pullback/breakout trading.
VWAP mt4 Indicator
 

Attachments

GOLD (#XAUUSD): Detailed Structure Analysis

Here are the important key levels to watch on Gold.

Resistance 1: Major broken trend line
Resistance 2: 1897 - 1904 area
Resistance 3: 1946 - 1959 area

Support 1: 1817 - 1832 area
Support 2: 1765 - 1777 area

The market remains relatively weak.
It looks like the market may retest the broken trend line.
Watch carefully!
 

Attachments

#USDJPY: Will We Go Higher?

Update for USDJPY.

Earlier, we spotted a confirmed breakout of a falling parallel channel on a daily.
The price has nicely respected the underlined blue zone we considered the buy zone.

The price bounced from that and set a new local higher-high higher close.

I will expect a further bullish continuation.
Next resistance - 134.5
 

Attachments

MarketBreakdown | Dollar Index, GBPUSD, USDCAD, EURNZD

Here are the updates & outlook for multiple instruments in my watchlist.

1️⃣ Dollar Index (#DXY) daily time frame
The market is consolidating within a narrow horizontal trading range.
Taking into consideration that the index is very bullish from the beginning of February,
I believe that a bullish rally will continue.

Wait for a bullish breakout of the resistance of the range,
daily candle close above that will most likely trigger a bullish continuation.

2️⃣ #GBPUSD daily time frame
The pair was rejected heavily from a key daily structure resistance.
A rejection candle with a long wick was formed.
It indicates an intense bearish pressure.

I believe that the pair will most likely keep falling.

3️⃣ #USDCAD daily time frame
The market is trading within a wide horizontal trading range.
Its support was reached yesterday, and the market was rejected from that.
Probabilities are high that a resistance of the range will be reached soon.

4️⃣ #EURNZD daily time frame
The price is forming a substantial ascending triangle formation.
A bullish breakout of its resistance will initiate a solid bullish wave.
Wait for a daily candle close above the neckline as a confirmation.
 

Attachments

#EURUSD: Waiting For a Breakout

After a strong bearish movement, the pair is consolidating within a narrow horizontal trading range.
1.065 - 1.068 is its support.
I am waiting for its breakout (daily candle close below) to be short.

The pair will most likely drop then.
The goal will be 1.053
 

Attachments

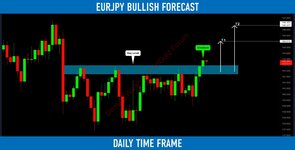
#EURJPY: Important Breakout

EURJPY finally broke and closed above a major horizontal resistance cluster on a daily.

The broken structure turned into a key support now.

I will expect a bullish continuation to 145.0 / 146.3 levels.

Pivot Point Indicator
 

Attachments

Live Forex Chart

Currency
Rates
EUR / USD
1.13588
USD / JPY
156.903
GBP / USD
1.32758
USD / CHF
0.83362
USD / CAD
1.41853
EUR / JPY
178.308
AUD / USD
0.69749
Back
Top
Log in Register