BTC USD 83,564.2 Gold USD 4,177.31
Time now: Jun 1, 12:00 AM

My personal FX pairs and XAUUSD analysis

#AUDNZD: Classic Structure-Based Trade

AUDNZD reached a wide horizontal demand area.
The price formed a double top on that.
Its neckline has just been broken.

I expect a pullback to 1.101 / 1.102
 

Attachments

  • 127.4 KB Views: 34
[Consistent actions lead to consistent results]
I remembered my first trading system.
It was a Bollinger Band mean reversion strategy.
You buy when the price is at the lower band and sell when it’s at the upper band.
The first few trades I did were winners, then the losses came and I figured this trading strategy doesn’t work.
So, I moved on.
Next, I chanced upon harmonic patterns.
I spent half a year learning how to draw these patterns (guess I’m a slower learner).
At the start, I had some wins but slowly, the losses kicked in and eroded all my profits.
Again, I told myself…
“This trading strategy doesn’t work. Let’s try something else.”
This brought me to the world of price action trading, support and resistance, candlestick patterns, etc.
Again, the same pattern repeated itself.
I had some winners, some losers, and I gave up the strategy.
One day, I asked myself…
“Why does this always happen?”
“Why am I not getting any consistency in my trading?”
“It’s always a few winners and then the losses pile up and take everything away.”
Do you know what I realized?
The problem was me.
I was hopping from one trading strategy to the next.
My actions were inconsistent. And because my actions were inconsistent, I got inconsistent results (duh).
So, don’t make my mistakes.
If you want consistent results from trading, you must have consistent actions.
Stick to one trading strategy, master it—and then move on.
 
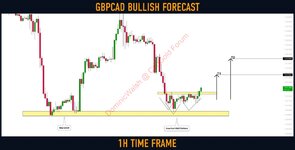
#GBPCAD: Classic Bullish Reversal

GBPCAD reached a key daily structure support.
The price formed a head & shoulders pattern on that
and broke its neckline, then.

I expect a pullback to 1.6165 / 1.62
 

Attachments

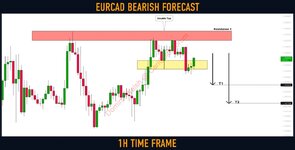
#EURCAD: Bearish Outlook Explained

EURCAD is approaching a solid horizontal resistance cluster.
The price formed a double top, testing that.
Its neckline was broken then.

I expect a bearish move to 1.4333 / 1.4319 levels now.
 

Attachments

Dollar Index (#DXY): Important Breakout

So the range, that we spotted earlier on Dollar Index, is finally broken.
The market successfully closed above that on a daily.

Now a further bullish continuation is expected.
Next target - 105.1
 

Attachments

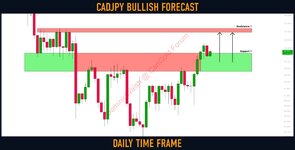
#CADJPY: Bullish Outlook Explained

CADJPY broke and closed above a wide horizontal supply zone on a daily.
The broken structure turned into a demand zone now.

Probabilities will be high that the price will bounce from that.
Next resistance - 100.95
 

Attachments

Gold (#XAUUSD): Your Trading Plan For Next Week

⚠️Gold reached a solid horizontal key level this week.
The price formed a doji candle on that on Thursday and then a rejection candle was formed.

We see the attempt of buyers to push.
To catch a pullback, watch a falling parallel channel and a minor horizontal supply zone.
I would suggest waiting for a bullish breakout of these 2. It will most likely trigger the initiation of a correctional movement.
Let 4h candle close above the trend line and a yellow area to confirm the breakout.

Goal will be 1866.

I will monitor this trading setup and post an update later on.
 

Attachments

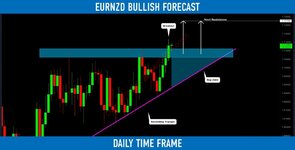
EURNZD: Classic Bullish Setup

EURNZD broke and closed above a neckline of a huge ascending triangle formation on a daily.
Watch the underlined blue zone carefully. It is a contracting buy zone based on a trend line and a broken neckline.

I will expect a bullish wave from that.
Next resistance - 0.728
 

Attachments

USDJPY: Key Levels to Watch This Week

Here is my fresh structure analysis for ⚠️USDJPY.

Resistance 1: 134.48 - 135.475 area
Resistance 2: 137.6 - 138.6 area

Support 1: 132.6 - 132.9 area
Support 2: 129.7 - 131.05 area
Support 3: 127.2 - 128.2 area

Consider these structures for pullback, breakout trading.
 

Attachments

Dollar Index (#DXY): Your Detailed Trading Plan

We have spotted earlier a confirmed structure breakout on Dollar Index.
The market is retesting that at the moment.

To catch a bullish move from that with a confirmation, watch a double-bottom pattern on the 4H time frame.

104.05 - 104.09 is its neckline.
Wait for its bullish breakout; we need a 4H candle close above that to confirm the violation.

A bullish continuation will be expected then to 104.55.

If the price sets a new lower low, the setup will become invalid.
 

Attachments

Latest Posts

Live Forex Chart

Currency
Rates
EUR / USD
1.13387
USD / JPY
157.214
GBP / USD
1.32290
USD / CHF
0.83355
USD / CAD
1.41777
EUR / JPY
178.394
AUD / USD
0.69869
Back
Top
Log in Register