BTC USD 83,596.9 Gold USD 4,154.41
Time now: Jun 1, 12:00 AM

My personal FX pairs and XAUUSD analysis

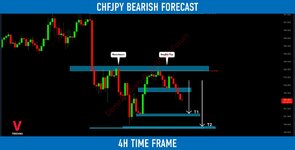
#CHFJPY: Classic Bearish Setup 🇨🇭🇯🇵

🔻CHFJPY has nicely respected a confluence zone based on a horizontal 4H resistance and a 0.5 retracement of the last bearish impulse.

The price formed a double top pattern on that and broke its neckline.

Probabilities will be high that the pair will drop lower soon.
Goals: 141.172 / 140.363
 

Attachments

  • 150.7 KB Views: 32
Market Breakdown | WTI Oil, EURUSD, GBPNZD, EURAUD

Here are the updates & outlook for multiple instruments in my watchlist.

1️⃣ WTI Oil daily time frame️
The market is trading in a long term bearish trend .
After the last sharp bearish movement, the market is steadily recovering.

Ahead, I see a major horizontal supply area.
Probabilities are high, that the next bearish wave will initiate from there.

2️⃣ EURUSD daily time frame
After a breakout of a solid daily resistance, the market is preparing for its retest.
Watch carefully the underlined zone and look for buying opportunities from there.

3️⃣ EURAUD weekly time frame
The pair is currently approaching a weekly horizontal resistance cluster.
Taking into consideration, that the pair is quite overbought, probabilities will be high to see a pullback from that

4️⃣ GBPNZD daily time frame
The pair is currently retesting a broken neckline of an ascending triangle . As we discussed earlier, the trend line of a triangle and its neckline compose a contracting buy zone now.
Chances will be high that the next bullish wave will initiate quite soon.
For Additional confirmation use: Divergence Indicators
 

Attachments

Gold (#XAUUSD): 2 Scenarios For This Week Explained

⚠️Gold closed this week, approaching a solid daily resistance.
Depending on the reaction of the price to that structure, I see 2 potential scenarios for next week.

Bullish Scenario
If the price breaks and closes above 2010 resistance on a daily,
a bullish continuation will be expected to 2060 level.

Bearish Scenario
The price may respect the underlined resistance.
1917 - 1940 is the closest strong support.
If the price drops and closes below that area,
a bearish continuation will be expected to 1891.

Wait for a breakout and then follow the market.
For Additional confirmation use: ROC Indicator
 

Attachments

#USDJPY: Key Levels to Watch This Week

Here is my latest structure analysis for USDJPY.

Resistance 1: 132.46 - 133.25 area
Resistance 2: 135.0 - 135.8 area
Resistance 3: 137.36 - 137.9 area

Support 1: 129.64 - 130.7 area
Support 2: 128.09 - 128.7 area
Support 3: 127.2 - 127.8 area

Consider these structures for pullback/breakout trading.
 

Attachments

#GBPNZD: Nice Bullish Clues

Update for GBPNZD.
It looks like the price has nicely respected a broken triangle.
The price formed a bullish engulfing candle on a daily.

Bullish bias on a pair remains.
Goal remains unchanged - 1.997
 

Attachments

#EURUSD: Peculiar Pattern

I spotted a cup & handle pattern on ⚠️EURUSD on 1H time frame.
1.0777 - 1.0783 is its neckline.

If the price breaks and closes above that, I will expect a bullish movement.
Goals will be 1.0843 / 1.0894

If the price sets a new low, the pattern will become invalid.
 

Attachments

Natural Gas (#NATGASUSD): How to Buy With Confirmation

Hey traders,

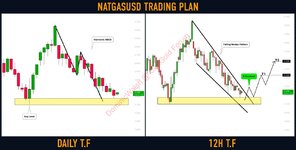
I spotted a classic harmonic ABCD pattern on
26a0-fe0f.png
Natural Gas.
The completion point of the pattern matches perfectly with a horizontal key level.

Analyzing intraday time frames, I also spotted a falling wedge pattern on 12H.

To buy with a confirmation, wait for a bullish breakout of the resistance of the wedge.
Its violation may initiate a bullish movement.

The goals will be 2.43 / 2.58
Learn more about - chart patterns
 

Attachments

#EURCAD: One More Bullish Move Ahead

EURCAD is taking off from a solid horizontal structure support.
The price formed a bullish engulfing candle on a 4H time frame,
engulfing the range of the last 4 candles.

Chances will be high to see a movement up.
Goals: 1.485 / 1.4914
 

Attachments

Dollar Index (#DXY): Key Levels to Watch This Week

Here is my latest structure for Dollar Index.

Resistance 1: 103.11 - 103.63 area
Resistance 2: 104.74 - 105.1 area
Resistance 3: 105.667 - 105.88 area

Support 1: 100.82 - 100.88 area

Consider these structures for pullback/breakout trading.
For Additional confirmation use: Swing Trading Indicators
 

Attachments

#USDCAD: Important Breakout

USDCAD broke and closed below a solid horizontal demand cluster on a daily.
The broken structure turned into resistance now.

Probabilities will be high to see a bearish move from that.
Goals will be 1.356 / 1.346
For Additional confirmation use: the best mt4 indicators
 

Attachments

Live Forex Chart

Currency
Rates
EUR / USD
1.13705
USD / JPY
156.971
GBP / USD
1.32581
USD / CHF
0.83185
USD / CAD
1.41683
EUR / JPY
178.700
AUD / USD
0.70252
Back
Top
Log in Register