Analisis Harian Indeks USDX untuk 07 November, 2017
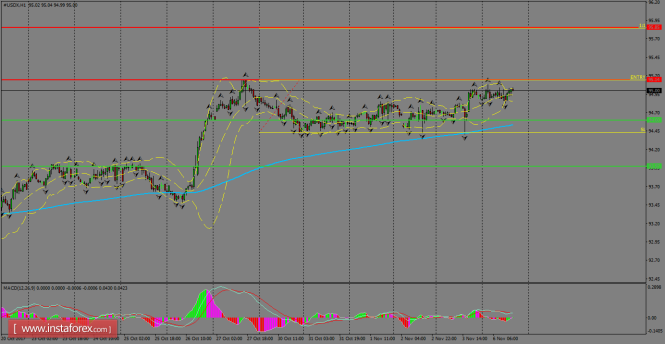
Indeks USDX kekal sah dalam kecenderungan menaik yang telah ditubuhkan sejak minggu lepas di atas SMA 200 pada carta 1H. Rintangan paling hampir ditetapkan pada tahap 95.14, di mana penembusan harga akan mendedahkan tahap 95.85. Pada masa ini, tindakan harga tidak mencadangkan kesinambungan penurunan harga dalam Indeks USDX, tetapi penurunan harga dijangkakan akan menguji SMA 200 dalam beberapa jam yang akan datang.
Tahap Rintangan Carta 1H: 95.14 / 95.85 Tahap Sokongan Carta 1H: 94.60 / 93.97 Cadangan Perdagangan untuk Hari Ini: Berdasarkan pada carta 1H, para pedagang disarankan untuk mengambil pesanan membeli (beli) hanya sekiranya Indeks USDX ini berjaya menembusi cartalilin kenaikkan harga; dengan menetapkan rintangan pada tahap 95.14, Take profit di tahap 95.85 dan stop loss pada tahap 94.47.
Analisis Harian Indeks USDX untuk 08 November, 2017
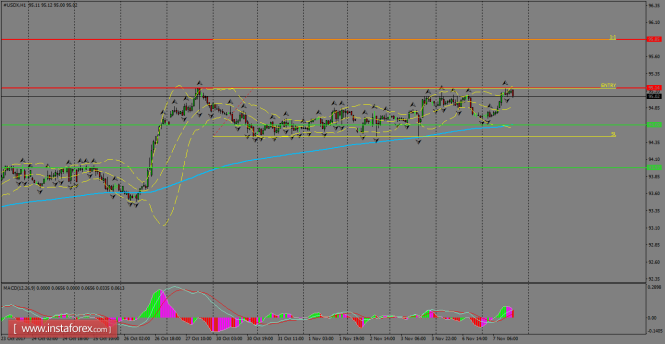
Indeks USDX kekal diniagakan dalam julat harga, disokong dengan baik oleh SMA 200 pada carta 1H. Zon rintangan yang terletak pada tahap 95.14 kini dilihat membantu menambahkan tekanan buat indeks USDX dan sekiranya harga berjaya menembusinya, adalah diramalkan bahawa akan terdapat satu lagi kenaikkan yang lebih tinggi akan berlaku ke arah tahap 95.85. Untuk aliran menurun, tahap sokongan 94.60 kekal sebagai garis penentu untuk tindakan penurunan harga.
Tahap Rintangan Carta 1H: 95.14 / 95.85 Tahap Sokongan Carta 1H: 94.60 / 93.97 Cadangan Perdagangan untuk Hari Ini: Berdasarkan pada carta 1H, para pedagang disarankan untuk mengambil pesanan membeli (beli) hanya sekiranya Indeks USDX ini berjaya menembusi cartalilin kenaikkan harga; dengan menetapkan rintangan pada tahap 95.14, Take profit di tahap 95.85 dan stop loss pada tahap 94.47.
USDX remains in sideways and now it's challenging the 200 SMA at H1 chart. Bulls are trying to gain impetu in the short-term, with the nearest target placed at the 95.14 level, which also should give up in order to allow a rally towards the 95.85 level. To the downside, the next strong support is placed around 93.97.
H1 chart's resistance levels: 95.14 / 95.85 H1 chart's support levels: 94.60 / 93.97 Trading recommendations for today: Based on the H1 chart, place buy (long) orders only if the USD Index breaks with a bullish candlestick; the resistance level is at 95.14, take profit is at 95.85 and stop loss is at 94.47.
Ichimoku indicator analysis of USDX for November 10, 2017
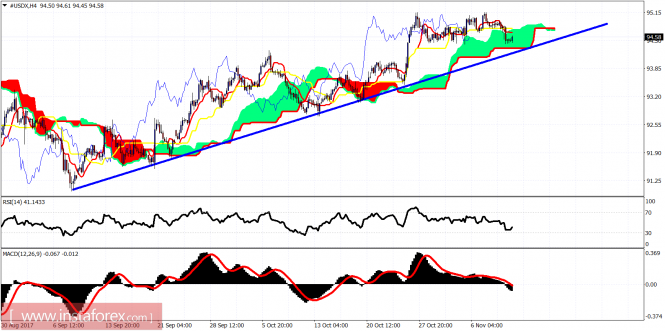
The Dollar index has entered the Ichimoku cloud. Trend has changed to neutral. However medium-term trend remains bullish as price is making higher highs and higher lows.
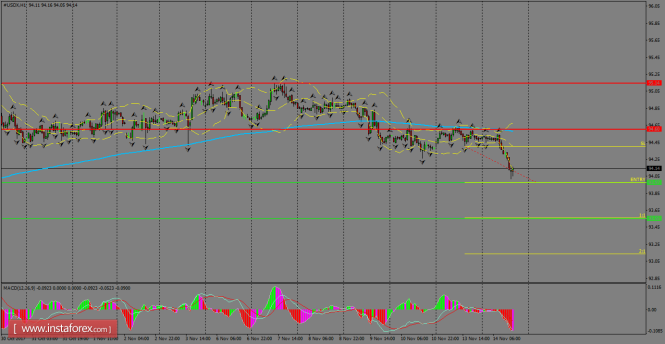
Blue line - trend line support The Dollar index short-term trend is neutral as price has entered inside the Ichimoku cloud. Support is at the lower cloud boundary and at the blue trend line support at 94.28-94.20. Resistance is at 94.75.
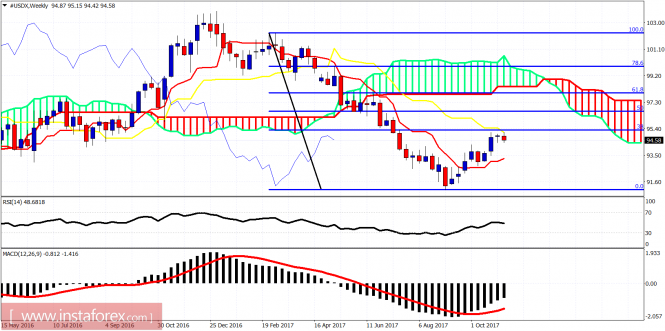
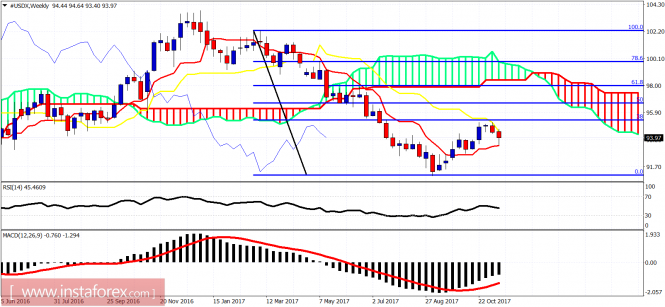
On a weekly basis, we see price turn around as it is being rejected by the weekly kijun-sen (yellow line indicator) and the 38% Fibonacci retracement. This is a bearish sign that will at least push price towards the tenkan-sen (red line indicator). I remain longer-term bearish but we do not have a confirmation yet that the entire upward corrective bounce is complete.
Analisis Harian Indeks USDX untuk 15 November, 2017
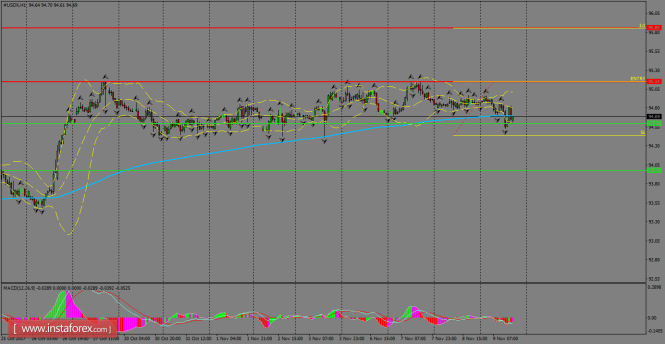
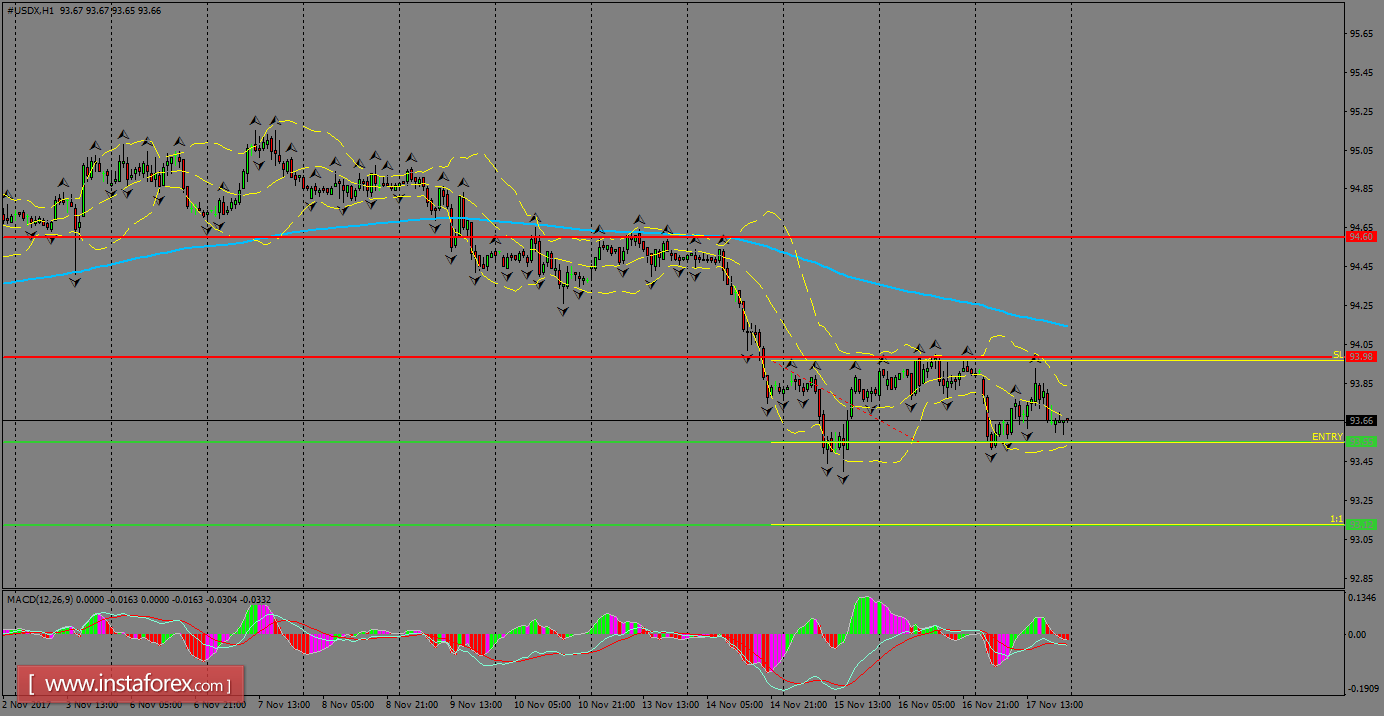
Indeks USDX meneruskan dagangan dalam aliran menurun dan dijangkakan akan jatuh lebih rendah dalam beberapa hari yang akan datang, sebagaimana dolar AS masih berada di bawah tekanan di bawah SMA 200. Sokongan paling hampir terletak pada tahap 93.97 dan harga berpotensi untuk menembusi di bawah tahap tersebut untuk mencapai tahap 93.55. Indikator MACD kekal memihak kepada aliran penurunan harga.
Tahap Rintangan Carta 1H: 94.60 / 95.14 Tahap Sokongan Carta 1H: 93.97 / 93.55 Cadangan Perdagangan untuk Hari Ini: Berdasarkan pada carta 1H, para pedagang disarankan untuk mengambil pesanan membeli (beli) hanya sekiranya Indeks USDX ini berjaya menembusi cartalilin kenaikkan harga; dengan menetapkan rintangan pada tahap 95.14, Take profit di tahap 95.85 dan stop loss pada tahap 94.47.
Elliott wave analysis of USDX for November 15, 2017
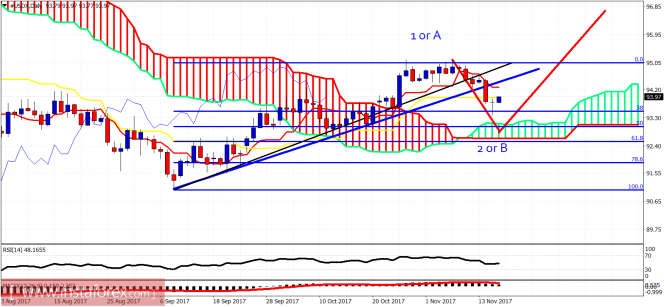
There are a lot of chances that the Dollar index has more upside if the current decline is wave A or wave 2. Today we are going to talk about this scenario and when it gets canceled. However our primary scenario remains the one where the entire upward corrective wave has been completed and we have already started the final leg down towards 88.
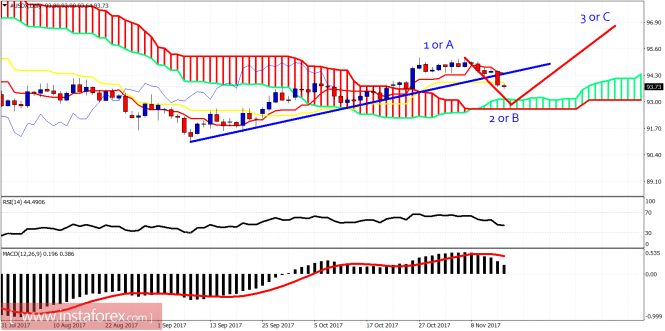
Blue line - support trend line Red line - projection The Dollar index has broken the trend line support and is heading towards cloud support at 93. This is also the area of the previous lesser degree fourth wave and high probability target for the pull back to end. Resistance is at 94.35. The downward move could very well be wave B or 2. A wave C or 3 should follow if this scenario is valid.
As we noted in previous posts, price was getting rejected at the 61.8% Fibonacci retracement. The entire correction could be over and we could already have started the final leg down. If however the correction is not over yet or even if the Dollar index has bottomed in September, there is a good chance this decline finds support soon and reverses upwards for a move towards 96-97. This is a valid scenario and we should keep as a very probable alternative.
Wave analysis of the USD/X currency pair for November 16, 2017
The Dollar index has made a reversal day yesterday. Price is bouncing off the 38% Fibonacci retracement and price action increases the chances of the two wave scenarios we posted yesterday.
Price is trading above the daily Ichimoku cloud. Price has reached the 38% Fibonacci level and is bouncing. Yesterday's candle formation was a doji star reversal pattern. Price could very well have ended wave 2 or wave B down. Support is at 93.10-92.65. Resistance is at 94.20-94.50.
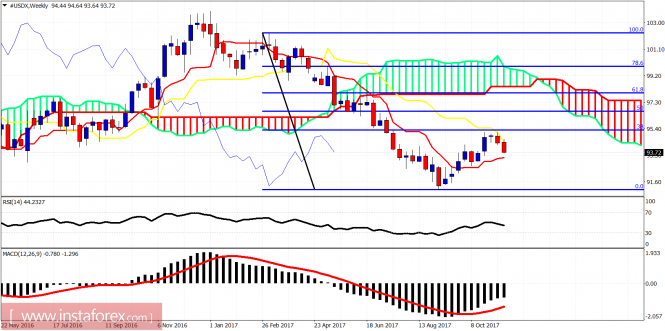
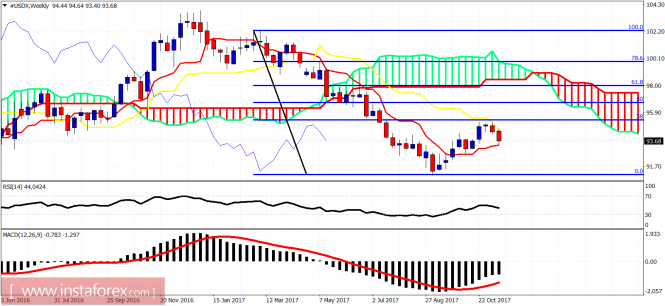
On a weekly basis price has touched the weekly tenkan-sen (red line indicator) and bounced. Resistance is at 94.60. A break above that level will push price towards the recent highs again. A break above recent highs will push the index towards the 61.8% Fibonacci retracement and the weekly Kumo (cloud).
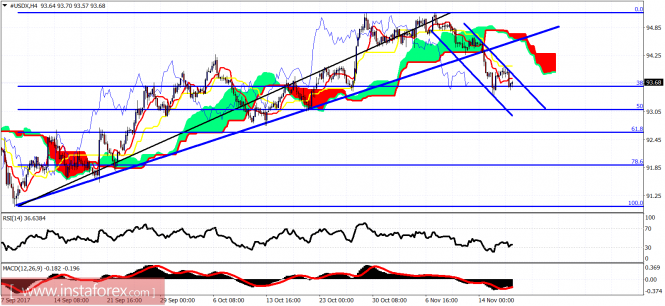
The Dollar index got rejected and reversed from our 95 target as expected. Price is in a bearish short-term trend making lower lows and lower highs. Price could soon start a bounce that could unfold into a bigger move as explained by our alternative wave scenarios yesterday.
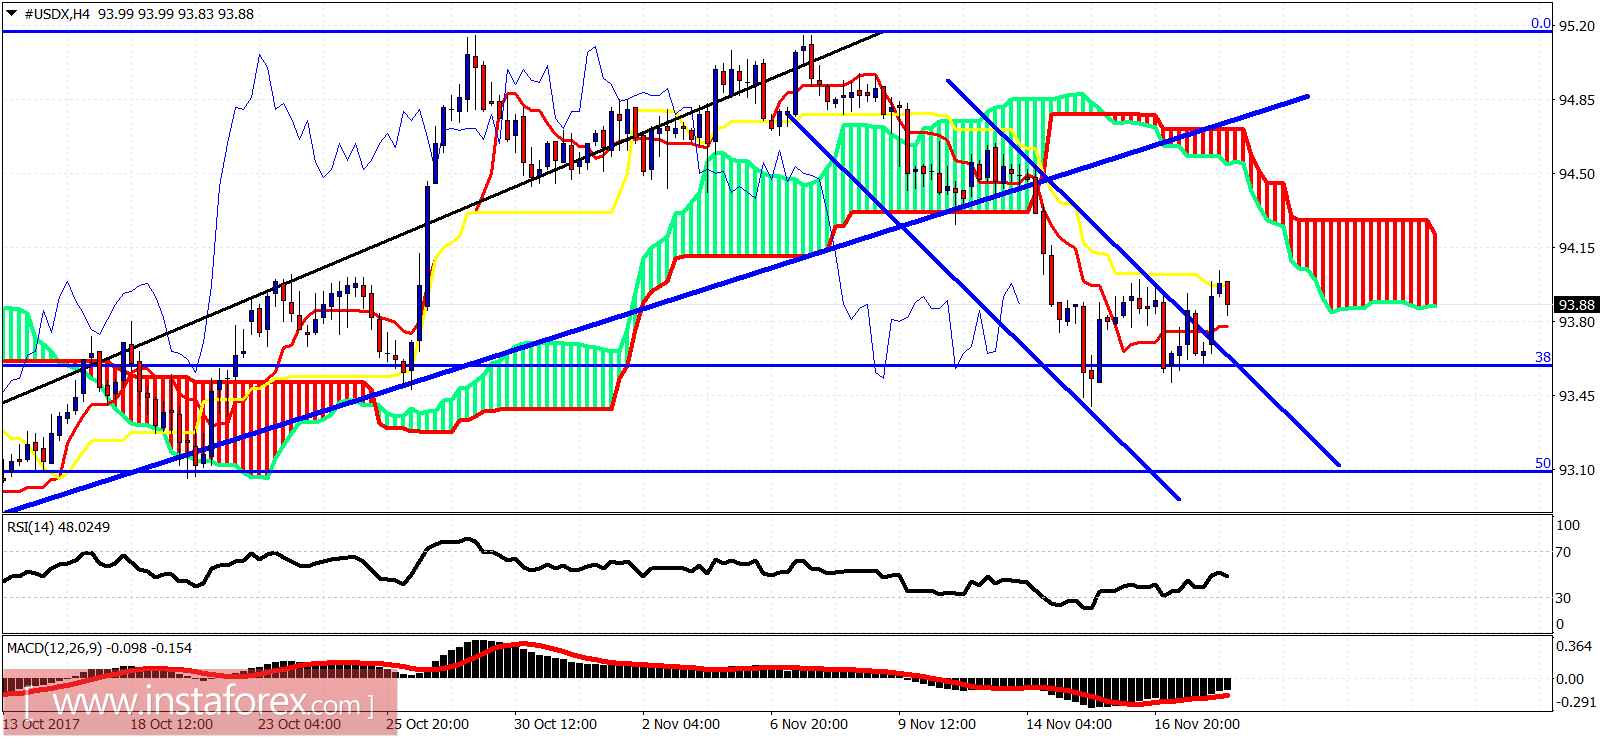
Blue lines - bearish channel The Dollar index is trading below the 4-hour Ichimoku cloud. Trend is bearish as price remains inside the bearish channel. Price has stopped the decline at the 38% Fibonacci retracement. The Dollar index could make another new low towards the 93 level however bulls should be very cautious as there are bullish alternative wave scenarios we talked about yesterday that should not be ignored.
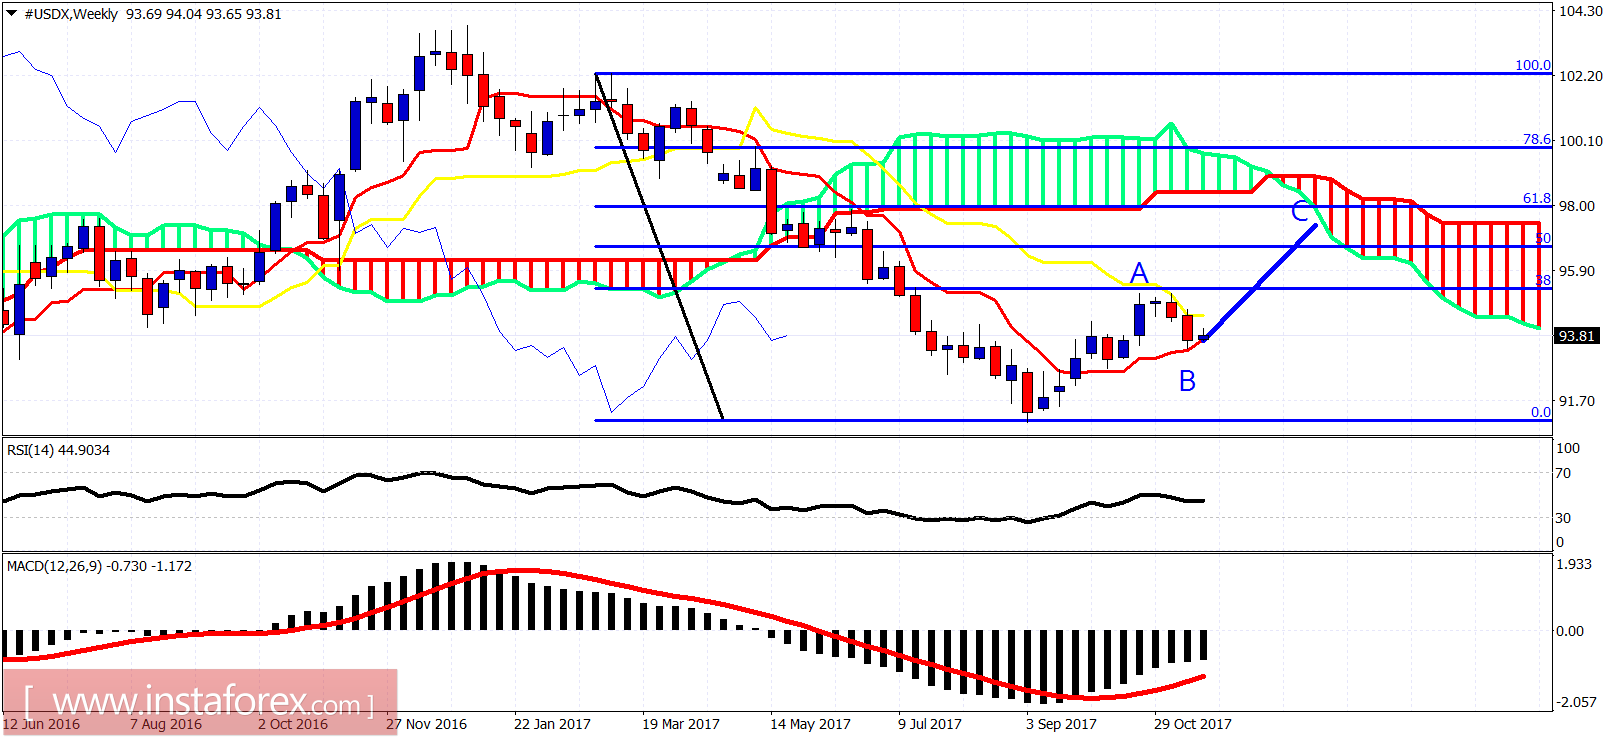
On a weekly basis, the Dollar index is in a bearish trend. Price got rejected at the kijun-sen and the 38% Fibonacci retracement. Price remains now above the tenkan-sen. There are many chances the Dollar index bounces from current levels or a bit lower towards the weekly Kumo and the 61.8% Fibonacci retracement. So bears need to be cautious.
Analisis Harian Indeks USDX untuk 20 November, 2017
Indeks USDX kekal diniagakan dalam aliran menurun di bawah SMA 200 pada carta 1H dan tahap sokongan 93.55 masih menyokong harga untuk meneruskan penurunan harga dalam dagangan jangka pendek. Sekiranya harga berjaya menembusi pada tahap tersebut, adalah diramalkan bahawa harga akan merekodkan tahap rendah baru untuk menguji zon 93.12. Untuk aliran menaik, SMA 200 pada carta 1H adalah rintangan paling hampir untuk ditembusi.
Tahap Rintangan Carta 1H: 93.98 / 94.60 Tahap Sokongan Carta 1H: 93.55 / 93.12 Cadangan Perdagangan untuk Hari Ini: Berdasarkan pada carta 1H, para pedagang disarankan untuk mengambil pesanan menjual (jual) hanya sekiranya Indeks USDX ini berjaya menembusi cartalilin penurunan harga; dengan menetapkan sokongan pada tahap 93.55, take profit pada tahap 93.12 dan stop loss pada tahap 93.97.
The Dollar index has stopped at the 38% Fibonacci retracement support as we noted in our latest analysis. This is a good support are where we could at least see a trade-able bounce. The Dollar index could still make a new lower low towards 93 before the bounce, but overall we should not ignore the bullish alternative wave counts.
Blue lines - bearish channel The Dollar index has broken out of the bearish channel. Is is a first bullish sign for a possible bounce. Price is below the Ichimoku cloud. Resistance is at 94.50. The decline so far is corrective in three waves, as the rise from September lows can be seen as impulsive. This implies that another leg higher is expected to follow.
The fact that price has stopped where it has, has increased the chances of another leg higher dramatically. The downward move and rejection at 95 could very well be wave B while we should now expect a wave C higher towards the 61.8% Fibonacci retracement or the Ichimoku cloud resistance. The target area would be 97-98. Bears should be very cautious.