Ichimoku indicator analysis of USDX for October 26, 2017
As expected, the US dollar index pulled back off the 94 resistance area towards the short-term support of 93.50 as we mentioned in yesterday's analysis. The trend remains bullish as the price is still above cloud support and inside the bullish channel.
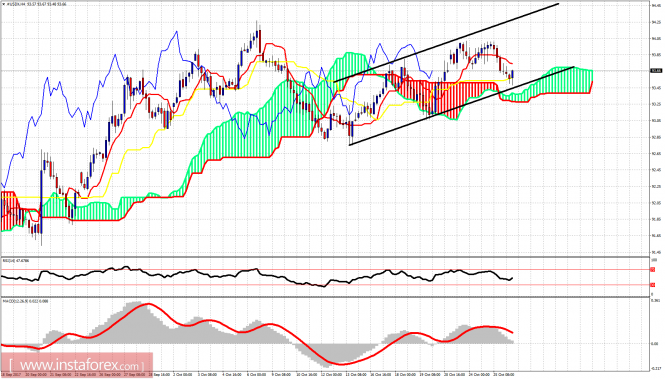
Black lines - bullish channel The dollar index is trading inside the bullish channel. The support is found at 93.50 and the resistance lies at 94. Breaking above the resistance will open the way for a move towards 94.30-94.50. As long as the price is above 93.50 the trend is bullish.
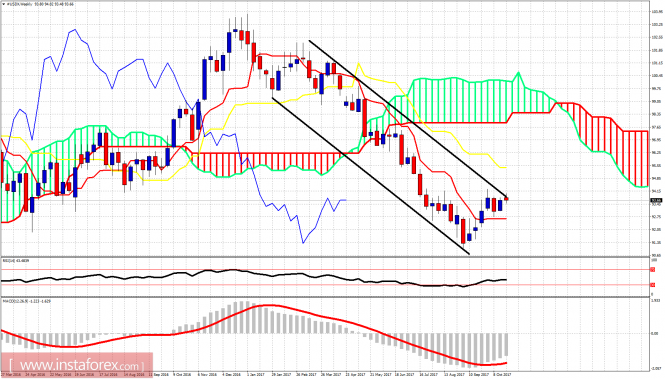
Black lines - bearish channel On a weekly basis the Dollar index remains inside the bearish channel and shows signs of rejection at the upper channel boundary. Breaking above 94 will probably push the price towards the weekly kijun-sen (yellow line indicator) at 95.45. Short-term trend remains bullish but we could see its end today if we break 93.50. Until then trend is bullish targeting 95.
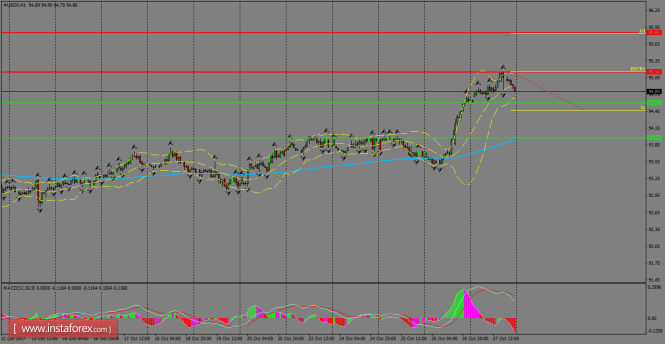
Indeks USDX ini dilihat sedang membentuk corak harga tinggi yang lebih tinggi di bawah zon rintangan pada tahap 95.14 dan harga diramalkan akan menembusi tahap tinggi baru dalam dagangan jangka pendek. Jika penembusan harga berlaku pada tahap tersebut, kita boleh mengharapkan kenaikkan harga ke arah tahap 95.85. Untuk aliran menurun, sokongan paling hampir terletak pada tahap 94.60 dan sekiranya Indeks USDX ini ditarik semula untuk diniagakan di bawah tahap tersebut, maka adalah diramalkan bahawa harga akan menguji SMA 200 pada carta 1H.
Tahap Rintangan Carta 1H: 95.14 / 95.85 Tahap Sokongan Carta 1H: 94.60 / 93.97 Cadangan Perdagangan untuk Hari Ini: Berdasarkan pada carta 1H, para pedagang disarankan untuk mengambil pesanan membeli (beli) hanya sekiranya Indeks USDX ini berjaya menembusi cartalilin kenaikkan harga; dengan menetapkan rintangan pada tahap 95.14, Take profit di tahap 95.85 dan stop loss pada tahap 94.47.4.47.
Analisis Harian Indeks USDX untuk 31 Oktober, 2017
Indeks USDX kekal disokong oleh tahap 94.60 dan dilihat masih menunggu pemangkin yang berpotensi untuk mendorong harga meneruskan kecenderungan aliran menaik. Zon rintangan yang terletak pada tahap 95.14 kini menghalang kenaikan harga dalam indeks USDX dan sekiranya harga berjaya menembusi tahap tersebut, maka adalah diramalkan bahawa harga akan melonjak lebih tinggi untuk menguji tahap 95.85, sementara untuk aliran menurun, sokongan paling hampir dilihat terletak pada SMA 200 dalam carta 1H.
Tahap Rintangan Carta 1H: 95.14 / 95.85 Tahap Sokongan Carta 1H: 94.60 / 93.97 Cadangan Perdagangan untuk Hari Ini: Berdasarkan pada carta 1H, para pedagang disarankan untuk mengambil pesanan membeli (beli) hanya sekiranya Indeks USDX ini berjaya menembusi cartalilin kenaikkan harga; dengan menetapkan rintangan pada tahap 95.14, Take profit di tahap 95.85 dan stop loss pada tahap 94.47.
Ichimoku indicator analysis of USDX for October 31, 2017
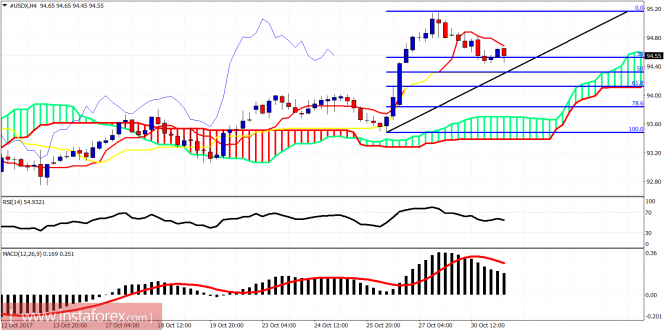
The US dollar index has pulled back towards the 38% Fibonacci retracement of the latest rise from 93.50. The decline looks corrective and it is more probable to see new highs in the index. The level of 95.45 remains our bounce target but not to be traded as I prefer to wait for a selling opportunity or signal.
The dollar index is trading above the 4 hour Kumo cloud support. Price is hovering between the Tenkan- and the Kijun-sen indicators. Support by the Kijun-sen is at 94.30 while resistance lies at 94.70. The trend remains bullish and this is still considered as a pull back in an up-trend.
On a weekly basis the price is making higher highs and higher lows. It is approaching our short-term target of the 38% Fibonacci retracement. Above 94 is not the time to be buying the dollar index. I prefer to wait for a sell signal and an opportunity around 95.50 because I expect a rejection and a reversal in the index.
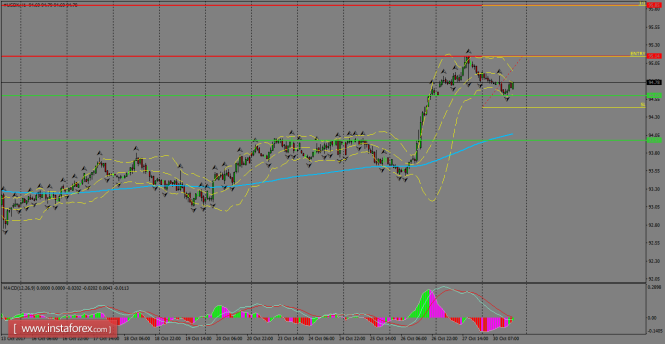
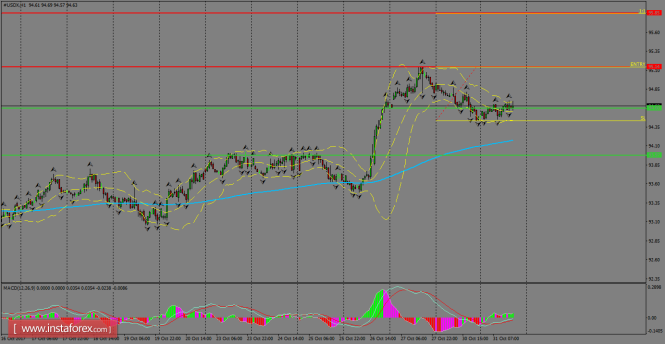
The index continues to ride a retracement from the resistance level of 95.14 and now remains supported by the fractals formed during yesterday's lows. The 200 SMA at the H1 chart is approaching to the current price action and it can serve as dynamic support. The downside could get extended towards the 93.97 level.
H1 chart's resistance levels: 95.14 / 95.85 H1 chart's support levels: 94.60 / 93.97 Trading recommendations for today: Based on the H1 chart, place buy (long) orders only if the USD Index breaks with a bullish candlestick; the resistance level is at 95.14, take profit is at 95.85 and stop loss is at 94.47.
Ichimoku indicator analysis of USDX for November 1, 2017
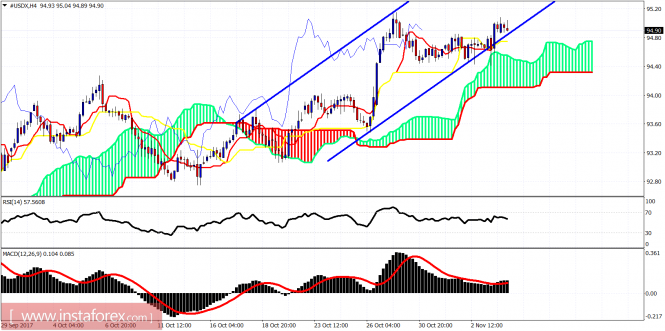
The Dollar index remains in a short-term bullish trend. The price is making higher highs and higher lows and remains inside the bullish short-term channel. The upside target remains at 95.50 as long as we trade above 93.50-94.
Blue lines - bullish channel The 4-hour chart shows price above the important indicator kijun-sen (yellow line) and of course above the cloud. The trend is bullish. Support is at 94.40 and next at 94. We could test lower but for a move towards 95.50 to continue, support at 94 must not fail to hold.
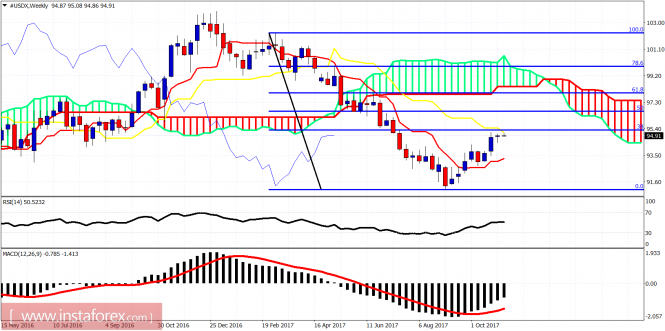
On a weekly basis, the trend remains bearish. We consider this bounce only as a corrective pull back upwards before the resumption of the bigger downward trend. The 38% Fibonacci retracement has not been reached yet. I believe we can test that level but in general, I remain longer-term bearish looking for a decline towards 88.
Ichimoku indicator analysis of USDX for November 2, 2017
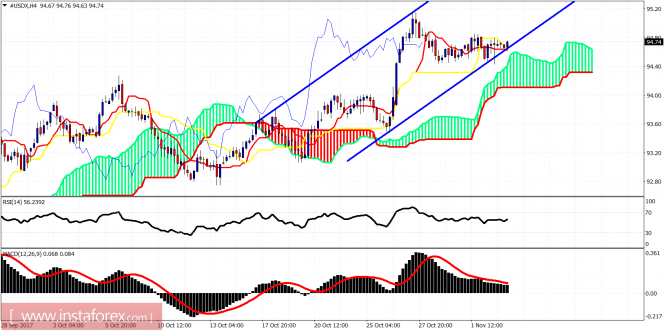
The Dollar index is testing the channel support. Price reached the lower channel boundary. The trend remains bullish as the price is still above the Kumo. However, we have the first warning as the price has moved below the kijun-sen.
Blue lines - bullish channel The Dollar index is testing short-term channel support at 94.45. Breaking below this level will push price towards the Kumo support at 94.05. Breaking below the Kumo support will change short-term trend to bearish.
On a weekly basis, nothing has changed. Price remains below the weekly kijun-sen and the 38% Fibonacci retracement. Price could push towards 95.50 where the 38% Fibonacci retracement is found. Rejection at current levels could bring the index towards the tenkan-sen at 93. Breaking below 93 will confirm that the next downward move has started.
Ichimoku indicator analysis of USDX for November 3, 2017
The Dollar index marginally broke below the bullish short-term channel yesterday but sharply came back inside. The announcement of Non-Farm Payrolls today could give a boost for the Dollar for the final new high. Or is this what everyone expects and the market will not deliver?
Blue lines - bullish channel The Dollar index remains in a bullish trend. Price is breaking above both the tenkan- and kijun-sen indicators prior to the announcement of the NFP later today. Technically as long as we are above yesterday lows we should be heading towards 95-95.50.
The price on the weekly chart has nothing new to show us. We remain close to the 38% Fibonacci retracement and the weekly kijun-sen. The longer-term trend remains bearish. We could see one final spike higher towards 95.50 but I believe that over the coming weeks the downtrend will resume.
Ichimoku indicator analysis of USDX for November 6, 2017
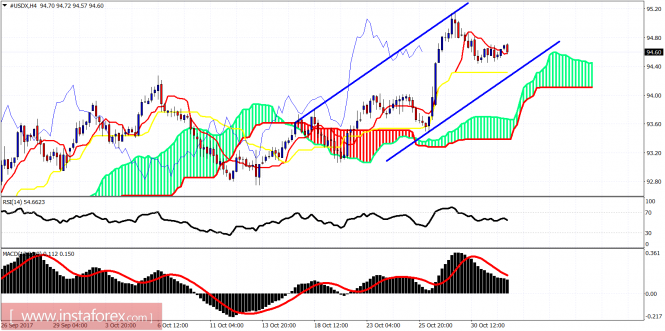
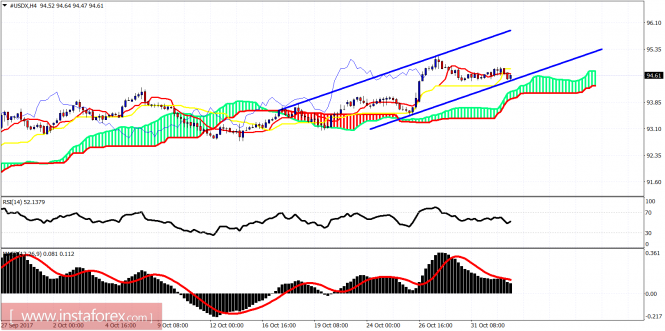
The dollar index marginally broke below the bullish channel last week but price held above the 4 hour Ichimoku cloud support. The trend remains bullish targeting towards 95.50.
Blue lines - bullish channel The dollar index is trading above the Kumo (cloud). The trend remains bullish. Support is at 94.75-94.50 and the next one is found at 94.10. As long as the price is above that levels, we should continue to expect the extension of this upward move towards 95.50-96.
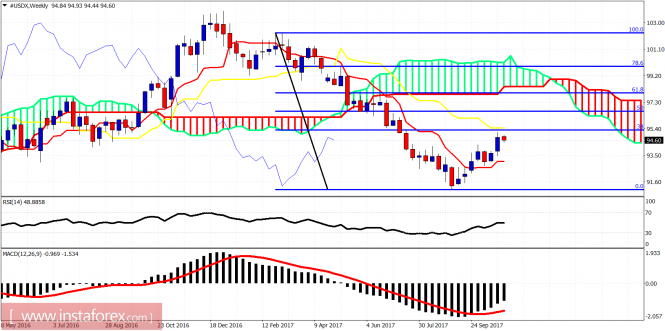
On a weekly basis nothing has changed. Price is heading towards our 1st target of the 38% Fibonacci retracement where we also find the kijun-sen (yellow line indicator). Important weekly support is at 93.30 and bears must break that level in order to have a confirmation for the resumption of the bearish trend.
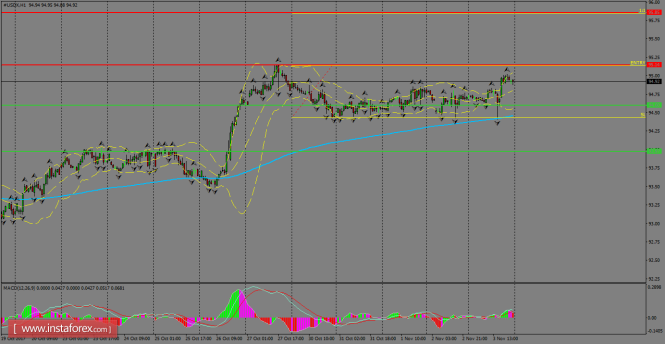
There are no major changes in the short-term structure for USDX, as it stays consolidated above the 200 SMA on the H1 chart. If the index manages to rebound over the moving average, it could be targeting the resistance zone of 95.85, while a pullback should make a lower extension to reach the 93.97 level.
H1 chart's resistance levels: 95.14 / 95.85 H1 chart's support levels: 94.60 / 93.97 Trading recommendations for today: Based on the H1 chart, place buy (long) orders only if the USD Index breaks with a bullish candlestick; the resistance level is at 95.14, take profit is found at 95.85 and stop loss lies at 94.47.