Analisis Harian Indeks USDX untuk 21 September, 2017
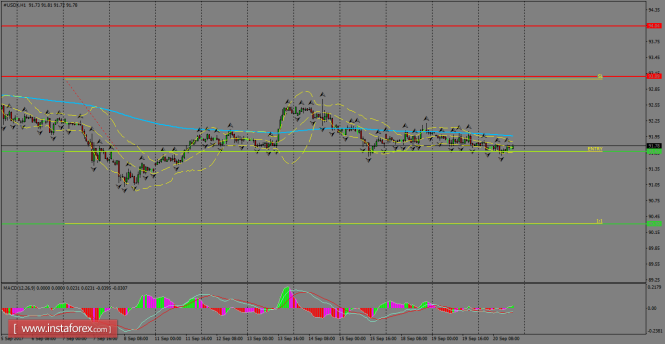
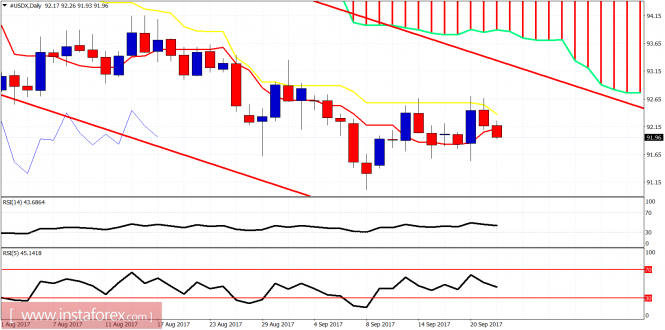
Indeks USDX dilihat masih dalam pendekatan tunggu-dan-lihat menjelang pengumuman laporan makro ekonomi utama di Amerika Syarikat. Sokongan yang terletak pada tahap 91.67 kekal sebagai halangan yang besar bagi penjual dan zon permintaan utama di mana aliran menaik berkemungkinan akan mengumpul momentum untuk mencapai zon rintangan pada tahap 93.09. Untuk aliran menurun, sekiranya Indeks Dolar AS diniagakan jatuh di bawah kawasan tersebut, adalah diramalkan bahawa Indeks USDX akan meneruskan pergerakkan penurunan harga menuju ke arah tahap 90.30.
Tahap Rintangan Carta 1H: 93.09 / 94.04 Tahap Sokongan Carta 1H: 91.67 / 90.30 Cadangan Perdagangan untuk Hari Ini: Berdasarkan pada carta 1H, para pedagang disarankan untuk mengambil pesanan menjual (jual) hanya sekiranya Indeks USDX ini berjaya menembusi cartalilin penurunan harga; dengan menetapkan sokongan pada tahap 91.67, take profit pada tahap 90.30 dan stop loss pada tahap 93.04.
Ichimoku indicator analysis of USDX for September 21, 2017
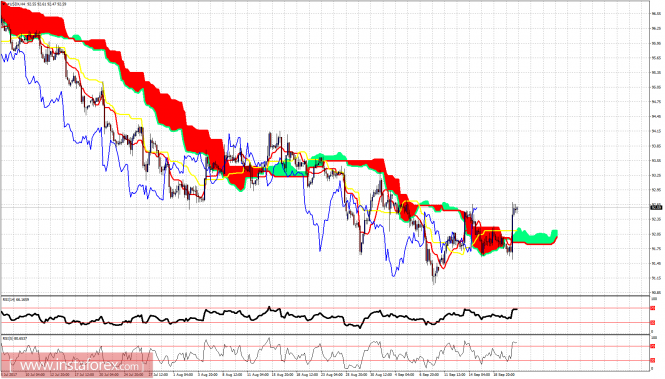
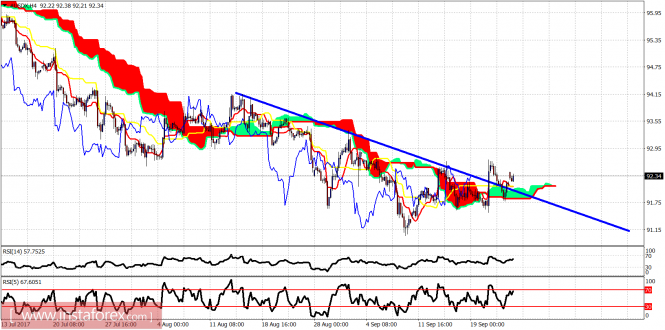
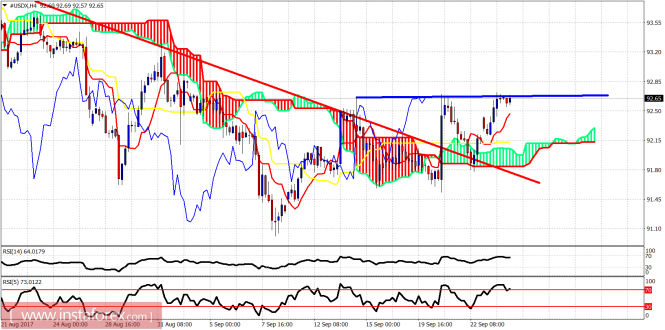
The Dollar index spiked yesterday after the FOMC. Price is testing weekly resistance levels at 92.50. So far we consider this upward bounce as a corrective play in a larger down trend.
The Dollar index has broken out of the Ichimoku cloud in the 4-hour chart. This is a bullish sign. The Dollar index is however diverging. So a pullback towards cloud support at 92.10-92 is justified. Bulls will then need to hold above support. Otherwise we will see this breakout as a fake one.
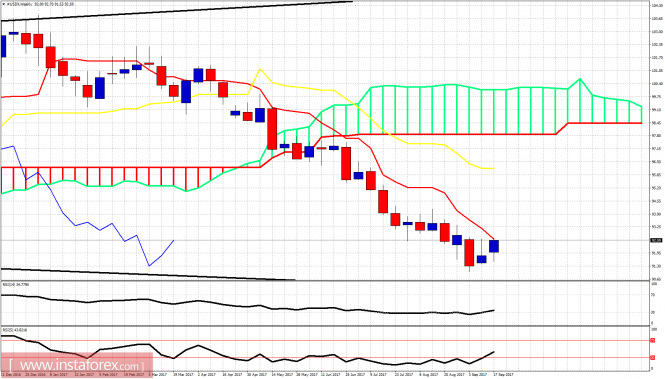
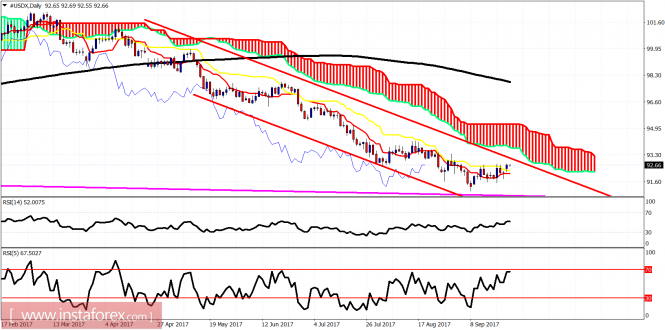
On a weekly basis, the Dollar index is testing the weekly tenkan-sen resistance (red line indicator). Price remains in bearish trend. The rest of this week and the next will be very important for the medium-term move which the index will make. A rejection here will open the way for new lows below 90. Continuation of Dollar strength will open the way for a bigger bounce towards 96.
Ichimoku indicator analysis of USDX for September 22, 2017
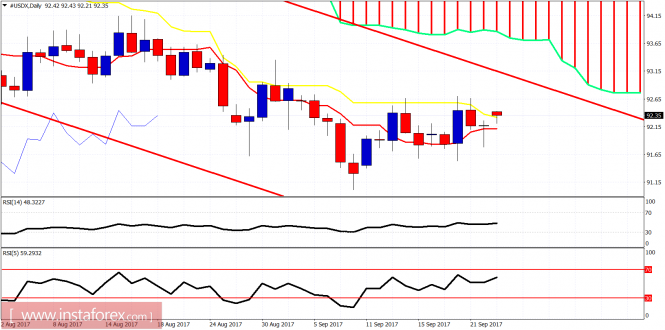
The Dollar index despite making a new short-term high near 92.50, is pulling back as expected by our previous post towards the 92 cloud support. Is this a fake breakout like the last time or a back test that will provide a new bounce?
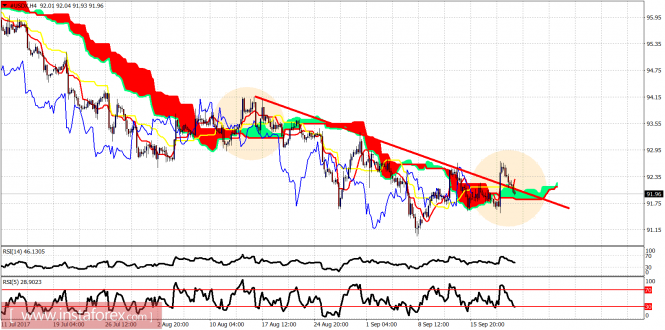
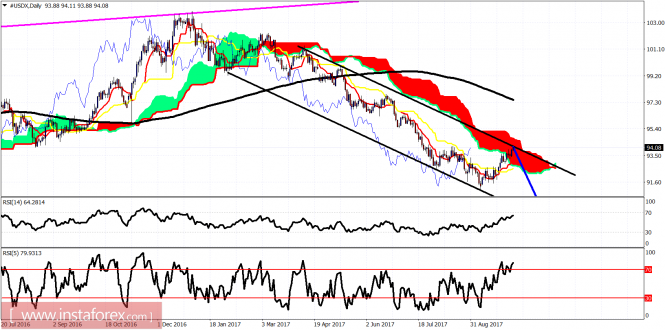
Red line - resistance The Dollar index has broken above the red trend line and is now back testing it. Price has also broken above the 4-hour Kumo (cloud) and is back testing it again. The last time price broke above the 4-hour Kumo we witnessed a false break out and a reversal. Will the bearish trend resume? There are high chances of this happening specially if price breaks below support at 91.60.
On a daily basis, price remains in a bearish long-term channel. Price got rejected yesterday at the kijun-sen (yellow line indicator) and is now trading below the tenkan-sen also. This is a bearish sign. The entire upward correction could be over already. Key support is at 91.50. Break it and we go below 90.
Ichimoku indicator analysis of USDX for September 25, 2017
The Dollar index made a bullish reversal on Friday and held above cloud and trend line support. This price action justifies continuation of the upward bounce as long as price is above 91.80.
Blue line - resistance trend line (broken) The Dollar index broke above the trend line and the 4-hour Kumo (cloud). It pulled back to back test the breakout area and is now bouncing higher. Bulls need to see a higher high above 92.70 to be more confident of the bullish short-term trend. Support is at 92-91.70 area.
Red lines - bearish channel The Dollar index remains inside the daily bearish channel and below the daily Kumo (cloud). Price is now trading above the kijun-sen. A daily close above it will open the way for a move higher towards 93-94.
Analisis Harian Indeks USDX untuk 26 September, 2017
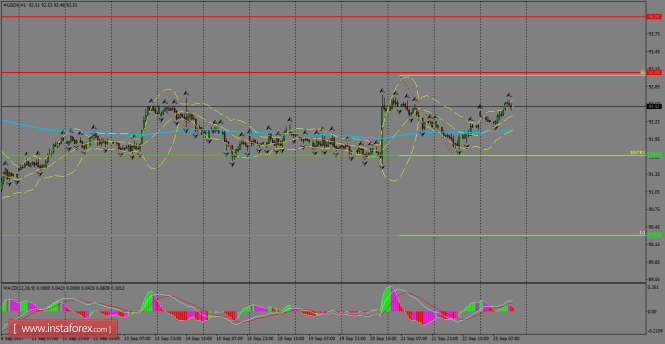
Indeks USDX dilihat masih bertarung dengan aliran penurunan harga untuk mendapatkan semula momentum dalam dagangan jangka pendek. Sasaran seterusnya untuk kenaikan harga diletakkan pada tahap 93.09, di mana akan terdapat peluang untuk menolak Indeks USDX lebih rendah. Walau bagaimanapun, selagi Indeks USDX kekal diniagakan di atas SMA 200 pada carta 1H, ia dijangka akan mencapai tahap tinggi baru, dengan sasaran terletak pada tahap 94.09.
Tahap Rintangan Carta 1H: 93.09 / 94.04 Tahap Sokongan Carta 1H: 91.67 / 90.30 Cadangan Perdagangan untuk Hari Ini: Berdasarkan pada carta 1H, para pedagang disarankan untuk mengambil pesanan menjual (jual) hanya sekiranya Indeks USDX ini berjaya menembusi cartalilin penurunan harga; dengan menetapkan sokongan pada tahap 91.67, take profit pada tahap 90.30 dan stop loss pada tahap 93.04.
Ichimoku indicator analysis of USDX for September 26, 2017
The Dollar index is testing important short-term resistance and previous high at 92.70. Trend is bullish. 93 is an important resistance level.
Red line - resistance (broken) Blue line - previous high horizontal resistance The Dollar index is trying to break above the previous highs at 92.70. Price back tested the cloud support and has reversed higher and is now ready to break to new short-term highs. Important support remains at 91.80.
Red lines - bearish channel On a daily basis we consider that the Dollar index is making a bounce that has first important resistance at 93 and next at 93.70. Both targets can be met but I believe we will first see below 91, before a bigger bounce. Short-term trend is bullish but medium-term trend remains bearish. Breaking below 91.80 will open the way for a move towards 90 or lower.
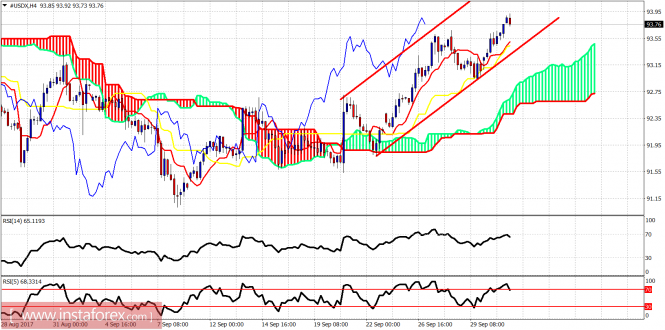
Ichimoku indicator analysis of USDX for September 28, 2017
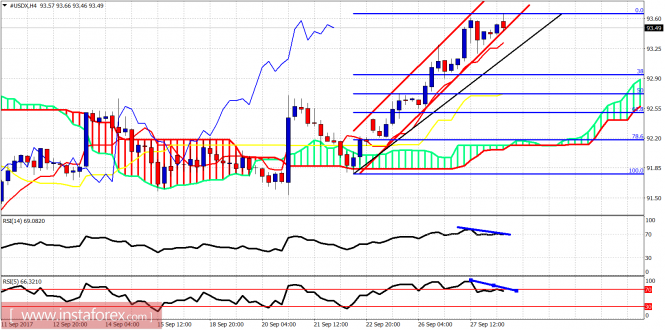
The US dollar index remains in a bullish short-term trend. Price target mentioned in our last analysis has been achieved. There are also signs of bearish divergence providing a warning for dollar bulls.
Red lines - bullish channel The US dollar index is inside the bullish channel. Both RSI indicators are diverging. Price could make a pullback towards 92.95 which is the short-term support and the 38% Fibonacci retracement of the latest rise. Cloud support is at 92.20. As long as we trade above it, the short-term trend is bullish.
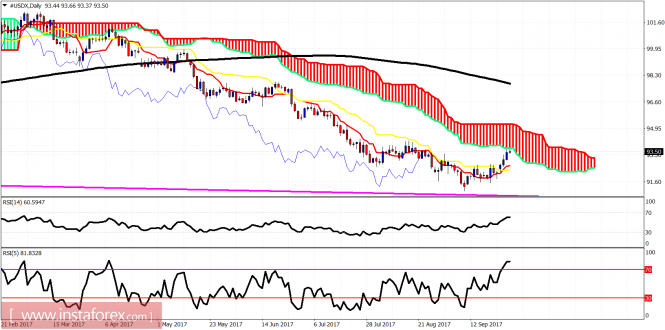
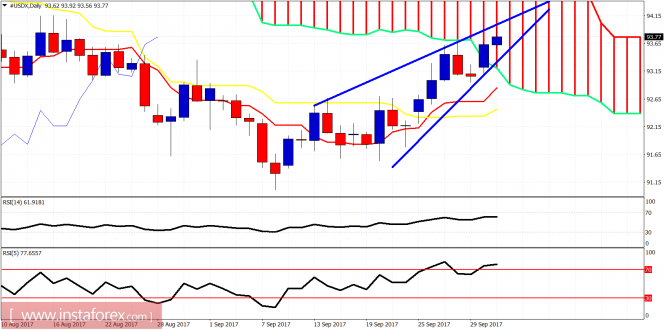
As expected, the dollar index has reached the Ichimoku cloud resistance. Price is above both the tenkan-sen and kijun-sen but below the Kumo (cloud). Trend is bullish in the short-term but in medium-term the trend remains bearish. This bounce is still considered as a short-term correction to the bigger downward trend. I expect price to get rejected and provide new lows towards 90.
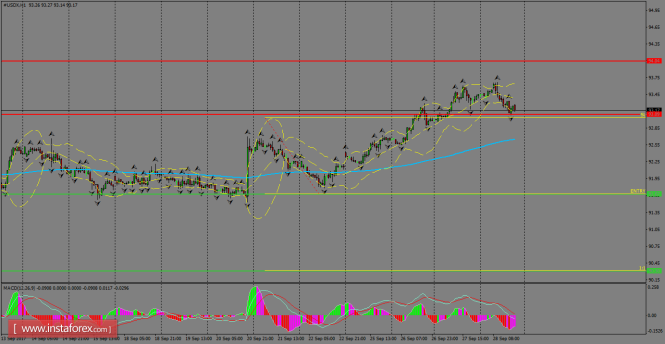
Analisis Harian Indeks USDX USD untuk 29 September, 2017
Indeks USDX kini diniagakan pada tahap yang akan menentukan sama ada harga akan diniagakan dalam aliran menaik atau sebaliknya. Tahap sokongan 93.09 masih kekal sebagai tahap kritikal berhampiran SMA 200, juga sebagai sokongan dinamik. Untuk aliran menaik, sekiranya Indeks USDX berjaya menembusi di atas tahap 94.04, maka adalah diramalkan bahawa aliran menaik akan mengukuh dalam dagangan jangka pendek.
Tahap Rintangan Carta 1H: 93.09 / 94.04 Tahap Sokongan Carta 1H: 91.67 / 90.30 Cadangan Perdagangan untuk Hari Ini: Berdasarkan pada carta 1H, para pedagang disarankan untuk mengambil pesanan menjual (jual) hanya sekiranya Indeks USDX ini berjaya menembusi cartalilin penurunan harga; dengan menetapkan sokongan pada tahap 91.67, take profit pada tahap 90.30 dan stop loss pada tahap 93.04.
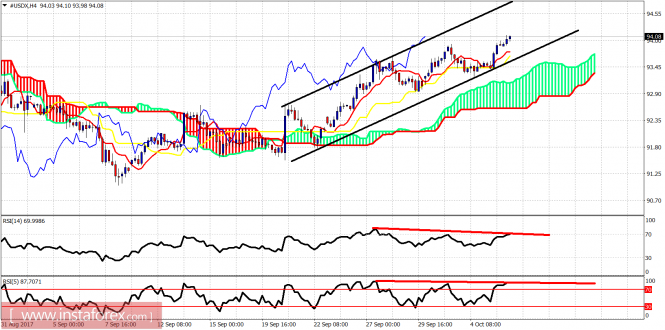
Ichimoku indicator analysis of USDX for October 3, 2017
The Dollar index made a new higher high yesterday 93.92. Price has reached our next target area of 94 as we said when it bounced off the 91.70 support. The price remains in a bullish short-term trend and is now challenging medium-term trend.
Red lines - bullish channel The Dollar index has short-term support at 93.50. Resistance is at 94.10-94.20. The trend remains bullish as long as the price is above 92.50. A break below 92.50 will confirm trend reversal back to bearish.
Blue lines - ascending wedge The Dollar index has entered the daily Kumo (cloud) changing daily trend to neutral according to Ichimoku cloud terms. The new highs, however, have not been followed by new highs in the RSI giving a divergence signal. This is the first important warning and message of caution to Dollar bulls. Wedge support is at 93.20.
The Dollar index made a new high yesterday but the bearish divergence is still there providing a warning. Today, we have the Non-Farm payrolls announcement by the US and the market is expected to have increased volatility.
Black lines - bullish channel Price is trading inside the corrected bullish channel. Price made a new high but the RSI is diverging for the 3rd time. Could Dollar top be in today? Very high chances of this happening. Support is at 93.40. Resistance is at 94.20-94.70.
Black lines - bearish channel The Dollar index is trading inside the longer-term bearish channel and is now testing its upper boundary together with the Ichimoku cloud resistance. I expect the Dollar index to get rejected today and reverse to new lows over the coming weeks.