Ichimoku indicator analysis of USDX for October 9, 2017
The Dollar index is showing reversal signs of the daily Ichimoku cloud resistance at 94. Price remains inside the bearish channel however we do not have a confirmation that a new downward move has started.
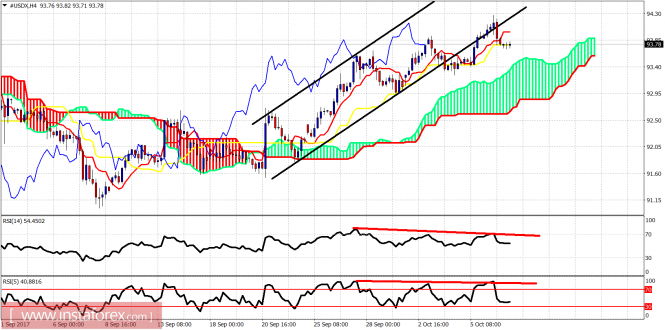
Black lines - bullish channel Red lines - bearish divergence signs The Dollar index continues to trade above the 4-hour Kumo (cloud) support. Trend remains bullish as price is making higher highs and higher lows. However there are several warning signs justifying a full-scale reversal. Both RSI are diverging. Price has broken below the bullish channel. Price is at important resistance.
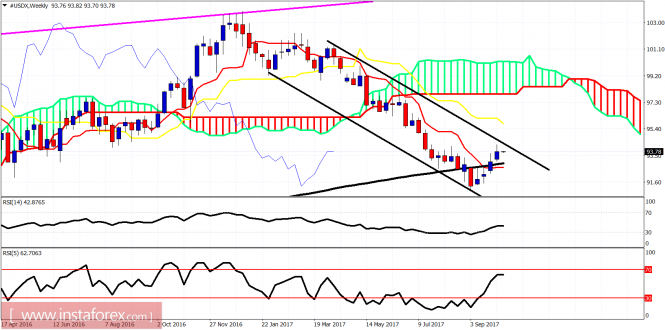
Black lines - bearish channel On a weekly basis price remains inside the bearish channel. Price has reached the upper channel boundary and is showing signs of rejection. However only a break below 93 would confirm the bigger reversal in prices. My view is that we will see that reversal materialize.
Ichimoku indicator analysis of USDX for October 11, 2017
The Dollar index made new lows yesterday interrupting the recent sequence of higher highs and higher lows that started back at 91. Short-term trend is now neutral as price has entered inside the 4-hour Kumo.
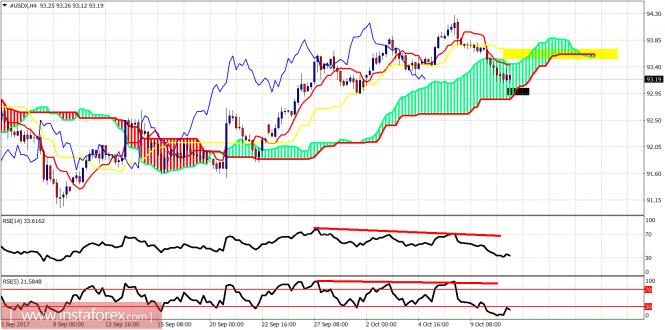
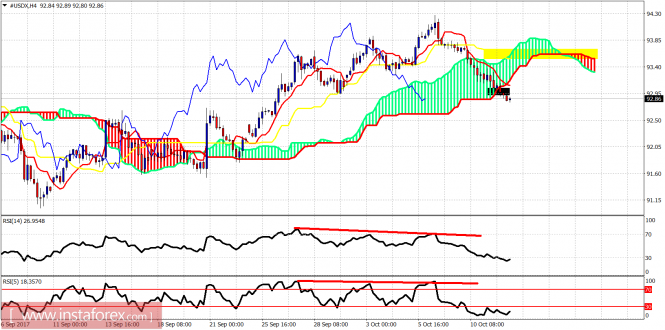
Yellow rectangle - resistance area Black rectangle - support area In the 4-hour chart the Dollar index is in neutral trend as it is inside the Kumo (cloud). Next support level is at 93-92.90. Resistance is at 93.50-93.70.
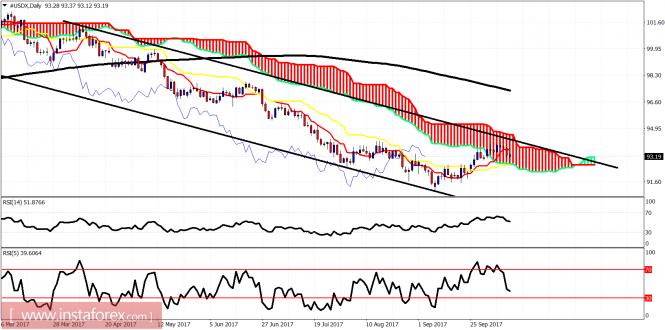
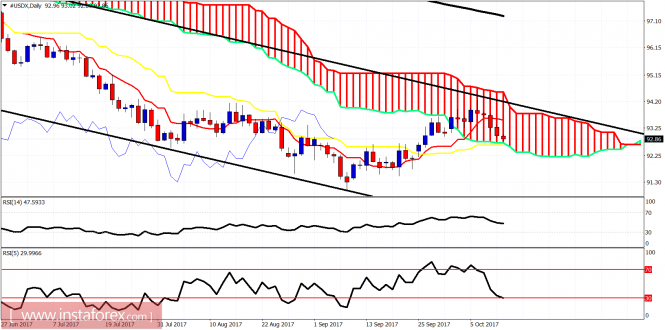
Black lines - bearish channel On a daily basis, we have the first bearish confirmation as price has closed below the tenkan-sen (red line indicator). Still trading inside the bearish channel and being rejected at the upper channel boundary is a bearish sign. Daily support is at 92.80. Closing below it will be a very bearish signal implying new lows ahead.
Ichimoku indicator analysis of USDX for October 12, 2017
The Dollar index as expected has made a full-scale reversal since last Friday when we expected for the Dollar to top. Price has broken through cloud support in the short term and is making lower lows and lower highs. Trend is bearish.
Black rectangle - support (broken) Yellow rectangle - resistance The Dollar index has broken below the Ichimoku cloud in the 4-hour chart. Price has moved lower as expected when we were trading around 94. Price justifies a bounce soon but it is important to see if this bounce makes a lower high and gets rejected by the Kumo (cloud) resistance.
Black lines - bearish channel The rejection at the upper channel boundary is unfolding. Price has now reached the lower cloud boundary and the kijun-sen indicator (yellow line). This is important support area for the Dollar index. Price could bounce from this area. As long as we are trading inside the bearish channel, I will continue to be bearish expecting new lows in the Dollar index.
Ichimoku indicator analysis of USDX for October 13, 2017
The Dollar index has broken below 93 and this is a bearish sign. Price is now trading below the Ichimoku cloud. We could see a bounce to back test the lower boundary of the clouds, but I would expect price to get rejected.
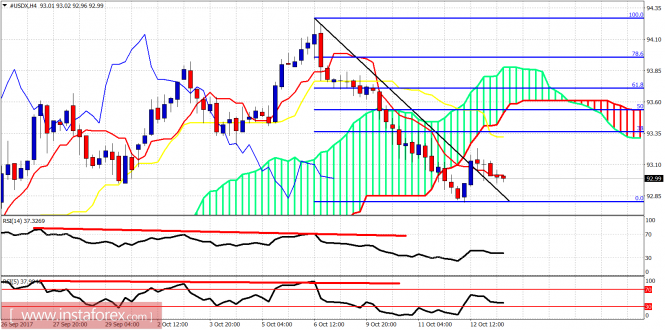
The Dollar index is trading below the 4-hour cloud. Price could bounce towards 93.30-93.40 where the 38% Fibonacci retracement is found. Short-term support is at 92.80. Resistance at 93.35.
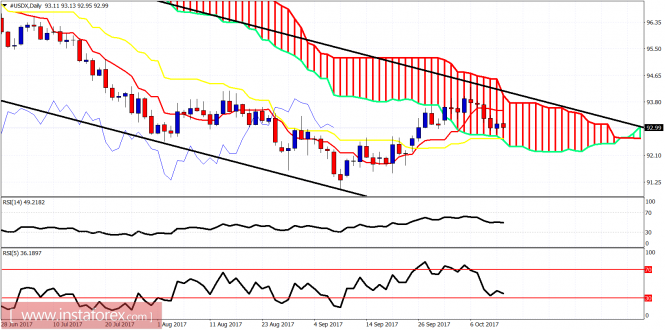
Black lines - bearish channel The Dollar index remains inside the bearish channel and price has now broken below the tenkan-sen (Red line indicator). Next important support is at 92.60 where the lower cloud boundary is found together with the kijun-sen (yellow line indicator). Breaking below that level will confirm that we have started the next downward move to new lows.
Analisis Harian Indeks USDX untuk 20 Oktober, 2017
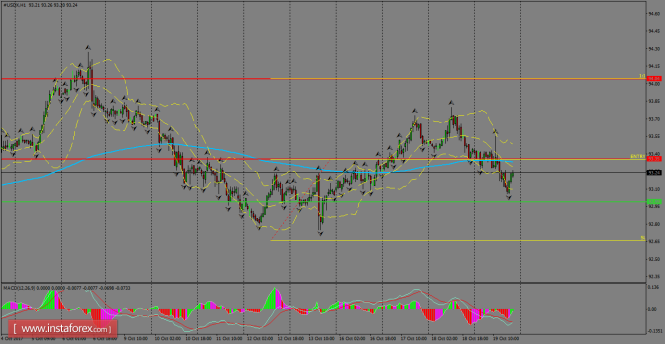
Indeks USDX berjaya ditarik semula daripada tahap tinggi 18 Oktober dan harga sekali lagi mengukuh di bawah SMA 200 pada carta 1H. Sokongan paling hampit dilihat terletak pada tahap psikologi 93.00. Sebaik sahaja harga berjaya menembusi di bawah kawasan harga tersebut, tahap rendah 13 Oktober akan diuji, manakala lantunan semula harga pada tahap semasa berpotensi untuk mendorong Indeks USDX untuk mencapai ke tahap 94.04
Tahap Rintangan Carta 1H: 93.35 / 94.58 Tahap Sokongan Carta 1H: 93.00 / 91.67 Cadangan Perdagangan untuk Hari Ini: Berdasarkan pada carta 1H, para pedagang disarankan untuk mengambil pesanan membeli (beli) hanya sekiranya Indeks USDX ini berjaya menembusi cartalilin kenaikkan harga; dengan menetapkan rintangan pada tahap 93.35, Take profit di tahap 94.58 dan stop loss pada tahap 92.66.
Ichimoku indicator analysis of USDX for October 20, 2017
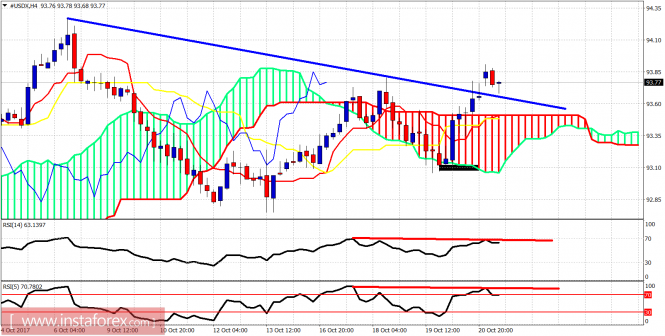
The Dollar index reached the short-term 93 support level and bounces higher now. Price is in a short-term neutral trend as the index is mainly moving sideways between 94-93 levels.
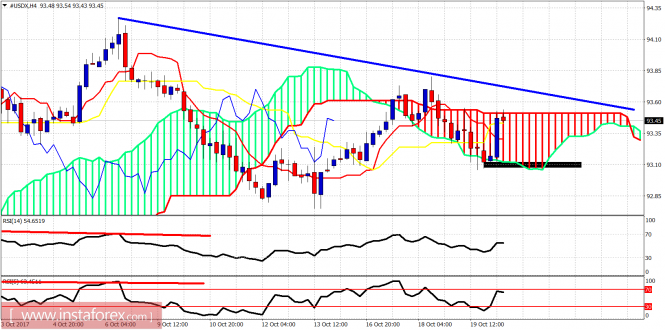
Blue line - resistance trend line Rectangle - support The Dollar index has reached the upper boundary of the 4-hour Kumo (cloud). 93.50 is the boundary resistance and the rise has stopped right there. Support is at the black rectangle. Breaking below it will open the way for a move towards 90 as price will be making lower lows and lower highs.
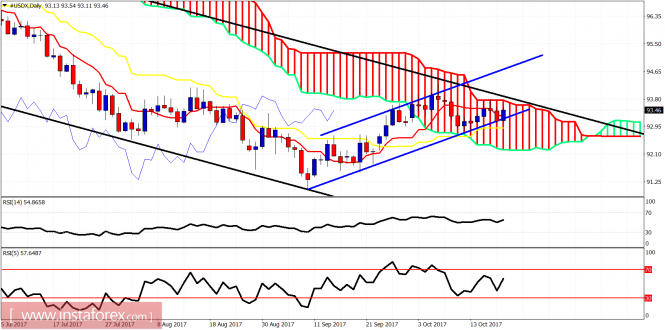
Black lines - bearish channel Blue lines - bullish channel Yesterday, the Dollar index tested the lower channel boundary of the bullish channel. Support held and price bounced but it remains inside the cloud and below the upper boundary of the long-term bearish channel. Important resistance is at 93.90 and important support at 93.10. Whichever level breaks first, a strong move is expected to follow.
Ichimoku indicator analysis of USDX for October 23, 2017
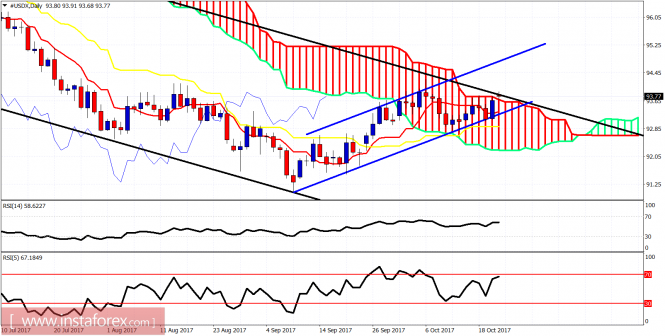
The Dollar index has broken above the short-term trend line resistance and back above the 4 hour Ichimoku cloud. Short-term trend is bullish. The price has held above 93 on any attempt so far to break it so we can't ignore the bullish support the index has.
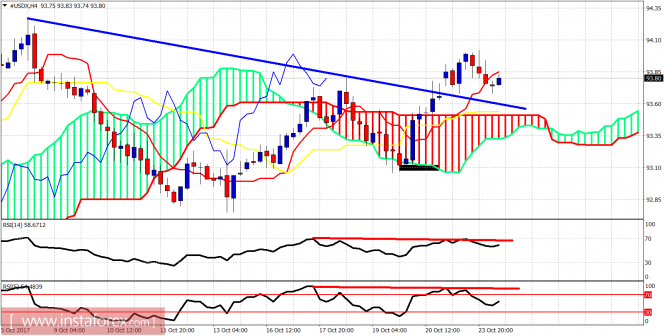
Blue line - trend line resistance (broken) The Dollar index is making new higher highs. The price is above the 4 hour Kumo (cloud) and the blue trend line resistance. Support is at 93.50. Bears need to first break this level in order to show some sign of Dollar weakness. The most important level for bulls and bears is the 93 level. As long as we are above it, bulls remain in control.
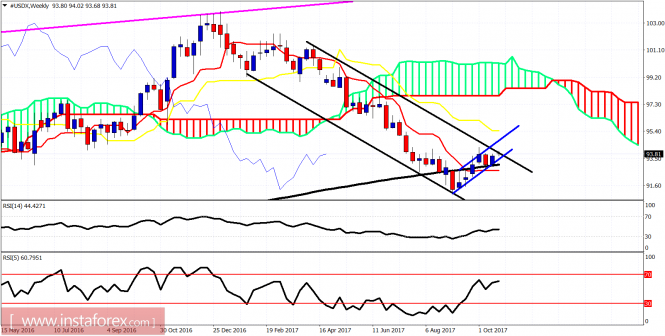
Blue lines - bullish channel Black lines - bearish channel The Dollar index remains inside the bullish channel and is trying to break above the bearish longer-term channel and the daily cloud resistance. Support is at 93.30. Resistance is at 94.
Ichimoku indicator analysis of USDX for October 24, 2017
The Dollar index remains in a bullish trend. Yesterday after reaching new highs at 94 area, price pulled back towards the broken trend line area for a backtest. A bounce off this trend line will increase the bullish scenario strength.
Blue line - resistance (broken) The Dollar index is trading above the Ichimoku cloud in the 4-hour chart. The trend is bullish as the price is also making higher highs and higher lows. Support is at 93.50 while resistance is at the recent highs at 94. There are some warning divergence signs in the 4-hour chart but as long as the price is above 93, bulls remain in control.
Black lines - bearish channel Blue lines -bullish channel The Dollar index remains inside the bearish medium-term and bullish short-term channel. Key levels to watch are at 93.40 and at 94. Price is trading above the tenkan-sen (Red line indicator) and below the kijun-sen (yellow line indicator). The Dollar index could continue higher towards 95 as long as the price is above 93.50-93. If this level is broken, we are starting the next leg down towards 90.
Analisis Harian Indeks USDX untuk 25 Oktober, 2017
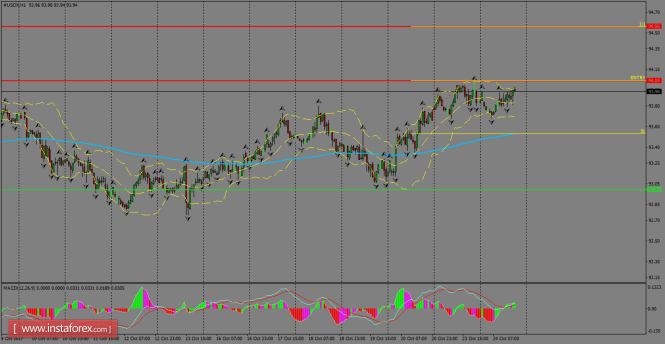
Indeks USDX masih disokong oleh tahap rintangan 94.00 dan ia dilihat sedang berusaha untuk mendapatkan momentum bagi membolehkan harga meneruskan dagangan dalam aliran menaik. Harga masih diniagakan di atas SMA 200 pada carta 1H dan sekiranya tahap 94.00 ini berjaya ditembusi, maka indeks USDX ini berpotensi untuk mencecah ke tahap 94.56. Indikator MACD kekal memihak kepada aliran menaik, selagi harga kekal berada di wilayah positif.
Tahap Rintangan Carta 1H: 94.04 / 94.56 Tahap Sokongan Carta 1H: 93.00 / 91.67 Cadangan Perdagangan untuk Hari Ini: Berdasarkan pada carta 1H, para pedagang disarankan untuk mengambil pesanan membeli (beli) hanya sekiranya Indeks USDX ini berjaya menembusi cartalilin kenaikkan harga; dengan menetapkan rintangan pada tahap 94.04, Take profit di tahap 94.56 dan stop loss pada tahap 93.52.
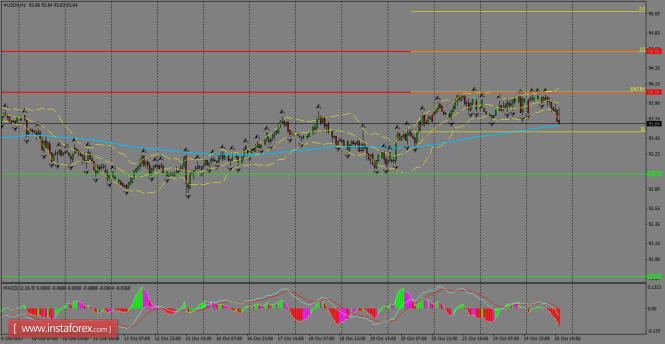
Analisis Harian Indeks USDX untuk 26 Oktober, 2017
Indeks USDX ini telah menyaksikan penarikan semula harga di bawah tahap rintangan kritikal 94.04 dan kini, harga sedang menguji SMA 200 pada carta 1H. Tinjauan dagangan untuk Dolar AS kekal menaik walaupun terdapat pergerakkan harga pada baru-baru ini, walau bagaimanapun, sekiranya indeks USDX berjaya menembusi tahap sokongan 93.00. Indikator MACD memihak kepada aliran penurunan harga setakat ini.
Tahap Rintangan Carta 1H: 94.04 / 94.56 Tahap Sokongan Carta 1H: 93.00 / 91.67 Cadangan Perdagangan untuk Hari Ini: Berdasarkan pada carta 1H, para pedagang disarankan untuk mengambil pesanan membeli (beli) hanya sekiranya Indeks USDX ini berjaya menembusi cartalilin kenaikkan harga; dengan menetapkan rintangan pada tahap 94.04, Take profit di tahap 94.56 dan stop loss pada tahap 93.52.