Overview of #USDX (US dollar index) with a forecast for August 21
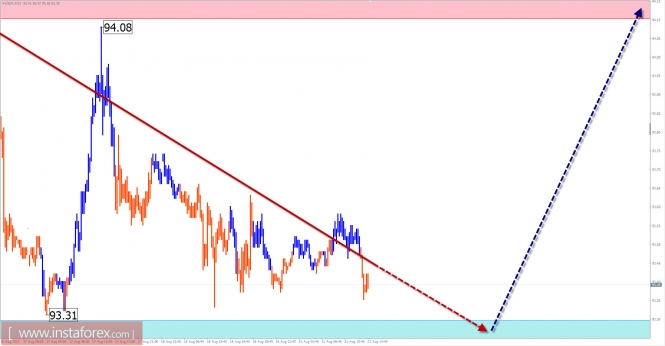
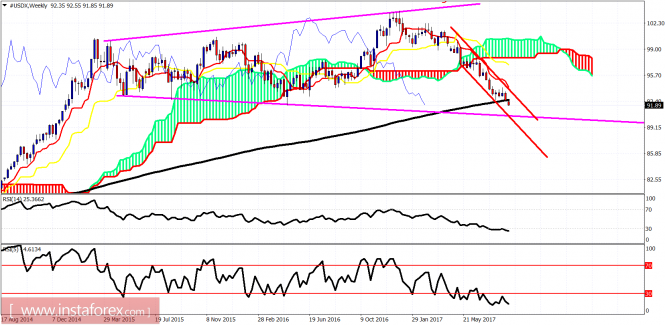
On the weekly scale of the tool, from March 2015, you can track the corrective bearish structure, which looks like a stretched plane. The downward wave that dominates the entire current year on the dollar chart has reached the upper limit of the potential reversal zone, where there are several important levels of support. The structure of the wave does not show completeness, which indicates a temporary nature of the stoppage. Nevertheless, taking into account the overall wave sweep, the rise may take a considerable period of time. The first control site is in the local district last week. An optimistic variant of the scenario implies a rise in the rate to the values of June. In the coming sessions, the completion of the current "outset" is expected and a repeated attempt to change the direction of traffic. The growth of quotations within a day is not expected to exceed the limits of resistance. The boundaries of the resistance zone: - 94.10 / 20 The boundaries of the support zone: - 93.30 / 20
Explanations to the figures: For simplified wave analysis, a simple type of wave is used that combines 3 parts (A; B; C). Of such waves, all kinds of correction are composed and most of the impulses. On each considered time-frame the last, incomplete wave is analyzed. The zones marked on the graphs are indicated by the calculation areas in which the probability of a change in the direction of motion is significantly increased. Arrows indicate the wave counting according to the technique used by the author. The solid background of the arrows indicates the structure formed, the dotted line indicates the expected wave motion. Note: The wave algorithm does not take into account the duration of the tool movements in time. The forecast is not a trading signal! To conduct a transaction, you need to confirm the signals used by your trading systems.
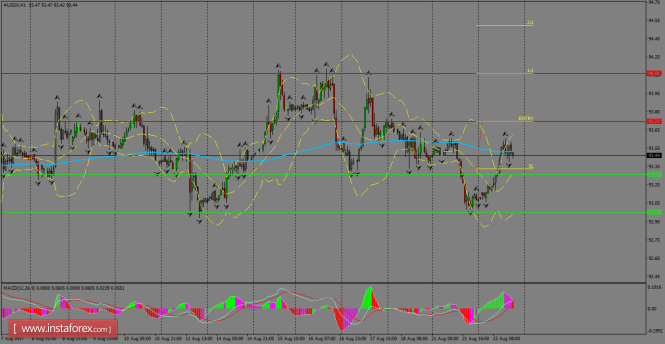
The index recovered from Monday's low and it's challenging now the 200 SMA at H1 chart. The structure remains in sideways and there is no a clear path to follow in the short-term, other than a breakout of the range. If we witness a break above 93.72, further gains are expected to take place towards 94.11.
H1 chart's resistance levels: 93.72 / 94.11 H1 chart's support levels: 93.28 / 92.97 Trading recommendations for today: Based on the H1 chart, place buy (long) orders only if the USD Index breaks with a bullish candlestick; the resistance level is at 93.72, take profit is at 94.11 and stop loss is at 93.33.
Ichimoku indicator analysis of USDX for August 23, 2017
Gold price has pulled back again towards $1,*** support yesterday but it did not break it. Price remains trapped inside a short-term trading range of $1,295-$1,***. We could push lower towards $1,275 but overall trend remains bullish and any pullback is seen as buying opportunity.
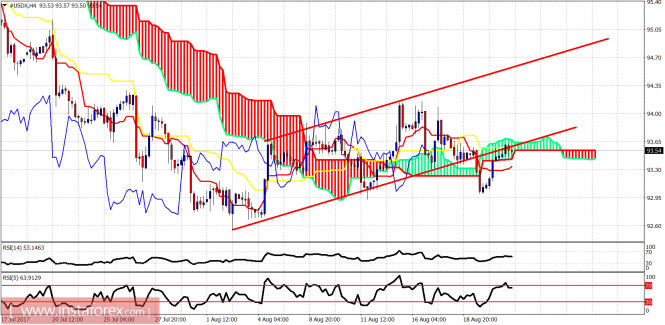
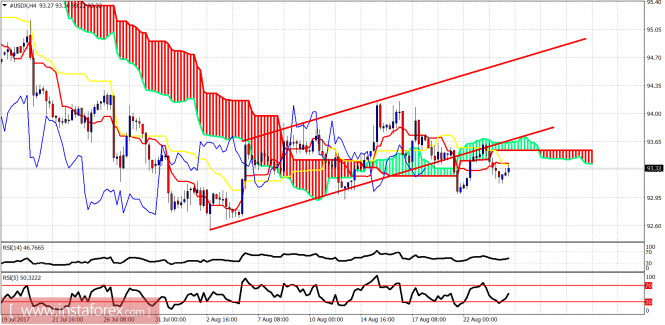
Red lines - bullish channel (broken) The dollar index is trying to move back above the 4 hour Kumo and inside the bullish channel. This bounce is corrective and we should expect a rejection soon to turn the price lower. The support is found at 93.30 and resistance lies at 93.70.
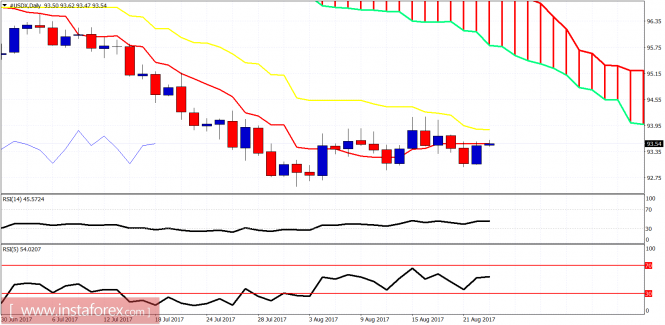
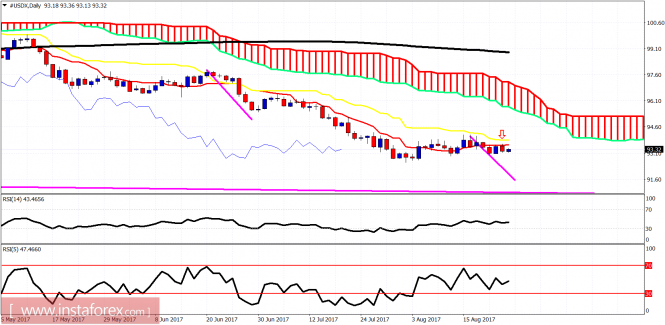
On a daily basis the dollar index is trying to break above the tenkan-sen. We are in the daily resistance area. I expect a rejection here. The dollar index is likely to break towards 91 over the coming weeks.
Ichimoku indicator analysis of USDX for August 24, 2017
The US dollar index got rejected as expected after back testing the broken channel and cloud resistance. I expect the dollar index to push lower towards 91.60 over the coming weeks.
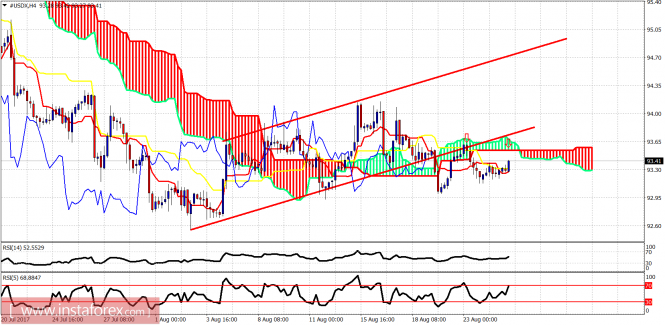
Red lines - bearish channel The dollar index is trading below the 4 hour Kumo. Yesterday we back tested the broken channel and the Kumo cloud. The rejection is a bearish sign. Support is at 93.10 and the next one at 92.90. Resistance is found at 93.40 and the next one at 93.55.
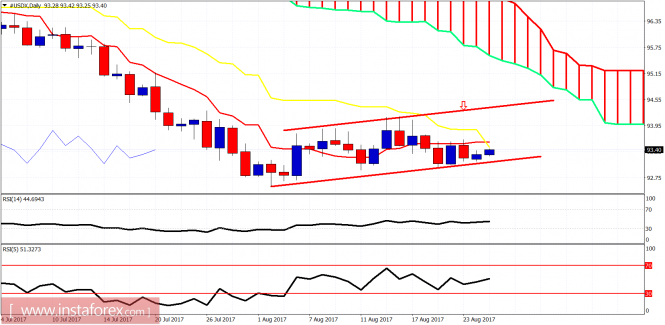
The daily candles in the dollar index suggest a rejection and a push lower towards 91.60. A move of similar size with the first part of the decline from 97.60 is expected. Trend is clearly bearish in the daily chart with no reversal signs.
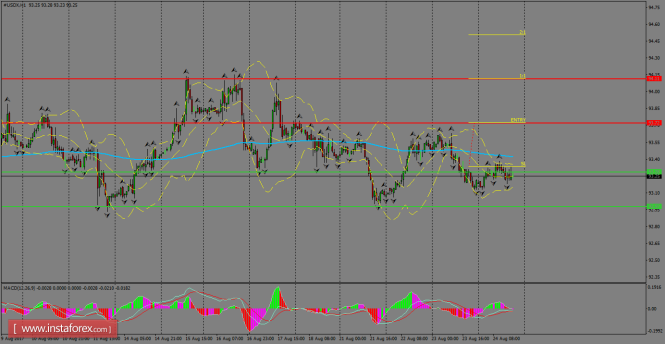
Ichimoku indicator analysis of USDX for August 25, 2017
The Dollar index continues to trade sideways. Technically we have a breakdown of short-term support that should eventually bring price towards 91.60. Short-term trend is neutral. Medium-term trend is bearish.
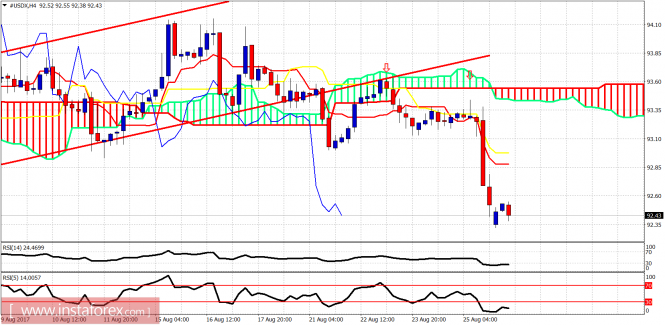
Red lines -bullish channel (broken) The Dollar index is heading towards the Kumo (cloud) resistance in the 4-hour chart at 93.60. If price breaks this resistance we should expect the lower channel boundary at 93.70-93.80 to be tested. At these resistance levels, short-term traders could try to open short positions as risk reward favors the bearish side.
Red lines - trading range On a daily basis we see the kijun-sen (yellow line indicator) cross below the tenkan-sen (red line indicator). Although this would normally be a bullish sign, this is the result of the sideways movement of prices. Moreover, a cross below the cloud diminishes the strength of a bullish signal. I continue to expect that prices will break down towards 91.50. For this scenario to be confirmed we need to see new weekly lows.
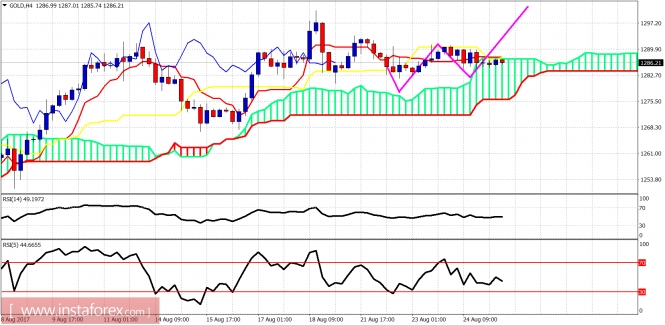
Ichimoku indicator analysis of gold for August 25, 2017
Gold price continues to move sideways. It is trapped between $1,295 and $1,***. The trend is neutral in the short term but bullish overall. We continue to see $1,320 as a short-term target.
Magenta line - expected path I expect Gold price to respect support and start a new upward move soon. Short-term support lies at $1,*** and the resistance is found at $1,295. Short-term target is minimum at $1,320. Breaking below $1,275 will put short-term trend in danger and will likely push the price towards $1,250.
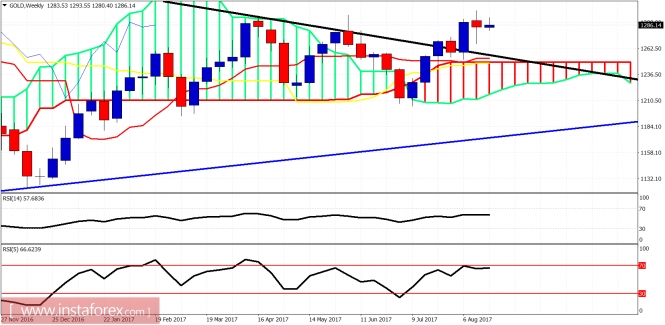
Black line - long-term resistance (broken) Blue line - long-term support Gold price has broken out and above the black trend line resistance and the Ichimoku cloud. We could see another back test of the breakout area at $1,250 but overall trend is bullish and we are targeting above $1,400 over the coming months.
Jackson Hole's event helped to add pressure on the US Dollar and currently is trading below the 93.00 handle. After several days trapped in a range, the index looks like it's riding a nice bearish consolidation below the 200 SMA at H1 chart. If we witness a breakout below 92.51, we can expect further weakness towards the 92.09 level.
H1 chart's resistance levels: 93.09 / 93.72 H1 chart's support levels: 92.51 / 92.09 Trading recommendations for today: Based on the H1 chart, place sell (short) orders only if the USD Index breaks with a bearish candlestick; the support level is at 92.51, take profit is at 92.09 and stop loss is at 92.91.
Ichimoku indicator analysis of USDX for August 28, 2017
The Dollar index made the second rejection as expected and is breaking to new lows. Target remains at 91.60 and trend remains bearish.
Red lines - bullish channel (broken) The Dollar index is in a bearish confirmed trend since the channel and the cloud support failed to hold price. We mentioned that and even after the back test of the cloud and the channel we remained bearish. Support is now at 91.80-91.60 where the short-term target is found.
Short-term resistance is at 92.80. The Dollar index made a new monthly low but both RSI indicators did not. A move above 93.30 will confirm trend reversal and a push towards 94-95 will be expected. Dollar bears need to be very cautious. This divergence is a warning, not a confirmed reversal. The trend remains bearish.
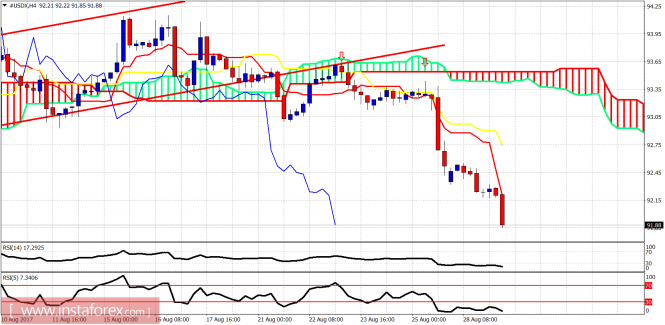
Ichimoku indicator analysis of USDX for August 29, 2017
The Dollar as expected is heading towards 91.60 which was our target for the last couple of weeks. We posted an analysis right on time when the bullish channel and the consolidation were broken downwards and a new sell signal was given. Since then we target 91.60.
The price is below both the tenkan- and kijun-sen. The short-term trend is clearly bearish, as the price is making lower lows and lower highs. Oscillators are making new lows and there is no sign of a divergence yet. Resistance is at 92.30 and next at 92.75.
Red lines - bearish channel Purple lines - expanding triangle pattern The Dollar index remains in a bearish trend confirmed once the weekly candles broke below the weekly Kumo. The price has now broken below the 200 MA and is heading towards the lower boundary of the expanding triangle pattern. This target is around 90.70-90, depending on the time it will take to move towards the purple line. Once we get there, we see how strong of a support and pattern this will be. Weekly resistance is at 93.50. Breaking above it will start a strong bounce that could push the index back towards 95-96.
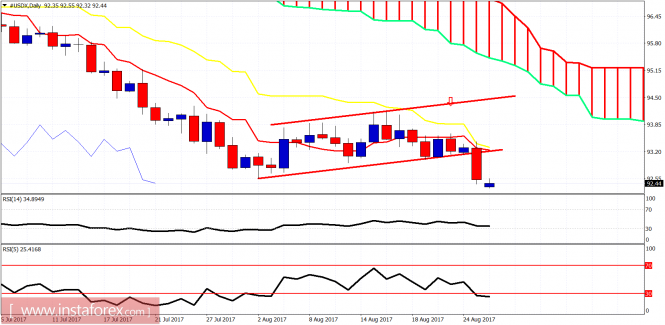
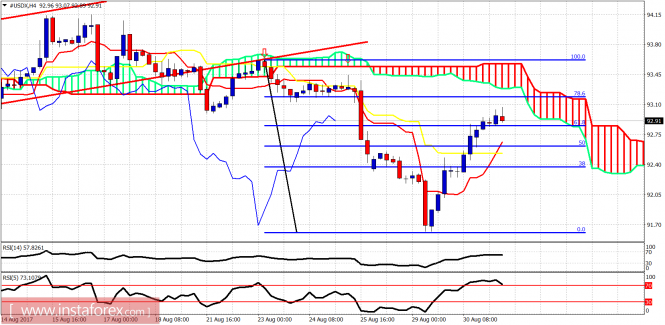
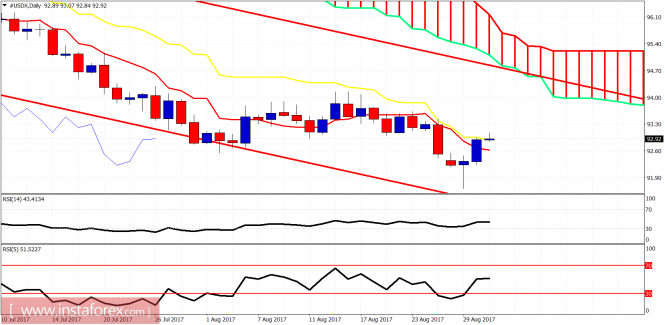
Ichimoku indicator analysis of USDX for August 31, 2017
The Dollar index has broken through the short-term resistance at 92.50 and as expected is heading towards 93-93.30. Short-term trend is still bearish and this bounce is considered just a correction and not a bigger reversal to the upside.
The Dollar index is trading above both the tenkan- and kijun-sen indicators but below the 4-hour Kumo. As long as price is below 93.70, trend is bearish in Ichimoku terms. Resistance is at 93.30. Also at 93.20 we have the 78.6% Fibonacci retracement resistance. Support is at 92.55.
Red lines - bearish channel On the daily basis, price remains inside the bearish channel well below the daily Kumo (cloud). Price is trying to break above the daily kijun-sen (yellow line indicator). A rejection here is very possible. This would imply new lows ahead below 91.62. However a move above the kijun-sen will open the way for a bigger bounce towards channel and Kumo resistance at 94.