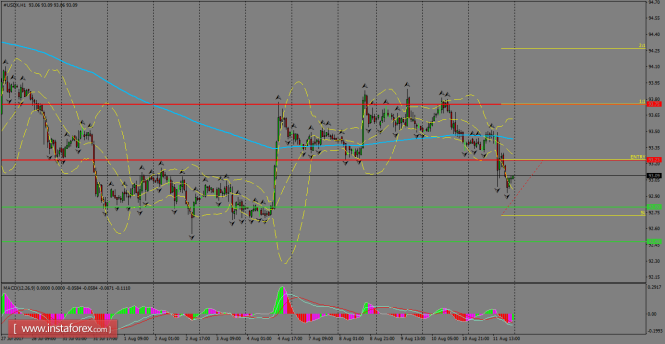
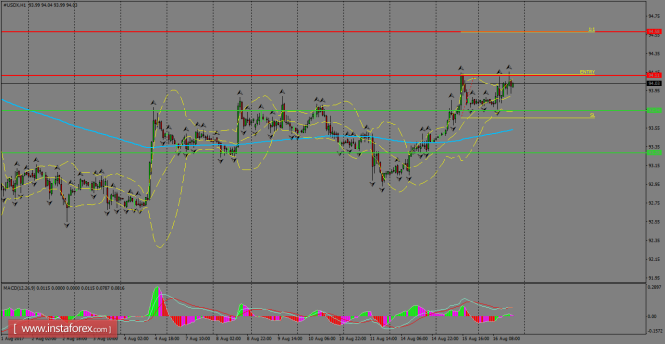
USDX was smashed during Friday's session amid geopolitical concerns and Fed speakers' dovish rhetoric. So far, the index has stayed above the support level of 92.80 and it's still looking to ride the bullish structure in the short-term. If it manages to break above 93.23, then we might expect a rally continuation towards 93.75.
H1 chart's resistance levels: 93.23 / 93.75 H1 chart's support levels: 92.80 / 92.48 Trading recommendations for today: Based on the H1 chart, place buy (long) orders only if the USD index breaks a bullish candlestick; the resistance level is at 93.23, take profit is at 93.75 and stop loss is at 92.72.
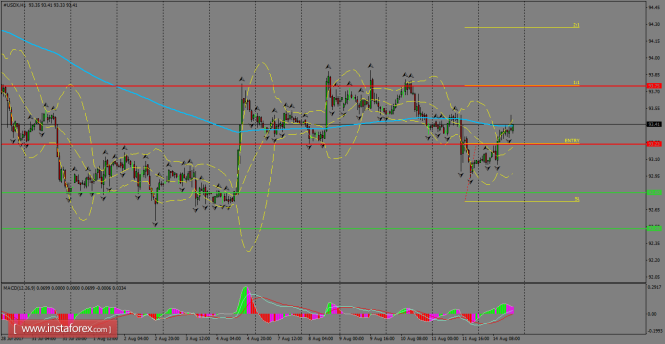
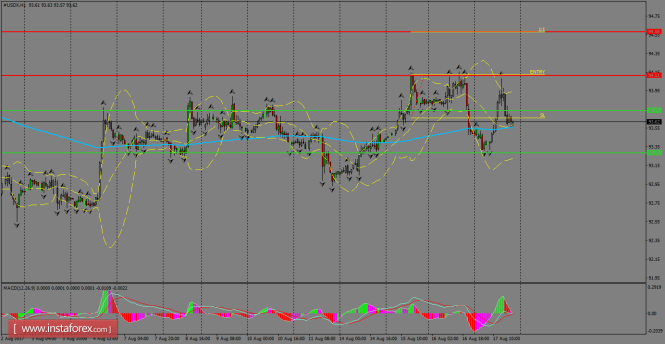
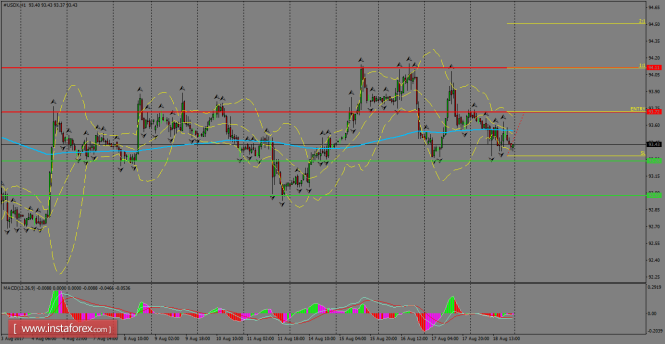
The index had limited price action during Monday's session, as thin liquidity dominated the markets, despite some sharp movements early in the American session. The greenback is now being capped by the dynamic resistance offered by the 200 SMA at H1 chart and one could expect further pullbacks. However, if it manages to consolidate above that moving average, the next target should be the 93.75 level.
H1 chart's resistance levels: 93.23 / 93.75 H1 chart's support levels: 92.80 / 92.48 Trading recommendations for today: Based on the H1 chart, place buy (long) orders only if the USD Index breaks with a bullish candlestick; the resistance level is at 93.23, take profit is at 93.75 and stop loss is at 92.72.
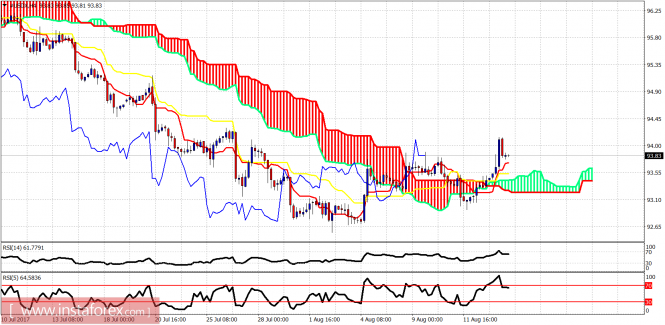
Ichimoku indicator analysis of USDX for August 16, 2017
The Dollar index continues its expected bounce on a larger degree as we have expected for the past two weeks after making a major importance low two weeks ago. The trend is bullish as long as we hold above August lows. I expect the upside to continue for a couple of index points higher.
In the short-term price has pushed again above the Ichimoku cloud and this confirms our bullish short-term view. Support is at 93.55-93.10 and resistance at 95-96. I expect this upward move to continue for at least one more week.
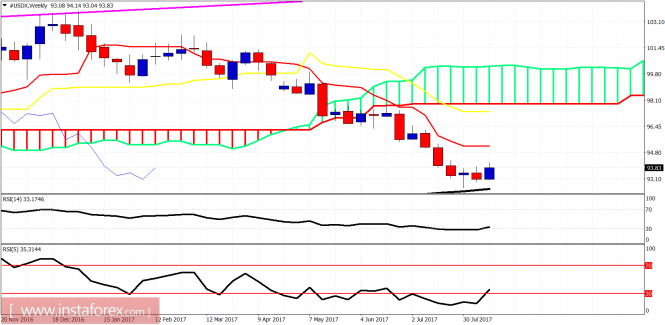
On a weekly basis, we observe the early stages of a bullish reversal. I expect the price to move at least towards the red line indicator (tenkan-sen). A break above it will open the way for a back test of the weekly Kumo (cloud). This would be the main scenario.
Strong growth in retail sales in July contributed to the return of demand for the dollar. According to a U.S. Census Bureau report released on Tuesday, sales rose 0.6% in July, well above the 0.4% forecast. Moreover, the June report was also revised upwards, and instead of a 0.2% decrease, we now need to start from an increase of 0.3%. The evidence suggests that the weakness of the consumer sector is not as deep as previously thought, and revenue growth is sufficient to ensure sustainable demand. At the same time, maintaining a high level of consumer demand is also ensured by the fast growth of household debt. According to the Federal Reserve Bank of New York, the total debt of households in the second quarter was 12.84 trillion dollars, which is 552 billion more than a year ago. These data indicate that citizens are waiting for positive changes that will improve their economic condition in the future, and are ready to spend more, depending on the growth of incomes. At the same time, it is not possible to postpone the reforms because the increase in household debt, according to World Bank research, has a positive effect only in the outlook for the year, after which the reverse dependence is included. An increase in household debt by 1% relative to the GDP leads to a decrease of 0.1% in the long-term outlook. The retail data was not the only positive signal. Import prices rose by 1.5%, which was better than forecasts, while the growth of export prices was 0.1%. The Federal Reserve Bank of New York reported an increase in business activity in the manufacturing sector to 24.2p, which is a three-year high and well above the projected 10.0%.
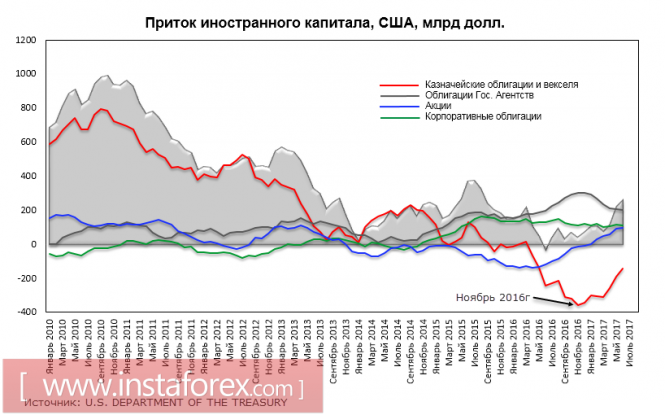
Investors continue to wait for the start of the reform program announced by Trump during the pre-election race. The report of the Treasury on the inflow of foreign capital published yesterday showed that investors are leaving Treasuries. The lowest level was reached in November 2016, after which the demand for bonds is growing every month and should again become positive in the near future. The dynamics of the return of foreign investors in the debt securities of the US government and the stock market indicate a significant potential for confidence in the expected reforms. Investors are not at all worried regarding the poor collection of taxes, or the devastation of the Treasury's cash desk, nor of Trump's first setbacks in confronting the Congress on medical reform. The expectation of economic growth, asset returns amid rising Fed rates and tax cuts outweigh any concerns.
Strong data releases on Tuesday led to a revision of the forecasts for the interest rate hikes. A few days ago, investors, according to CME, saw a 35.9% probability of another rate increase this year. Then yesterday it rose to 49.5% - a very strong growth in a short period. The volatility is caused, from one side, by the wide spread of estimates in the current situation and of the real state of the U.S. economy. And also, on the other hand, reflects the desire of investors to see a positive program. The Federal Reserve Bank of Atlanta raised its forecast for US GDP by 3Q to 3.7% on Tuesday, supporting the trend on its expectations for positive changes. Thus, a number of indirect data indicates a strong deferred demand for the dollar, and the publication of the Federal Reserve's minutes for the July meeting again causes the increased interest. Despite the fact that the meeting was "passing" and was not accompanied by a change in macroeconomic forecasts or a detailed press conference, it is the last before the key FOMC meeting on September 14 and should contain benchmarks for rates and a reduction in the balance sheet. On Monday, the US president ordered an investigation into China against intellectual property infringement cases. This move was not unexpected, as preparation for it was conducted for a long time.However, this is the first time in many years a real possibility was expressed to use not only Article 301 of the 1974 Merchant Act to unilaterally set barriers for export goods, but also the Law "On International Emergency Economic Powers" from 1977, which gives the US president the right to monitor any economic operations in the event of a threat to national security. The beginning of active actions will contribute to increased tension and will cause the long-awaited demand for the dollar. Months of correction, which began in January, is nearing its completion.
Indeks USDX dilihat sedang berusaha untuk menembusi di atas tahap 94.11 dalam usaha untuk memperkukuhkan kecenderungan kenaikkan harga. Walau bagaimanapun, rintangan ini mengehadkan aliran menaik dan sekiranya Indeks USDX ditarik semula ke tahap harga semasa, maka SMA 200 pada carta 1H berkemungkinan akan diuji semula, membuka ruang untuk harga mencapai tahap sokongan 93.28 dalam senario penurunan harga. Indikator MACD kini memasuki wilayah neutral, mendorong pergerakkan mendatar.
Tahap Rintangan Carta 1H: 94.11 / 94.58 Tahap Sokongan Carta 1H: 93.74 / 93.28 Cadangan Perdagangan untuk Hari Ini: Berdasarkan pada carta 1H, para pedagang disarankan untuk mengambil pesanan membeli (beli) hanya sekiranya Indeks USDX ini berjaya menembusi cartalilin kenaikkan harga; dengan menetapkan rintangan pada tahap 94.11, Take profit di tahap 94.58 dan stop loss pada tahap 93.66.
USDX had a bullish session during Thursday in an overall view, but during American session, it erased some gains after Barcelona's terrorist attack, which helps to boost the demand for safe-haven assets across the board. To the upside, the resistance level is still placed at 94.11 and if we see a break above it, we can expect a rally towards 94.58.
H1 chart's resistance levels: 94.11 / 94.58 H1 chart's support levels: 93.74 / 93.28 Trading recommendations for today: Based on the H1 chart, place buy (long) orders only if the USD Index breaks with a bullish candlestick; the resistance level is at 94.11, take profit is at 94.58 and stop loss is at 93.66.
Ichimoku indicator analysis of USDX for August 18, 2017
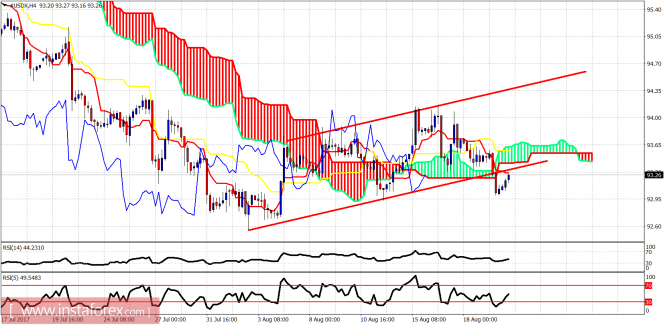
The Dollar index remains in a bullish short-term trend. Price is making higher highs and higher lows. However, the momentum is not as strong as we expected and this could imply that another strong downward move towards 91 could come soon.
Red lines - bullish channel The price is trading above the 4 hour Kumo (cloud). Price is also inside the bullish red channel. Support is at 93.30 while resistance is at 94.30. The form of the rise is corrective in nature. Once support fails to hold on the 4-hour chart, we should expect heavy selling to push the index to new monthly lows.
On a daily basis, the price is trapped between the kijun- and the tenkan-sen indicators. The trend is still however bearish and for that, to change we would need a push above 97.30. However, a break above 94.20-94.30 will open the way for a push towards 96.
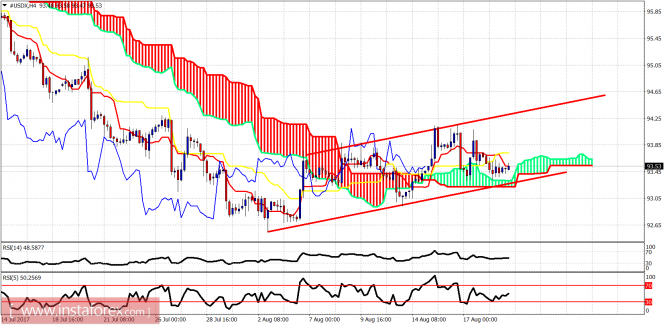
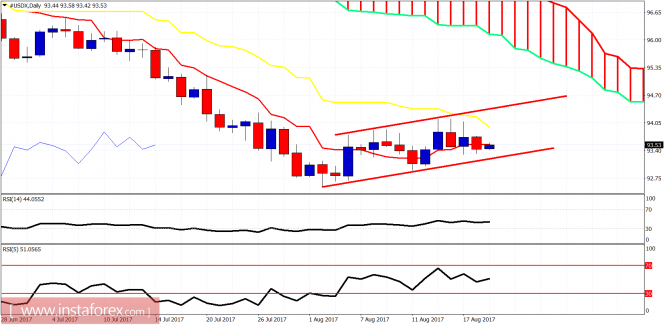
Ichimoku indicator analysis of USDX for August 21, 2017
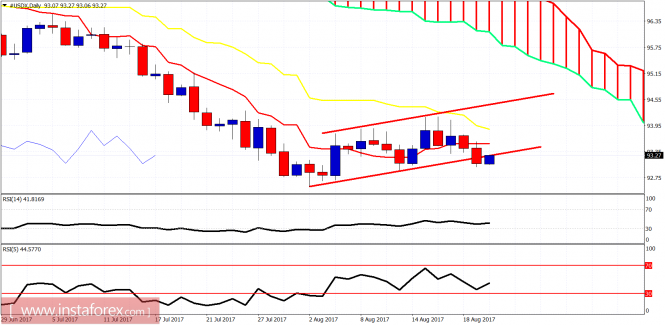
The dollar index continues to trade mostly sideways. The short-term support is held so we could not rule out another move towards 94-94.30. As long as the price holds above 93.30, trend is bullish.
Red lines - bullish channel The dollar index is trading above the 4 hour Kumo (cloud) and inside the bullish channel. The up trend is fragile. Support at 93.30 should not be broken. If this happens, then we expect the price to move towards 91. Resistance is at 94.25-94.50.
Red lines - bullish channel On a daily basis, the price is trying to overcome the tenkan-sen (red line indicator). The fact that we got rejected last week by the kijun-sen (yellow line indicator) is a bearish sign. Daily trend remains bearish. However this does not rule out a bounce towards 94.50. Critical short-term support is at 93.30. If broken, we go to 91-90.
Daily analysis of USDX for August 21, 2017
The index had a bearish journey on Friday and remains supported by the 93.28 level. Overall, the greenback is hovering around the 200 SMA at H1 chart and it's looking for a clear path in the short term. However, as long as it doesn't form any other lower low pattern, USDX could rally to test the resistance level of 94.11.
H1 chart's resistance levels: 93.72 / 94.11 H1 chart's support levels: 93.28 / 92.97 Trading recommendations for today: Based on the H1 chart, place buy (long) orders only if the USD Index breaks with a bullish candlestick; the resistance level is at 93.72, take profit is at 94.11 and stop loss is found at 93.33.
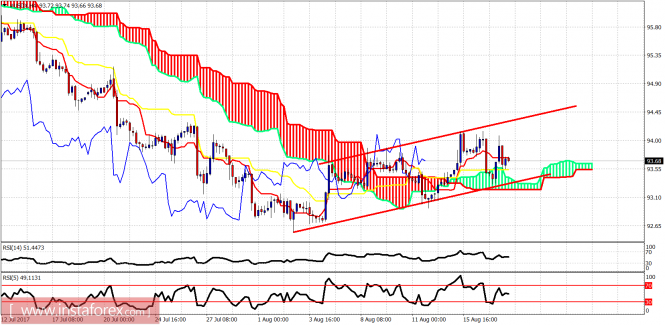
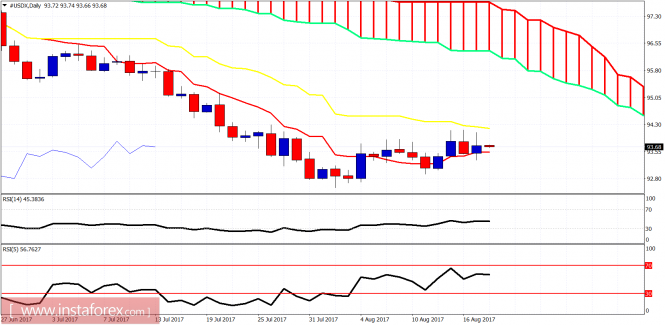
Ichimoku indicator analysis of USDX for August 22, 2017
The US dollar index has broken the channel and the cloud support. This is a bearish sign. Price is now back testing the breakdown level. I expect to see more selling pressures against the dollar over the coming sessions.
Red lines - bullish channel The dollar index has not only broken below the 4 hour Kumo but also has moved out of the bullish channel. Short-term trend is changing to bearish again. Price is now back testing the lower end of the channel. Usually price gets rejected and that is what I expect in the short term.
Red lines - bearish channel The dollar index daily candle got rejected at the tenkan-sen yesterday and is moving lower. Price as mentioned above has moved below the bullish channel. These signs are bearish and that is why I expect the dollar index to get rejected once again and move to new lows.