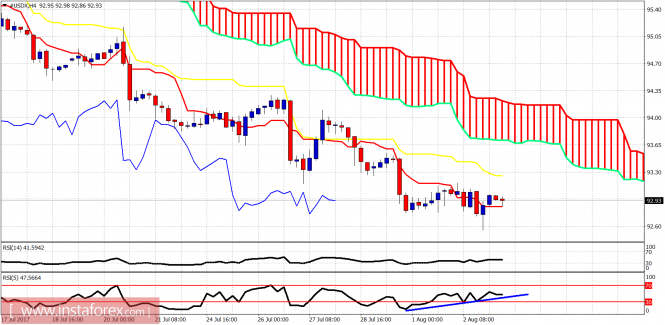
The Dollar index made a new lower low yesterday. The trend remains bearish. There are important bullish divergence signals by the RSI. This is a warning for Dollar bears.
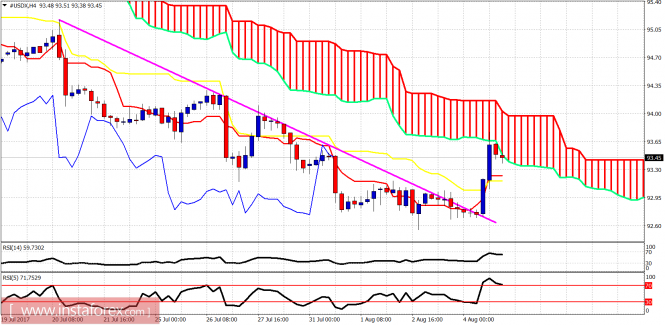
The Dollar index is showing divergence signs. I believe the reversal is very close. Resistance is at 93.30. Next resistance is at 94. There is a bullish candlestick reversal formation on the 4-hour chart as the candle that provided the new low turned upwards and closed positive with a long tail.
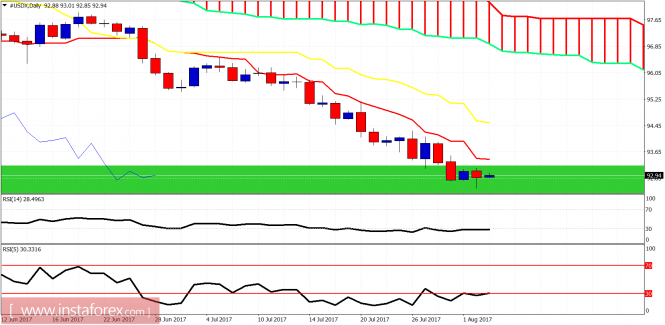
Green area - support The Dollar index as we mentioned in previous posts, is trading inside the long-term support area of 92-93. Combined with the bullish divergence signs in the daily and 4-hour chart, we should expect a strong bounce at least towards 94.50 if not higher towards the Daily cloud resistance at 96.
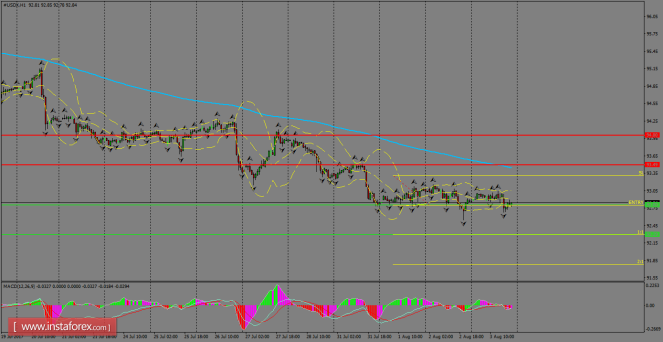
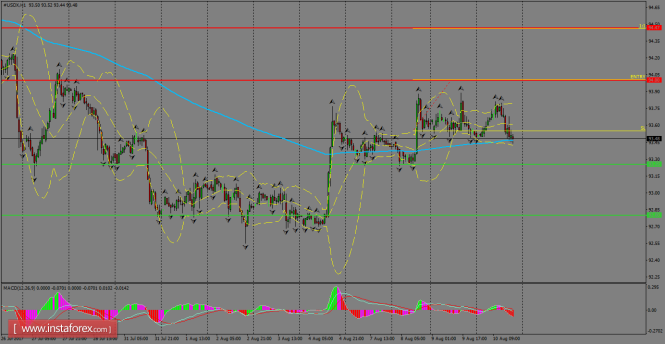
USDX remains in sideways and well supported by the 92.80 level. Overall, the picture is still bearish, as the index is trading below the 200 SMA and MACD indicator is favoring to that scenario to strengthen. However, if it breaks the range established since August 1st, the index could travel to test the 200 SMA at H1 chart around 93.35.
H1 chart's resistance levels: 93.49 / 94.00 H1 chart's support levels: 92.80 / 92.29 Trading recommendations for today: Based on the H1 chart, place sell (short) orders only if the USD Index breaks with a bearish candlestick; the support level is at 92.80, take profit is at 92.29 and stop loss is at 93.31.
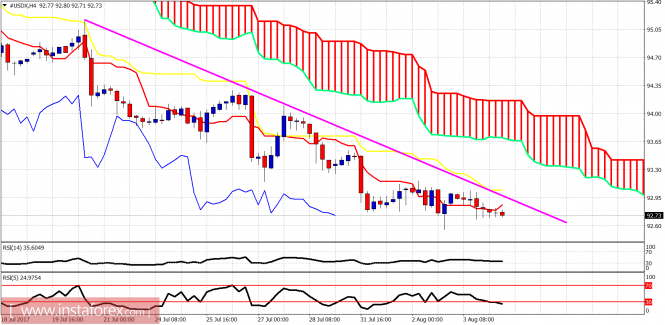
The US dollar index is near its yearly lows and inside the weekly support area of 93-92. The trend remains bearish. The key reversal level in the short term lies at 93. Oscillators are diverging, warning us of a strong bounce. Will the NFP provide the causation?
Magenda line - resistance The dollar index is trading below both the tenkan- and kijun-sen indicators as well as below the downward sloping trend line. Resistance is at 93-93.15. The short-term support is found at 92.50.
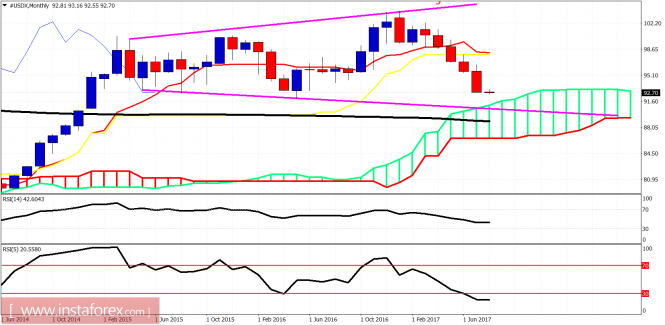
On a monthly basis the price has broken below the tenkan- and kijun-sen, approaching the monthly Kumo (cloud) support at 91.70. A bounce off 91-92 area could provide a bounce towards 98 if strong enough. However my minimum bounce target is at 95-96.
The Dollar index bounced strongly on Friday after the announcement of the jobs report and specifically of the better than expected NFP. Short-term trend has changed to bullish as the price is now testing important intermediate term trend.
Magenda line - resistance The Dollar index has broken above the resistance trend line and is making higher highs and higher lows. Price is now testing the important intermediate-term trend resistance level at 93.80. A pull back towards 93.20 is justified as this was the break out level. However, I believe that the time for a strong Dollar bounce has arrived. The weekly candle also could be confirming this view.
We have been saying for the past few sessions that the Dollar index is oversold, diverging, and inside the long-term support area of 92-93. Last week's candle with the long tail and bullish close near the highs is a bullish reversal hammer pattern. If this week is positive and gives us a higher close, we will confirm the trend reversal that could push price towards even 98. I remain bullish the Dollar.
The index was favored by the US NFP numbers of July and the structure is now turning sideways, as USDX is hovering around the 200 SMA zone at H1 chart. To see further advances, the index needs to break above the 93.49 level in order to test the key psychological level of 94.00. To the downside, the nearest support is placed at 92.80.
+
H1 chart's resistance levels: 93.49 / 94.00 H1 chart's support levels: 92.80 / 92.29 Trading recommendations for today: Based on the H1 chart, place sell (short) orders only if the USD Index breaks with a bearish candlestick; the support level is at 92.80, take profit is at 92.29 and stop loss is at 93.31.
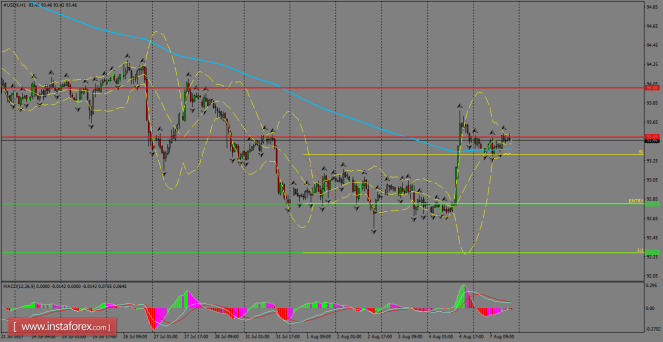
USDX is still hovering at the 200 SMA zone in the H1 chart. It seems that bullish formations could start to happen soon in the index, as long as it remains above the moving average. However, the risk is still to the downside and if the US Dollar Index manages to do a pullback at the current stage, then it could test the support level of 92.80.
H1 chart's resistance levels: 93.49 / 94.00 H1 chart's support levels: 92.80 / 92.29 Trading recommendations for today: Based on the H1 chart, place sell (short) orders only if the USD Index breaks with a bearish candlestick; the support level is at 92.80, take profit is at 92.29 and stop loss is at 93.31.
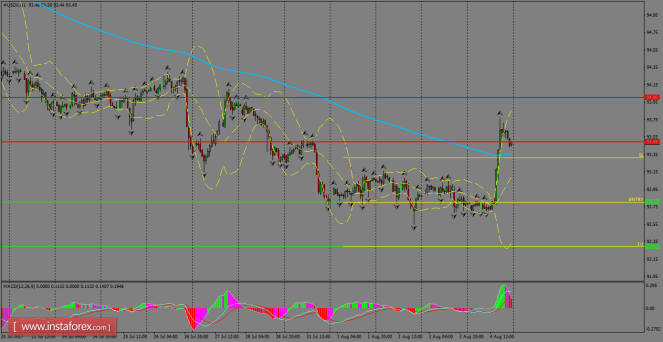
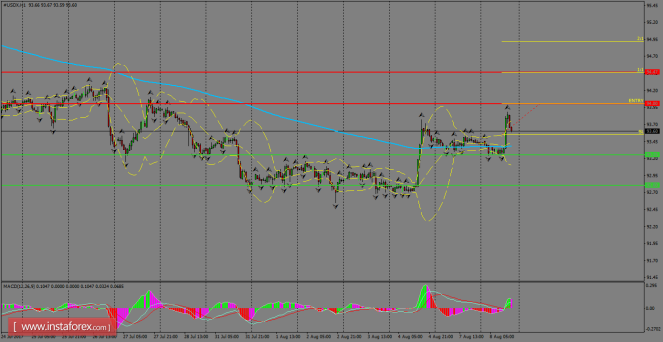
The index gained momentum during yesterday's session following positive data in the United States. Currently, it's headed to test the resistance level of 94.00 at which could happen a breakout that could open the doors to test the 94.42 level. To the downside, we're facing a support offered by the 200 SMA at H1 chart, which is the last hurdle before to reach the key level of 92.80.
H1 chart's resistance levels: 94.00 / 94.47 H1 chart's support levels: 93.25 / 92.80 Trading recommendations for today: Based on the H1 chart, place buy (long) orders only if the USD Index breaks with a bullish candlestick; the resistance level is at 94.00, take profit is at 94.47 and stop loss is at 93.55.
USDX is consolidated above the 200 SMA at H1 chart and looks forward to the resistance level of 94.00, which is a key psychological zone. If a breakout happens over there, then we might expect further advances in the index towards the 94.47 level. If a pullback happens at the current stage, one could expect a dynamic support in the 200 SMA.
H1 chart's resistance levels: 94.00 / 94.47 H1 chart's support levels: 93.25 / 92.80 Trading recommendations for today: Based on the H1 chart, place buy (long) orders only if the USD Index breaks with a bullish candlestick; the resistance level is at 94.00, take profit is at 94.47 and stop loss is at 93.55.
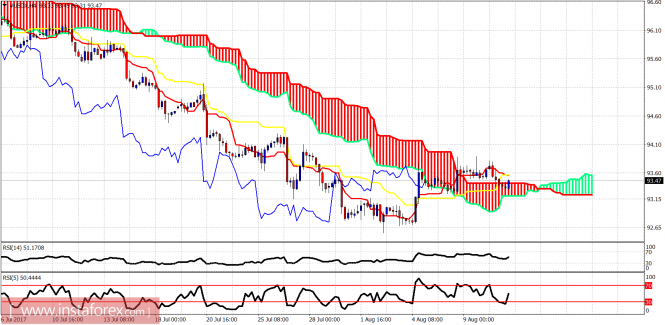
Ichimoku indicator analysis of USDX for August 11, 2017
The Dollar index has not made any upside progress so far this week but remains in a short-term bullish mode and can give higher price levels next week.
The price is mainly moving sideways this week. Price remains above the 4hour cloud helping bulls being optimistic for a move higher. Resistance is at 93.80-94. Support is at 93.20.
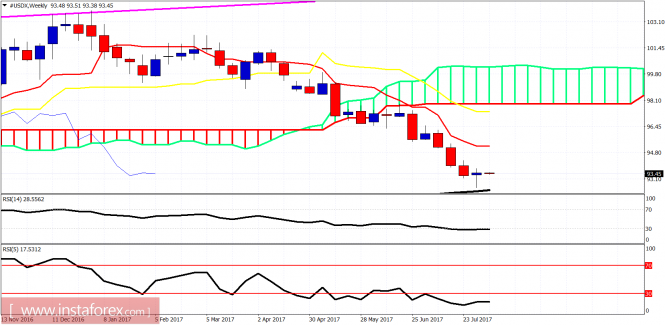
On a weekly basis, the price is below both the tenkan- and kijun-sen. The trend is bearish. A bounce has started and is expected to push price towards at least the 95-96 level where we find the tenkan-sen (Red line indicator). The weekly close of this week is important regarding the validity of the bullish reversal hammer candle pattern we saw last week.
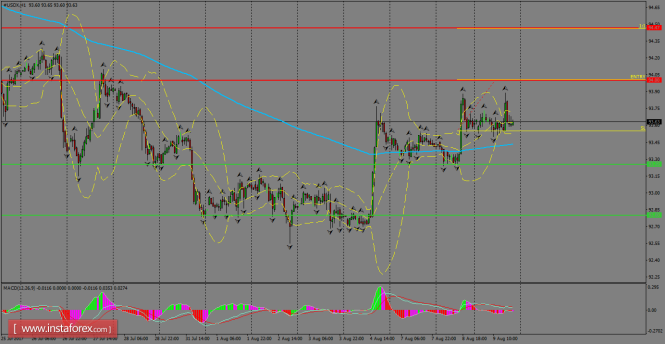
The index has been hovering around the 200 SMA zone at H1 chart and waits for a catalyst that helps to find a clear direction for the short-term. That moving average is expected to provide dynamic support across the board and next target should be the resistance and psychological level of 94.00 to the upside. MACD indicator remains in the negative territory, favoring to the bears.
H1 chart's resistance levels: 94.00 / 94.47 H1 chart's support levels: 93.25 / 92.80 Trading recommendations for today: Based on the H1 chart, place buy (long) orders only if the USD Index breaks with a bullish candlestick; the resistance level is at 94.00, take profit is at 94.47 and stop loss is at 93.55.