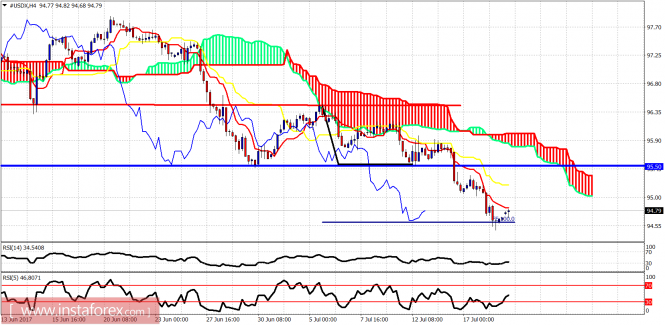
The Dollar index reached our target of 94.70 and is bouncing. Is this the end of the decline? Is the Dollar index going to make a strong bounce?Technically it has all the necessary conditions to do so but trend remains bearish. There is no reversal sign yet.
Red line - resistance Blue line -support (broken) resistance now The Dollar index reached the 100% extension of the rejection to lows move. Price is below both the tenkan- and kijun-sen making lower lows and lower highs. Trend remains bearish. Support is at 94.70 and next at 94.05. Resistance is at 94.90 and next at 95.25.
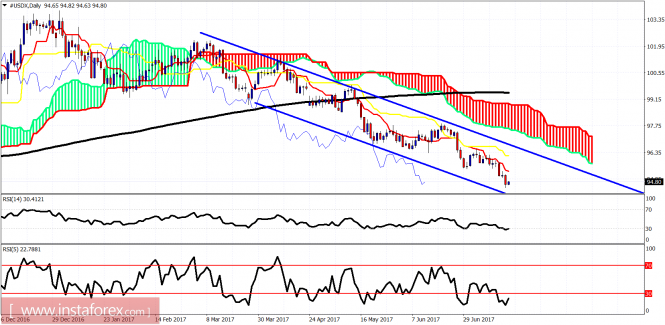
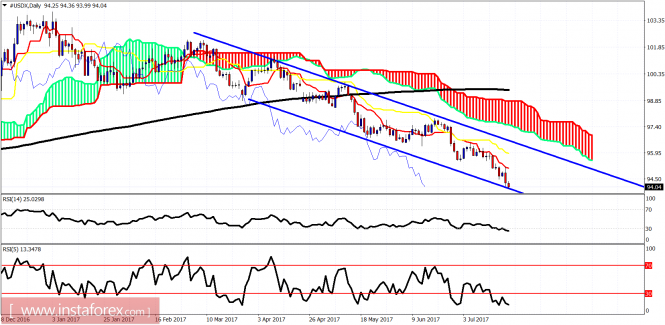
Blue lines - bearish channel On a daily basis, price is inside the bearish channel and below both the tenkan- and kijun-sen indicators. Trend is clearly bearish. The oscillators are in oversold territory and a bounce towards 97 is justified if not higher. Daily resistance is at 95.40-96.15. Breaking above these two levels could change short-term trend to bullish and push price towards 97-98.
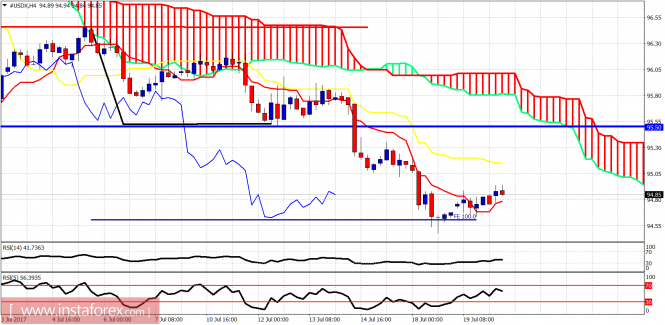
The Dollar index is bouncing off the 94.50 area towards 95 where we find the previous lows and the kijun-sen indicator as resistance. Trend remains bearish as long as price is below 95.80.
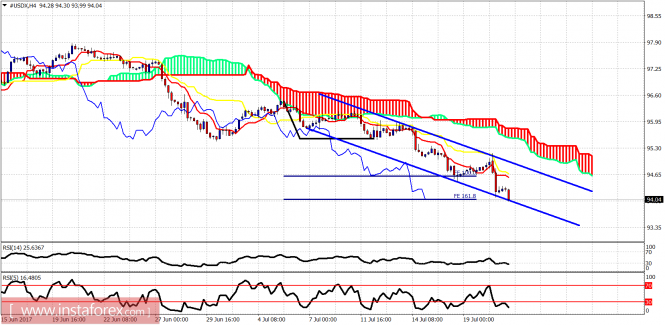
Red line - resistance Blue line - resistance (former broken support) The Dollar index is in a bearish trend. Price is above the tenkan-sen (Red line indicator) and this implies we could see price move towards the kijun-sen (yellow line indicator) at 95.15. Cloud resistance is at 95.50-95.80. Price continues to make lower lows and lower highs. No trend reversal signal yet.
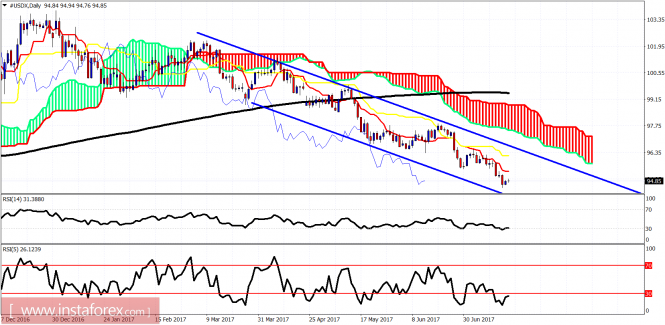
Blue lines - bearish channel The Dollar index remains inside the bearish channel and below both the tenkan- and kijun-sen indicators. Price is also below the 200 Day MA. Daily resistance is at 95.50-96.20 area. As long as we trade below these levels, we are in a bearish daily trend looking for a move towards 92.
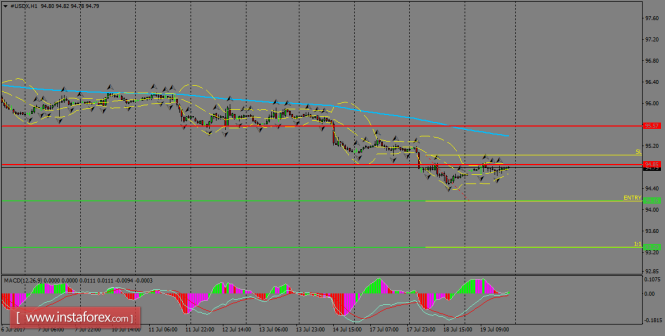
The index has been capped by the resistance zone of 94.85 and it would be likely to see a decline towards the support zone of 94.16. The 200 SMA at H1 chart still points to the downside and the preferred scenario remains in favor of the bears. Next targets should be the 94.16 and 93.29 levels. MACD indicator is turning neutral, favoring for sideways' moves in USDX.
H1 chart's resistance levels: 94.85 / 95.57 H1 chart's support levels: 94.16 / 93.29 Trading recommendations for today: Based on the H1 chart, place sell (short) orders only if the USD Index breaks with a bearish candlestick; the support level is at 94.16, take profit is at 93.29 and stop loss is at 95.02.
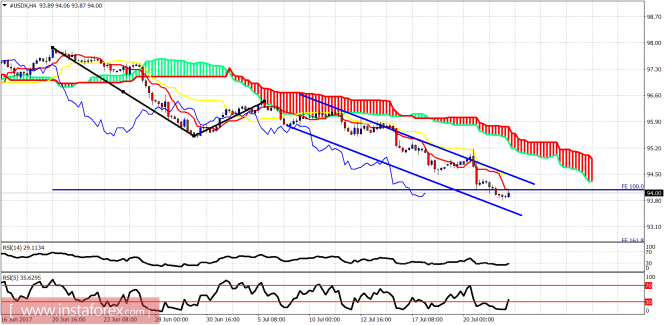
The Dollar index remains in a bearish trend in all time frames. Price made a new lower low today as its main component EUR/USD is rallying. The Dollar index has now reached our second target of 94.
Blue lines - bearish channel The Dollar index is trading inside the bearish channel. Price is right on top of the lower channel boundary. RSI (5) is oversold and diverging. The RSI (14) is diverging. Support is here at 94. Resistance is at 94.40. If broken we could see a push higher towards 94.70-94.80.
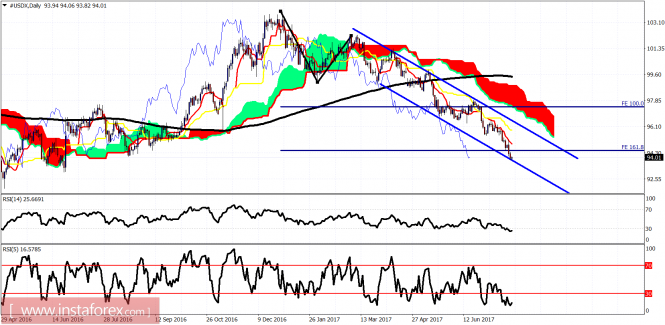
Blue lines - bearish channel The Dollar index remains inside the daily bearish channel and is clearly in a bearish trend as price continues to make lower lows and lower highs. Daily resistance is at 95.10 and next at 96. A short-term bounce towards 95-95.50 is justified from current levels but its counter trend so trading it would not be preferred.
The index continues to be strongly bearish on a short-term basis and looks to break the support level of 94.16, targeting the 93.29 level and it could be reached during this week. The 200 SMA at H1 chart still is setting the tone in the greenback and gains should be limited by that area. MACD indicator is flat, calling for sideways.
H1 chart's resistance levels: 94.85 / 95.57 H1 chart's support levels: 94.16 / 93.29 Trading recommendations for today: Based on the H1 chart, place sell (short) orders only if the USD Index breaks with a bearish candlestick; the support level is at 94.16, take profit is at 93.29 and stop loss is at 95.02.
The Dollar index remains in a bearish trend. There are bullish divergence signals but no trend reversal confirmation yet even in the 4-hour time frame. However bears need to be very cautious as the downward move has reached extension targets.
Blue lines - bearish channel The Dollar index is trading below both the tenkan- and kijun-sen indicators. Trend is clearly bearish as price continues to make lower lows and lower highs. Short-term resistance is at 94.50. Support is at 93.50.
Blue lines - bearish channel The downward move that started in early 2017 has now reached the 161.8% extension of the first leg down from 103.70 to 99 in December 2016. A bounce from current levels or from 93 is very possible and bears should be very careful and protect their positions with trailing stops.
USDX is currently forming a bottom around the psychological zone of 94.00 and we can expect some corrective moves to take place, towards the 200 SMA at H1 chart. If a dynamic resistance is found around that area, the index could resume the bearish path towards the 93.29 level. MACD indicator is supporting the recovery scenario.
H1 chart's resistance levels: 94.85 / 95.57 H1 chart's support levels: 94.16 / 93.29 Trading recommendations for today: Based on the H1 chart, place sell (short) orders only if the USD Index breaks with a bearish candlestick; the support level is at 94.16, take profit is at 93.29 and stop loss is at 95.02.
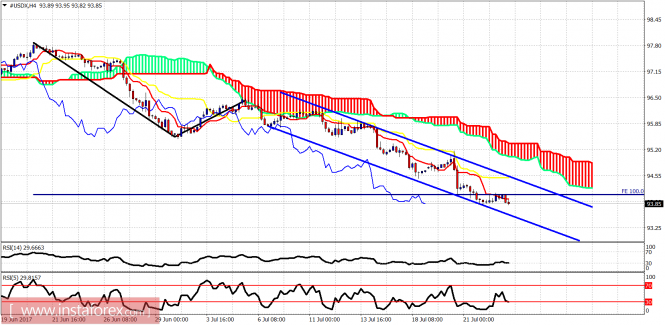
The Dollar index remains in a bearish trend. No reversal signal yet, although we have some warning signs as oscillators get oversold. The key support area for the long-term is at 92-93.
Blue lines - bearish channel The Dollar index is clearly in a bearish trend making lower lows and lower highs. Price remains inside the bearish channel and below both the tenkan- and kijun-sen indicators on the 4-hour chart. Short-term support is at 93.50 and resistance is at 94.50.
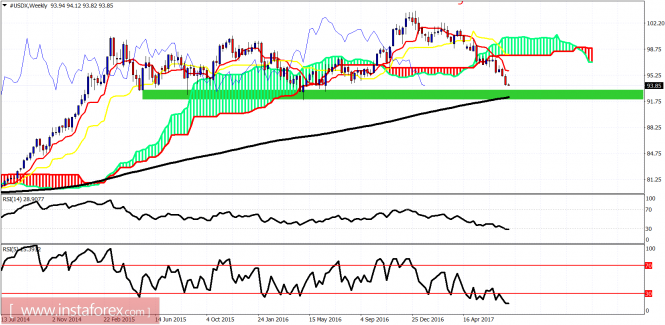
Green rectangle - long-term support area The Dollar index has broken below the weekly Kumo (cloud) and is heading towards the green rectangle support area where it could also find support at the 200 MA currently at 92.35. Oscillators are oversold. It is just a warning to be cautious.
The Dollar index remains in a bearish trend despite the short-term bounce yesterday. As long as the price is below 94.50 trends is clearly bearish. A rejection at current levels will bring in more sellers and push the index to new lows.
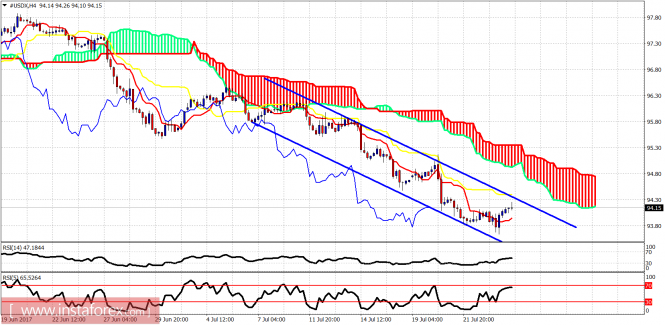
Blue lines - bearish channel The Dollar index is trading below the 4-hour Kumo and therefore the short-term trend is bearish. Resistance is at 94.50 and next at 95. Support is at 93.95 and next at 93.30.
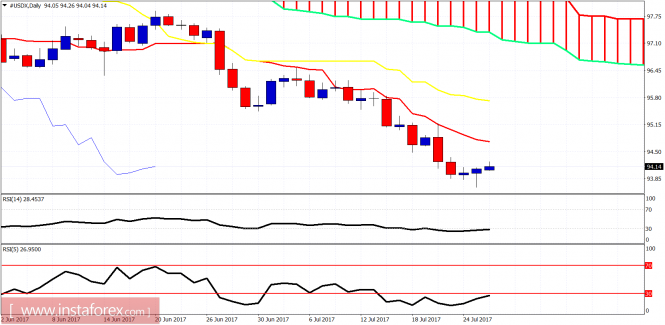
On a daily basis, the trend is clearly bearish as the price is below both the tenkan- and kijun-sen. Resistance is at 94.75. A daily close above this level would be an initial reversal signal that would at least push price towards 95.75.
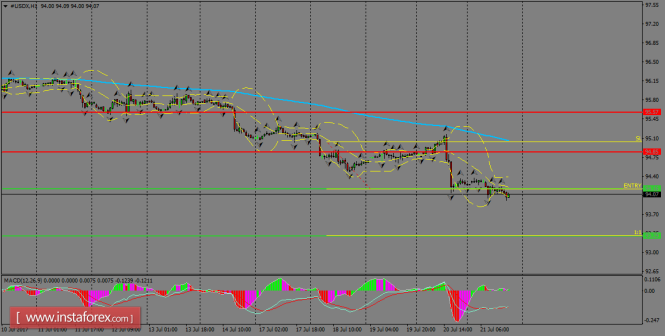
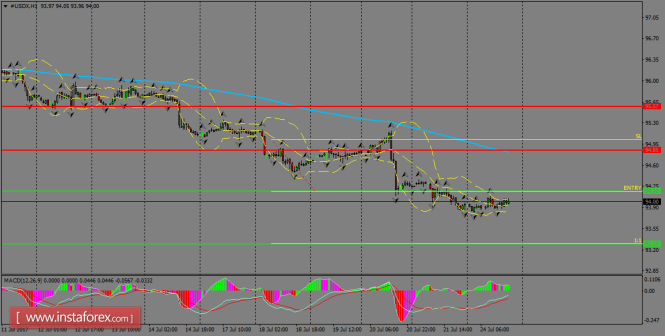
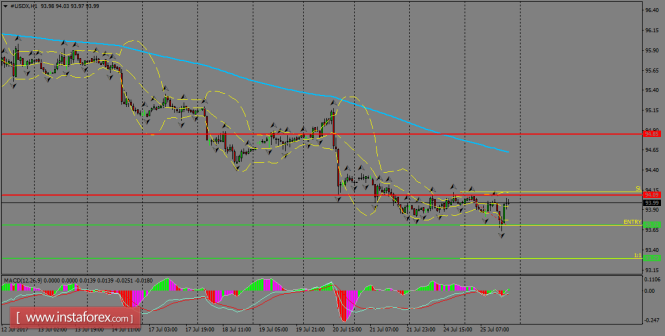
The index is still alive in the bearish trend and remains consolidated below the 200 SMA at H1 chart. However, the current tone is still sideways and as long as the greenback remains above the support level of 93.71, it can be looking for the 200 SMA to correct the downside in a first degree, around 94.60. MACD indicator is entering the positive territory, favoring that scenario.
H1 chart's resistance levels: 94.09 / 94.88 H1 chart's support levels: 93.71 / 93.29 Trading recommendations for today: Based on the H1 chart, place sell (short) orders only if the USD Index breaks with a bearish candlestick; the support level is at 93.71, take profit is at 93.29 and stop loss is at 94.12.