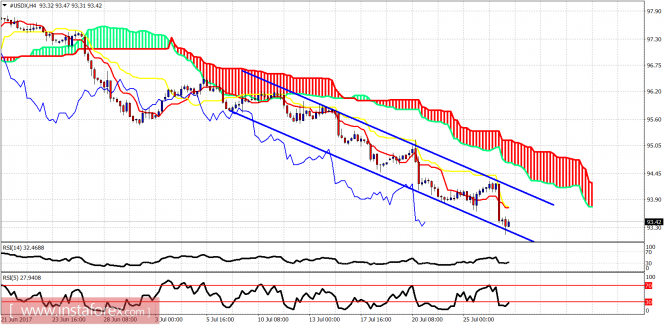
The Dollar index bounced yesterday towards the upper channel boundary but got rejected and reversed lower making a new lower low. The trend remains bearish. No reversal sign yet, although bullish divergence signs are there as a warning for bears to be cautious.
Blue lines - bearish channel The Dollar index is making lower lows and lower highs. Resistance is now at 94 and next at 94.30-94.90. Support is at 93.15. The trend is clearly bearish. A break above 94.30 will be the first important signal of a dollar reversal.
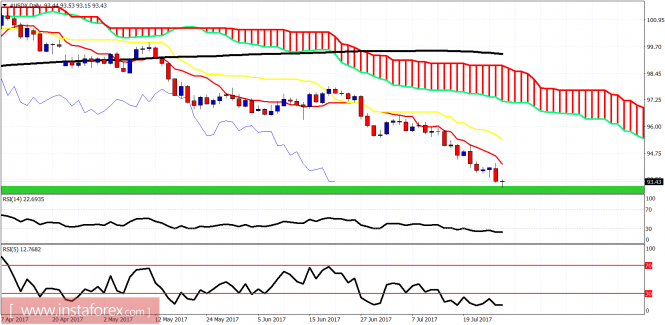
Green rectangle - long-term support area The Dollar index has reached the long-term support area between 92-93. We could make new lower lows, but a strong bounce is justified. Daily resistance is found at 94.20, next at 95.40 and finally at 97. If the Dollar index reverses from current levels, 97 is my preferred target area.
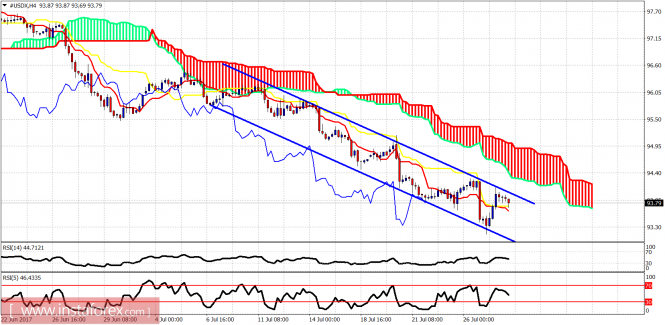
The Dollar index remains inside the bearish channel and it shows signs of rejection at the upper channel boundary. A new low might be close by. The Dollar is way oversold with glaring bullish divergence signs. Dollar bears need to be very cautious.
Blue lines - bearish channel The Dollar index remains in a bearish trend. Price is trying to break above and out of the bearish channel. Resistance is at 94 and next at 94.30 by the cloud. As long as the price is below 94.90 trend is considered bearish.
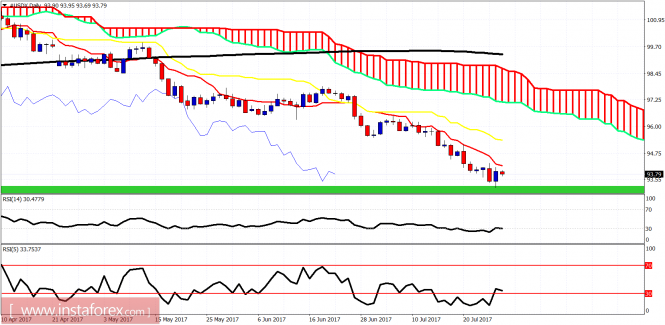
Green rectangle - long-term support The weekly chart shows price just above the long-term support and the RSI (5) diverging. The trend remains bearish. The dollar is oversold in the short-term and a bounce is long overdue. Bears must be very cautious as a Dollar bounce could be very strong back towards 97.
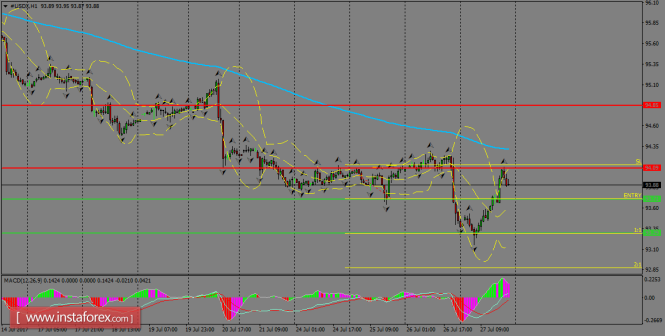
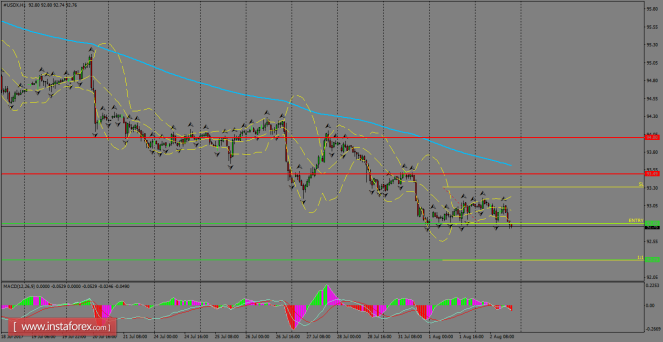
The index recovered from the losses following the Fed's decision to keep rates unchanged at its July's meeting. The resistance zone of 94.09 is still capping further gains in USDX and if the index manages to break above that level, it can rally to 94.85 in a first degree. The MACD indicator is still in the positive territory, but is entering the overbought territory.
H1 chart's resistance levels: 94.09 / 94.88 H1 chart's support levels: 93.71 / 93.29 Trading recommendations for today: Based on the H1 chart, place sell (short) orders only if the USD Index breaks with a bearish candlestick. The support level is at 93.71, take profit is at 93.29 and stop loss is at 94.12.
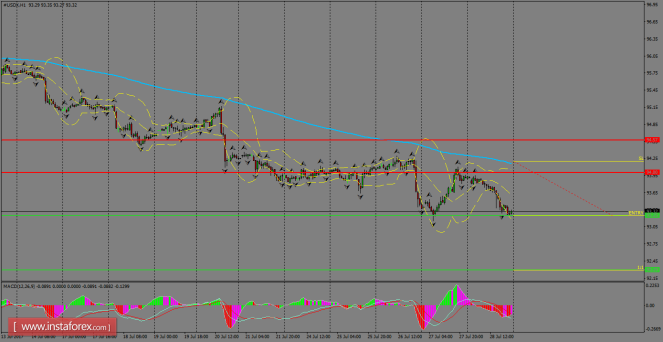
The USDX is still below the 200 SMA in the H1 chart and it is forming a possible double bottom around the 93.25 level. THe weakness is limited and we can expect some consolidation moves in the first days of the week. However, if the 93.25 level gives up, further declines are expected to happen towards 92.29 level.
H1 chart's resistance levels: 94.00 / 94.57 H1 chart's support levels: 93.25 / 92.29 Trading recommendations for today: Based on the H1 chart, place sell (short) orders only if the USD index breaks with a bearish candlestick; the support level is at 93.25, take profit is at 92.29 and stop loss is at 94.20.
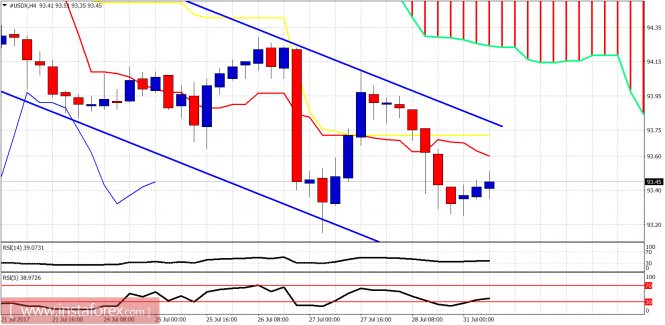
The US dollar index remains in a bearish trend as the price continues to make lower lows and lower highs. The index remains trapped inside a bearish channel but we have reached the important long-term support levels.
Blue lines - bearish channel The short-term resistance lies at 93.75-93.85 area. The support is found at 93.30. Breaking above resistance will open the way to a bigger bounce towards the cloud resistance at 94.20-94.50. Breaking support will open the way to a push lower towards 92.
Green rectangle - long-term support area The price is approaching the weekly 200 MA and the support area of 92-93. The trend is clearly bearish. A reversal from current levels in short-term trend could result in a bounce towards 95.50 which is our minimum bounce target.
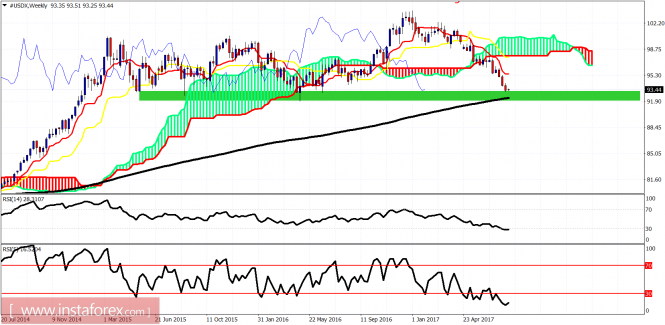
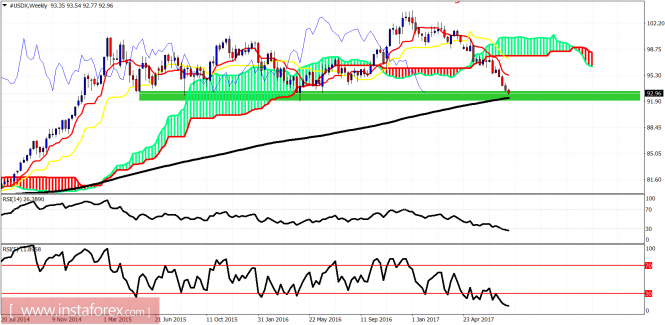
The Dollar index remains in a bearish trend making lower lows and lower highs. Price is at the same levels it was back in May of 2016 and major support area. Oscillators are in oversold territory but not diverging in the weekly charts, implying that even a strong bounce will be a shorting opportunity.
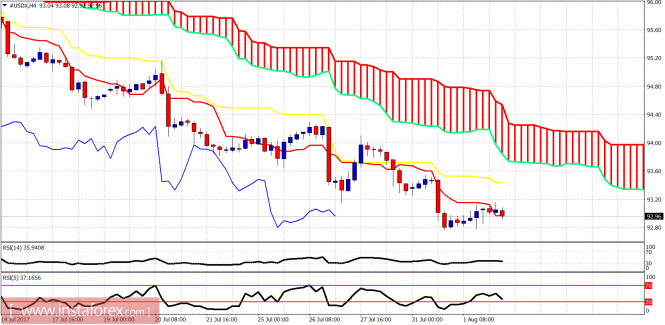
Blue lines - bearish channel The Dollar index remains inside the bearish short-term channel and below both the tenkan- and kijun-sen. Price cannot break above and out of the channel. Short-term resistance is at 93.20 and next at 93.60. A break above 93.60 will push price towards 94.
Green rectangle - long-term support The weekly candle has entered the weekly support area and is approaching the 200 MA at 92.32. This is a huge support. Oscillators are oversold. A bounce is hugely justified. Minimum bounce target is at 95.30. Bears need to lower their stops and be cautious.
USDX remains supported by the 92.80 level and it's now forming a lower low pattern. The bearish structure remains solid below the 200 SMA and that's why we're expecting that a lower continuation takes place towards the support zone of 92.29. If the index manages to break above 93.49, then it can rally to test the 94.00 level. Show full picture H1 chart's resistance levels: 93.49 / 94.00 H1 chart's support levels: 92.80 / 92.29 Trading recommendations for today: Based on the H1 chart, place sell (short) orders only if the USD Index breaks with a bearish candlestick; the support level is at 92.80, take profit is at 92.29 and stop loss is at 93.31.
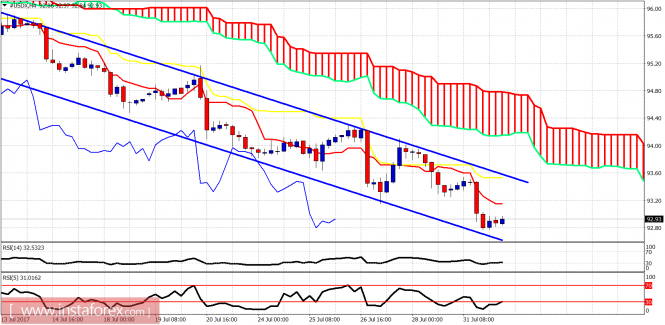
The Dollar index remains in a bearish trend. The price is making lower lows and lower highs. There are bullish divergence signs that should not be ignored as this downward move has lasted more than initially expected and should soon provide a strong bounce for the index.
Short-term support is at 92.75 and resistance at 93.45. Price is making lower lows and lower highs. No reversal sign yet. I believe that soon we should see a dollar bounce.
Green rectangle - support area The Dollar index has entered important long-term support area and is approaching close to the 200 MA. A bounce towards the minimum target of 95 is expected from around these levels and traders should be cautious as I believe we are at a turning point. Bears need to tighten their protective stops.
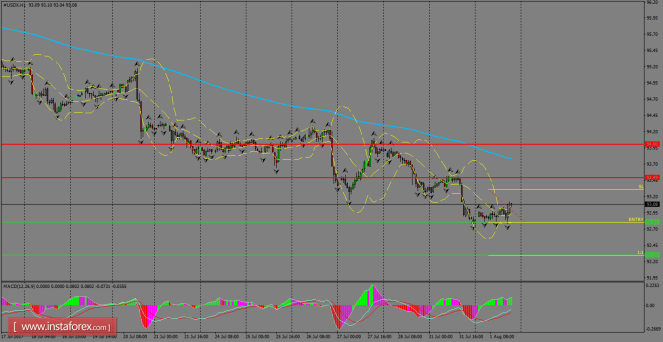
The index is still supported by the 92.80 level, but it's trying to break it in order to extend losses. Overall, the bearish structure is still alive and one could expect a lower continuation. If that happens, the next target to the downside should be the 92.29 level. In the bullish scenario, the nearest resistance is at the 93.50 level. MACD indicator is in the negative territory, favoring to the bearish idea.
H1 chart's resistance levels: 93.49 / 94.00 H1 chart's support levels: 92.80 / 92.29 Trading recommendations for today: Based on the H1 chart, place sell (short) orders only if the USD Index breaks with a bearish candlestick; the support level is at 92.80, take profit is at 92.29 and stop loss is at 93.31.