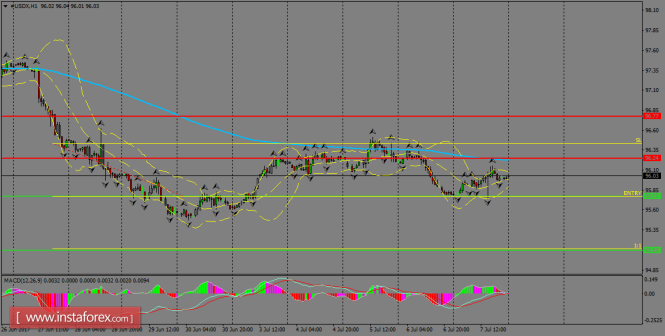
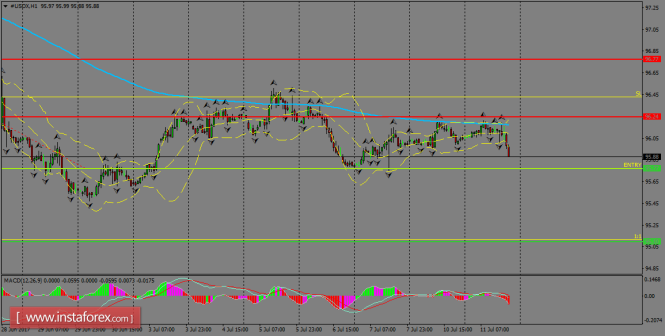
The greenback continues to find a bottom around 95.77 and it will try to test the 200 SMA at H1 chart in order to break higher. However, as long as it stays below that moving average, USDX will try to look for the 95.10 level in the short-term and it would happen after a breakout below 95.77. MACD indicator is turning flat, calling for sideways.
H1 chart's resistance levels: 96.77 / 97.20 H1 chart's support levels: 96.38 / 95.77 Trading recommendations for today: Based on the H1 chart, place sell (short) orders only if the USD Index breaks with a bearish candlestick; the support level is at 95.77, take profit is at 95.10 and stop loss is at 96.42.
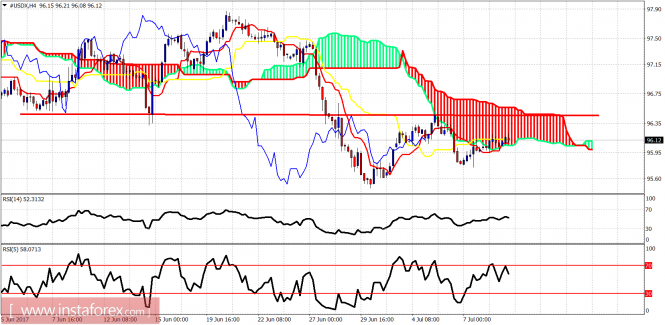
The Dollar index remains below the 96.30-96.50 resistance area. The trend is neutral. Price has made a higher low but bulls need to make a higher high in order to start a new upward move targeting 98.
Red line - resistance The Dollar index is trying to approach the resistance trend line at 96.50. The trend is neutral as price mainly moves sideways. Support is at 95.75 and resistance at 96.30. Bulls need to break above 96.30 otherwise a rejection here might lead to a push lower towards 94.
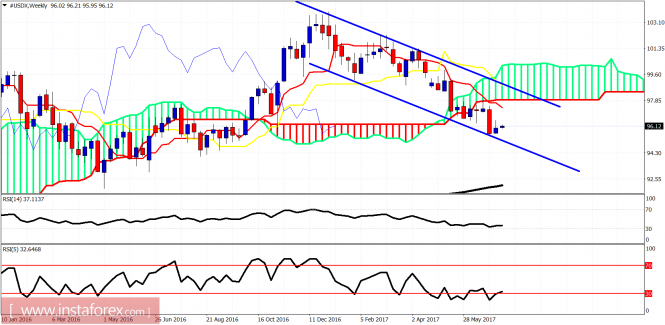
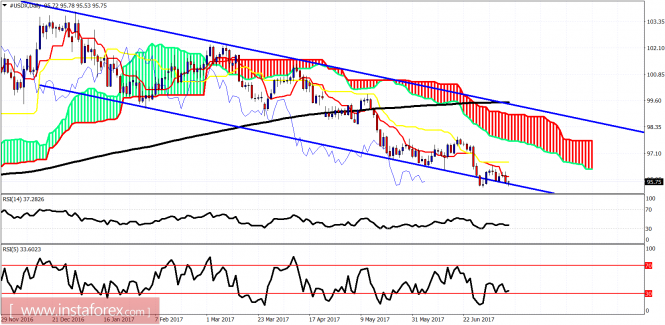
Blue lines - bearish channel The Dollar index is showing reversal signs off the lower channel boundary. I expect a strong bounce off these levels towards the upper channel boundary or at least towards the Kumo (cloud) lower boundary at 98.
The Dollar index got rejected from the short-term cloud resistance at 96.30 and pulled back towards its recent lows at 95.50. A possible double bottom formation could be in play as price is bouncing off the previous lows.
Red line - resistance Blue line - support The Dollar index is bouncing off the previous lows at 95.50 which is also a support level. Short-term resistance is at 96.15. Breaking it will increase dramatically the chances of breaking above 96.50 and moving towards 98.
Blue lines -bearish channel The Dollar index continues to trade right on top of the lower channel boundary. Daily resistance is at 96-96.50. Breaking it will open the way for a push higher towards 97.60.
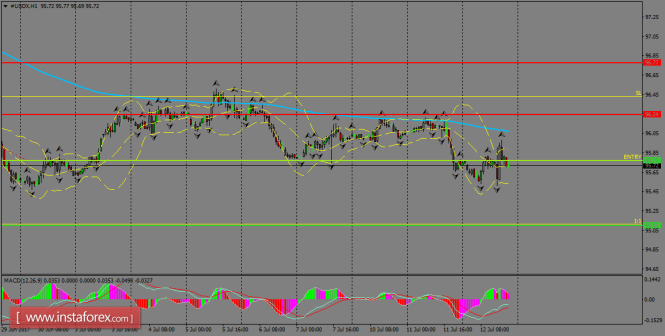
The index was under heavy selling pressure amid Trump Jr. emails' release and that's why we expect it could test the support zone of 95.77. Also, USDX is finding dynamic resistance in the 200 SMA at H1 chart and a breakout below 95.77 should open the doors to test the 95.10 level. MACD indicator remains in the negative territory, supporting the bearish bias.
H1 chart's resistance levels: 96.77 / 97.20 H1 chart's support levels: 96.38 / 95.77 Trading recommendations for today: Based on the H1 chart, place sell (short) orders only if the USD Index breaks with a bearish candlestick; the support level is at 95.77, take profit is at 95.10 and stop loss is at 96.42.
USDX continues to ride the bearish side and the consolidation below the 200 SMA at H1 chart still prevails. To the downside, we might expect a testing of the 95.10 level, but we would need to wait for a confirmation from the MACD indicator, which is still in the positive territory. In the bullish path, closest resistance is placed in the 200 SMA zone.
H1 chart's resistance levels: 96.77 / 97.20 H1 chart's support levels: 96.38 / 95.77 Trading recommendations for today: Based on the H1 chart, place sell (short) orders only if the USD Index breaks with a bearish candlestick; the support level is at 95.77, take profit is at 95.10 and stop loss is at 96.42.
The Dollar index has weakened significantly after the speech by FED Chairwoman Janet Yellen. Price is now testing the recent lows and critical short-term support. Breaking below 95.50 gives us a target at 94.60. Trend remains bearish as long as price is below 96.40.
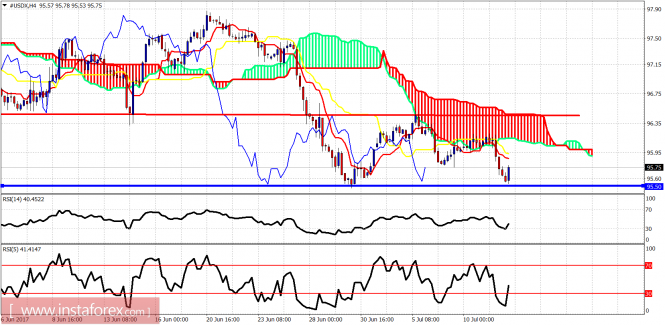
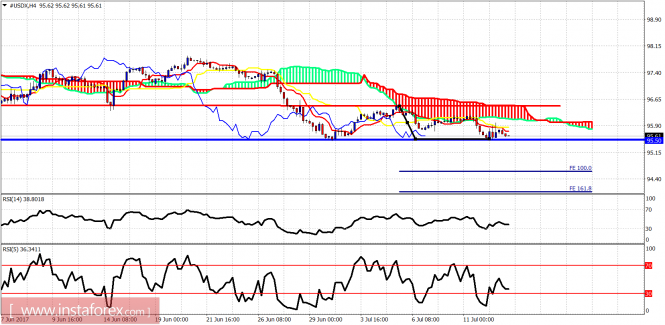
Red line - resistance Blue line - support The Dollar index got rejected by the Ichimoku cloud resistance at 96.30 and reversed back to its recent lows. The bearish scenario of a downward break has more chances as long as price is below 96.10-96.30. Trend remains bearish. If support fails to hold, next target is at 94.60.
Blue lines - bearish channel The Dollar index weekly chart remains bearish with oversold signs running since late April. Price is on top of the lower channel boundary. I believe we should focus on the bounce as I believe the downside is limited.
USDX remains offered and it looks like the downside breakout should come in the next days. The support zone of 95.10 is helping to cap further bearish advance and if we witness a break below there, then another selling wave could impact the greenback to test the 94.16 level. MACD indicator is entering the oversold territory, calling for some rebounds.
H1 chart's resistance levels: 95.57 / 96.24 H1 chart's support levels: 95.10 / 94.16 Trading recommendations for today: Based on the H1 chart, place sell (short) orders only if the USD Index breaks with a bearish candlestick; the support level is at 95.10, take profit is at 94.16 and stop loss is at 96.05.
The Dollar index has broken below horizontal support at 95.50. Price is now trying back test the break out area. If the break down was real, we should see a rejection and a move lower.
Red lines -resistance Blue lines - support (broken) The Dollar index has bearish target of 94.70. If however we see price break above 95.50 and 95.90 we should consider the breakdown as a false one. This would be a very bullish sign.
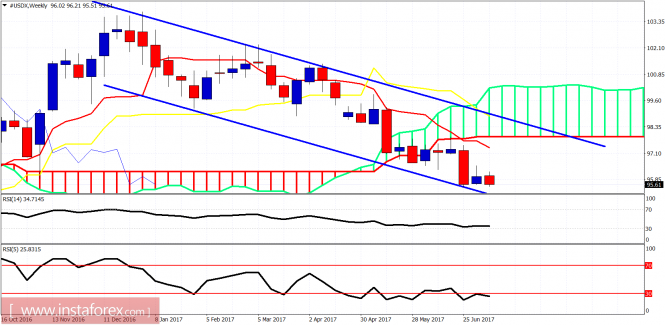
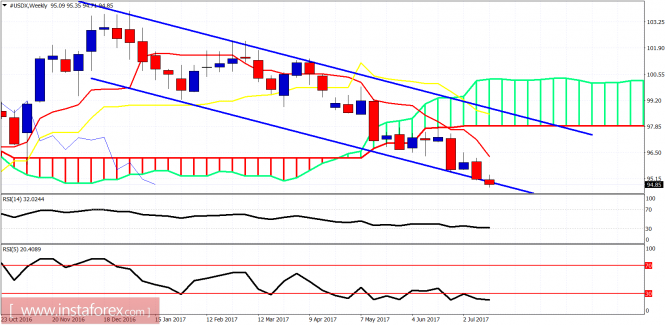
Blues lines -bearish channel On a weekly basis the RSI continues to diverge and provide warning signs. Price makes lower lows but is trading on top of the lower channel boundary. I continue to expect a bounce towards the weekly Kumo (cloud) and upper channel boundary before committing to a short position.
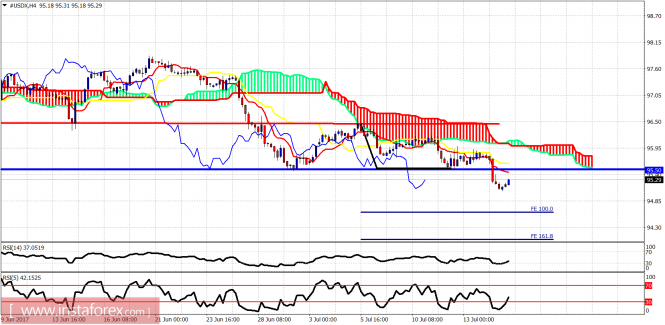
The Dollar index back tested the break down level at 95.50 and reversed back lower after being rejected at resistance. Price is now just above our 94.70 target.
Red line- resistance Blue line - support (broken) The trend is bearish. Target is 94.70 and was given once price broke below the blue horizontal support at 95.50. We were bearish since 96.30 where price could not break above the 4 hour Kumo. The trend has not changed since despite being given some weak signals of reversal. The reversal was never confirmed. On the contrary, the bearish trend signs were strengthened.
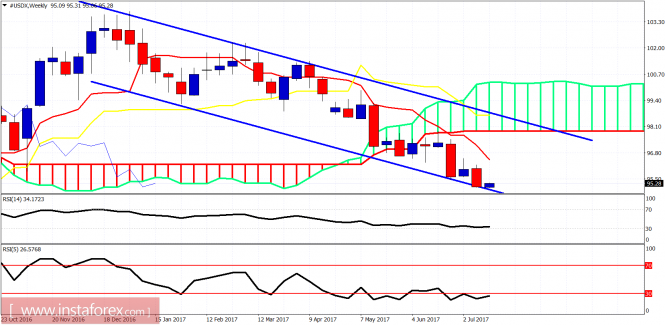
Blue lines - bearish channel The Dollar index remains inside the weekly bearish channel and below the weekly Kumo. The RSI (5) is oversold and diverging. This is not a reversal signal but a warning. Do not think it is the same. The trend remains bearish and there is no confirmation of a bullish reversal in any time frame. I continue to expect a bounce but price action continues to favor bears.
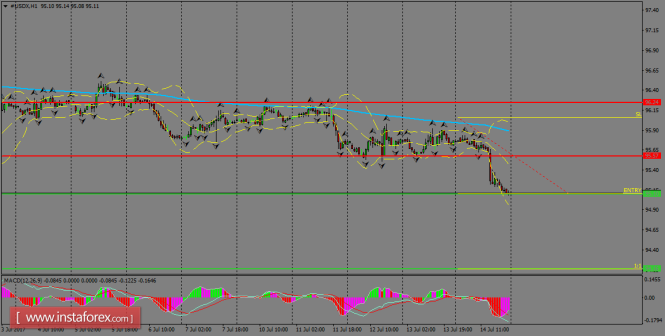
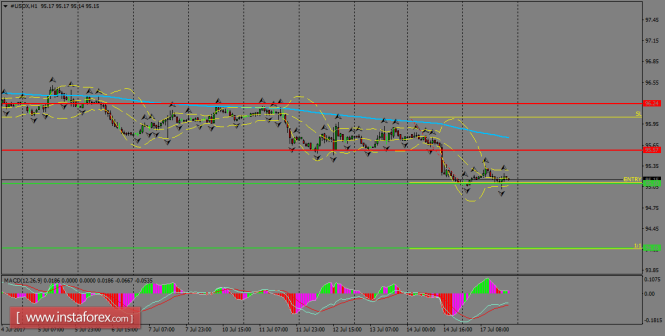
The index is looking to break below 95.10 in an effort to extend weakness towards 94.16. Overall trend remains bearish as long as USDX still trades below the 200 SMA at H1 chart. However, we can expect a recovery to take place towards that moving average before to resume the decline. The next target should be the 94.16 level.
H1 chart's resistance levels: 95.57 / 96.24 H1 chart's support levels: 95.10 / 94.16 Trading recommendations for today: Based on the H1 chart, place sell (short) orders only if the USD Index breaks with a bearish candlestick; the support level is at 95.10, take profit is at 94.16 and stop loss is at 96.05.