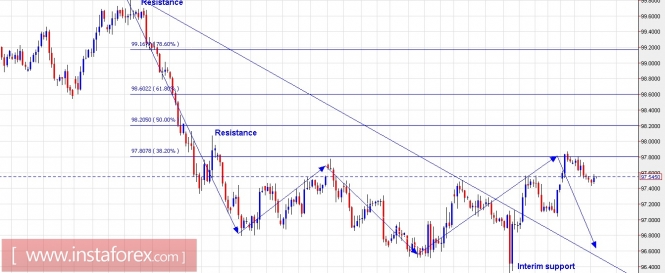
Technical outlook: The US Dollar Index has reacted well at Fibonacci resistance at 97.80 levels. The drop might still not be enough to confirm new lows but it might have initiated already. At least it could be confirmed now that till prices remain below 98.20 levels, the US Dollar Index could continue to drift lower below 96.30 levels as well. Please note that the index has been consolidating since a while now before it met resistance at 97.80 yesterday and reversed lower. If this interpretation of waves is correct, we should see at least one low below 96.30 levels. Also, the index has been behaving differently against major currency pairs lately, adding further doubts to its near-term trend possibilities. Trading plan: Please exit short positions from yesterday and remain flat for now till further clarification on trend setups. Fundamental outlook: There are no major events lined up for the day.
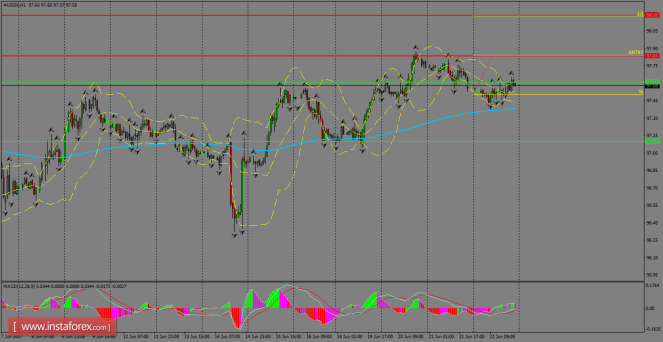
USDX continues to ride a bullish structure above the 200 SMA at H1 chart and it's targeting the 98.18 level. However, moving average could give up to the bears' pressure and the index might extend the decline towards 97.10 in a first degree. In the bullish's outlook, once the 97.84 level has been broken, it can rise to test the 98.18 level.
H1 chart's resistance levels: 97.84 / 98.98 H1 chart's support levels: 97.61 / 97.10 Trading recommendations for today: Based on the H1 chart, place buy (long) orders only if the USD Index breaks with a bullish candlestick; the resistance level is at 97.84, take profit is at 98.98 and stop loss is at 97.51.
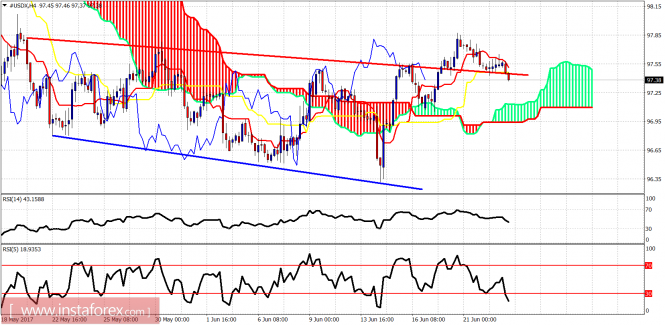
Ichimoku indicator analysis of USDX for June 23, 2017
The Dollar index is weakening. Price is breaking below support and this is not a good sign. The bounce we were expecting was shallow. If price breaks below 97, we should expect more selling pressures to push the index to new monthly lows.
Red line - support (previous resistance) Blue line- support The Dollar index has broken below both the tenkan- and kijun-sen indicators. Price is heading towards Kumo (cloud) support at 97.15-97. Breaking below the 4-hour Kumo will turn trend back to bearish and will bring more sellers and push price towards 95-94.
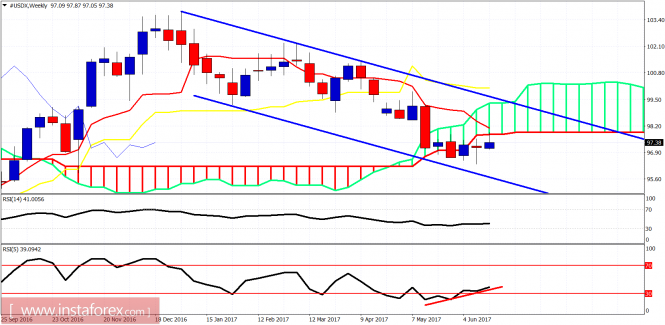
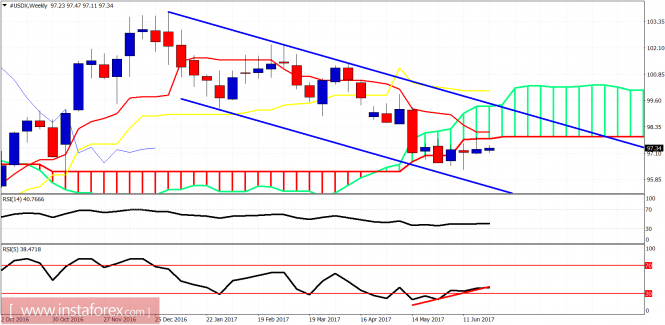
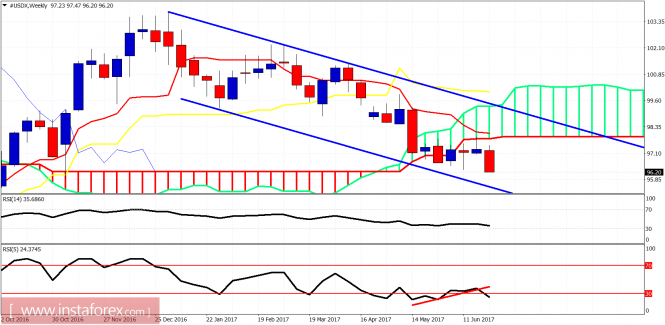
Blue lines - bearish channel The weekly price action remains inside a bearish channel. Weekly candle got rejected at the lower Kumo (cloud) boundary resistance. This rejection is not a good sign. Bulls need to make a new weekly high to remain in control and to continue to hope for a move towards 98.50-99. The rejection has however brought a new scenario where we see a new weekly low and then reverse.
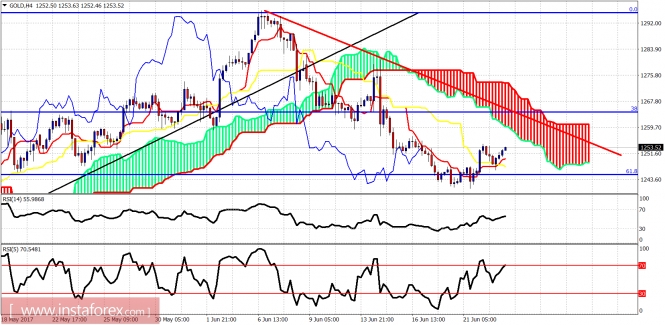
Ichimoku indicator analysis of gold for June 23, 2017
Gold is making higher highs and higher lows in the 4-hour chart and is unfolding the upward reversal we expect off the $1,245 price area. Gold is expected to continue the bounce towards $1,260 and higher. We could see a short-term new low towards $1,230 but it is not necessary.
+
Red line - resistance Gold price is bouncing off the 61.8% Fibonacci retracement but remains below the red trend line resistance and the 4-hour Kumo (cloud). Price is above the tenkan- and kijun-sen indicators and this is a short-term bullish sign that the upside could continue.
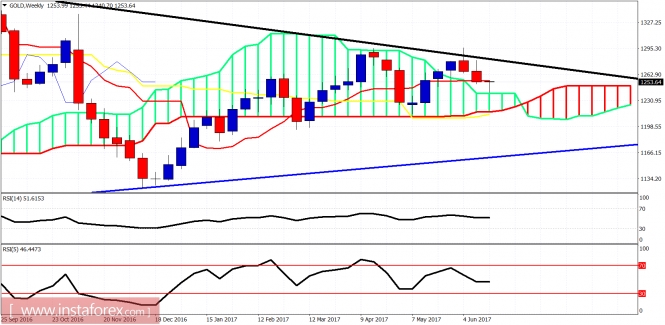
Black line -long-term resistance Blue line - long-term support Gold price remains trapped inside the weekly triangle pattern. Price got rejected again at the long-term resistance channel. Price has broken out and above the weekly Kumo and has successfully back tested the Kumo (cloud) support. A break above the black trend line will be a very bullish signal. It is not clear however if we first test the long-term blue trend line first or break right away.
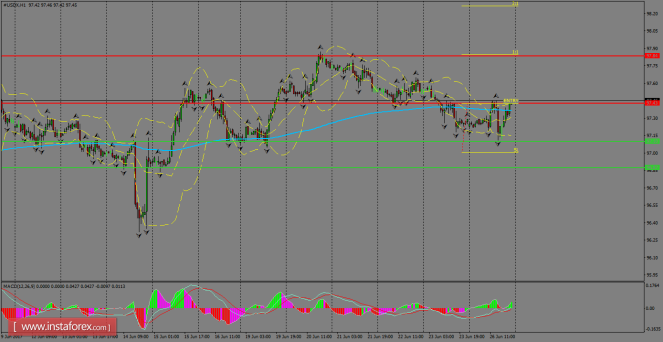
USDX is being capped by the resistance level of 97.42 and it's targeting the resistance level of 97.84 as the next key area for sellers. There is not a clear trend in the index amid sideways' start of the week for most of the markets. If the support level of 97.10 gives up in favor of the bears, then it can decline towards 96.87.
H1 chart's resistance levels: 97.43 / 97.84 H1 chart's support levels: 97.10 / 96.87 Trading recommendations for today: Based on the H1 chart, place buy (long) orders only if the USD Index breaks with a bullish candlestick; the resistance level is at 97.43, take profit is at 97.84 and stop loss is at 97.00.
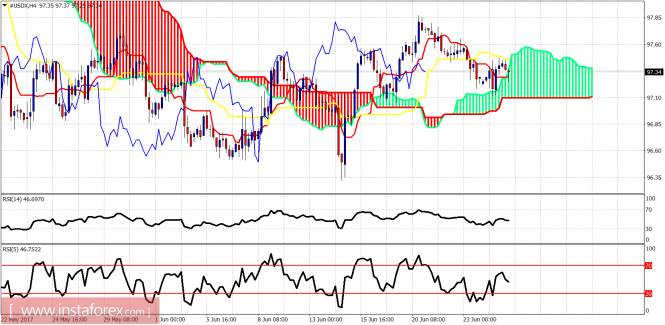
Ichimoku indicator analysis of USDX for June 27, 2017
The Dollar index is holding short-term support. We might eventually see the bounce towards 98.50-99 we were expecting after all. This is not the time to be bearish on the Dollar.
The Dollar index is holding above cloud. Short-term support is at 97. Resistance is at 97.50. Break above 97.50 and it will be almost certain that the June high of 97.85 will be broken.
Blue lines - bearish channel We continue to expect the Dollar index to move upwards and sideways towards the upper channel boundary. The bullish divergence signs in the weekly chart imply that next couple of weeks should continue and favor the Dollar. Despite the weekly Kumo below, there are no selling strength...and this is depicted in the divergence. That is why I expect a bounce first.
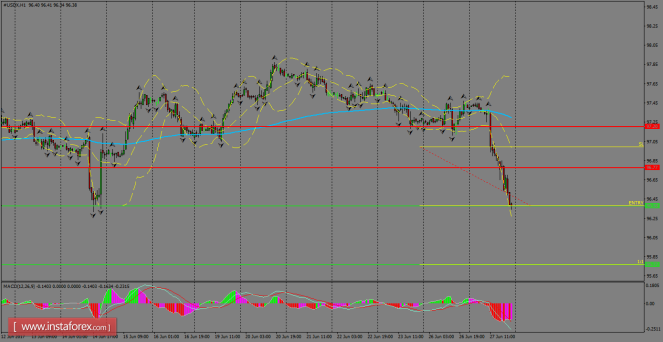
The index was under a heavy selling pressure during Tuesday's session, pushing lower towards 96.38, where is located the immediate support for the greenback. If that level gives up, we can witness a downside's continuation towards the support area of 95.77. To the upside, if USDX does a rebound, it can retrace back towards 96.77.
H1 chart's resistance levels: 96.77 / 97.20 H1 chart's support levels: 96.38 / 95.77 Trading recommendations for today: Based on the H1 chart, place sell (short) orders only if the USD Index breaks with a bearish candlestick; the support level is at 96.38, take profit is at 95.77 and stop loss is at 97.00.
Ichimoku indicator analysis of USDX for June 28, 2017
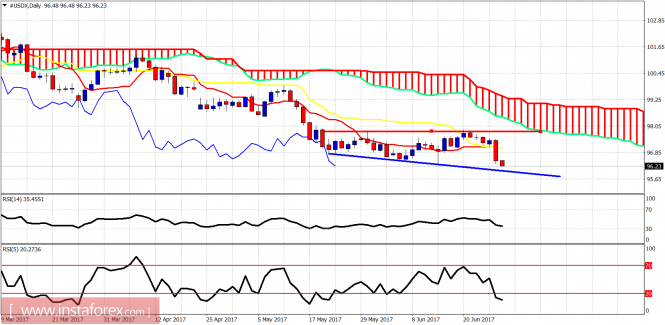
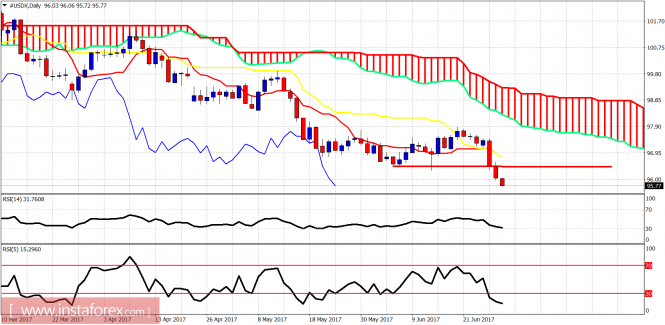
Red line - resistance Blue line - support Price has broken below the Tenkan- and Kijun-Sen on the daily chart. The index has been forming something like a megaphone for the last few weeks and this provides a support at 95.70. However, I believe that the move that started just below 98 last week is not going to stop there but much lower. The consolidation of the last few weeks is being broken downwards.
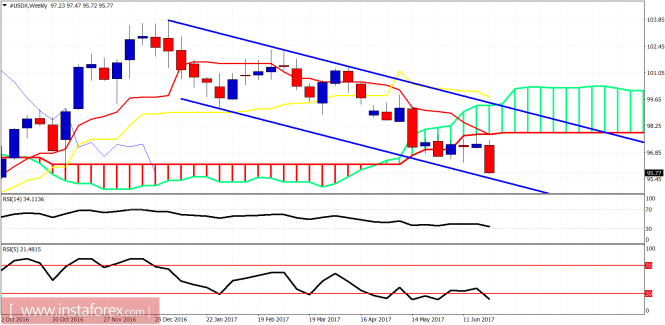
Blue lines - bearish channel The rejection from the Ichimoku cloud was a stronger bearish signal than the bullish divergence by the RSI(5). The trend remains bearish as a new weekly low is made. We have to wait and see if the RSI indicators provide a new low or a new divergence.
Ichimoku indicator analysis of USDX for June 29, 2017
The Dollar index has made new lower lows towards 95 as expected after breaking 96.50. This level is now important support. Trend is clearly bearish.
Red line - resistance Price in the daily chart is below the tenkan- and kijun-sen indicators. Price is making lower lows and lower highs. Oscillators are oversold. Support now at 95. Resistance at 96.50.
Blue lines - bearish channel Price approaching the lower channel boundary again. RSI (5) oversold and diverging. Weekly trend is bearish as price is below the Kumo. Important weekly resistance is now at 98. Channel resistance is at 98.50.
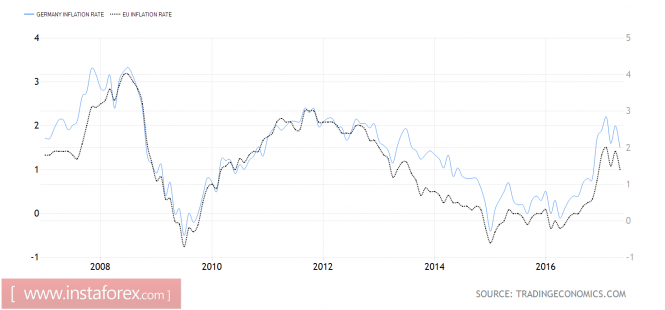
The EUR/USD continues to rise to multi-month highs, as investors speculate over what Mario Draghi recently said. The unease associated with the words "normalization of monetary policy", "reflation", "temporary nature of slowing inflation", is gradually taking place, which leads to the question of "what next?". In fact, the president of the ECB noted that inflationary forces are currently fragile, which requires the presence of accommodative monetary policy. The speech of Vitor Constancio has its own reason as the Vice-President of the European Central Bank did not see anything new in his leader's speech. According to Mario Draghi, as the euro area's GDP recovers, monetary policy becomes more accommodative, and the ECB should gradually normalize it, in order to leave it at a level that reaches economic development. This certainly makes sense, however such remarks are enough to compel the market to follow orders to BUY or SELL. No one will wait for a long period of time. Something similar also happened to the EUR/USD. It is clear that more solid foundations are needed to extend the rally: the support of the stock market, further improvement of macroeconomic data from the euro area and the gradual recovery of inflation. There are problems with the latter. According to forecasts of Bloomberg experts, both German and European CPI in June are seen to slow down, which will force the ECB to reconsider before they unwind the Quantitative Easing programme. The dynamics of German and European inflation