Ichimoku indicator analysis of USDX for July 3, 2017
The Dollar index remains in a bearish trend. There are signs of a possible upward reversal at least for the short-term, so Dollar bears should be very cautious.
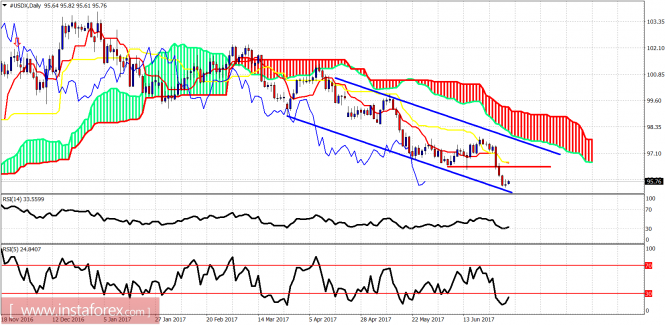
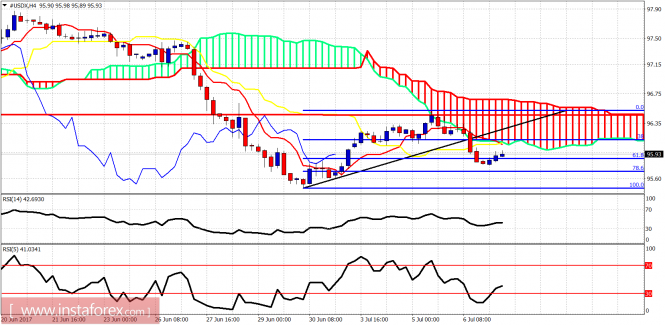
Blue lines - bearish channel Red line - resistance Price is inside a bearish channel. Price is trading below both the tenkan- and kijun-sen indicators. RSI (5) is oversold and turning upwards. This is a bullish short-term sign. This implies that a bounce towards the red line resistance and previous support is highly possible for the start of the week.
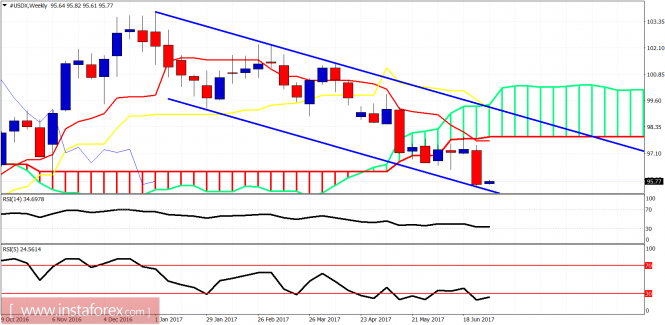
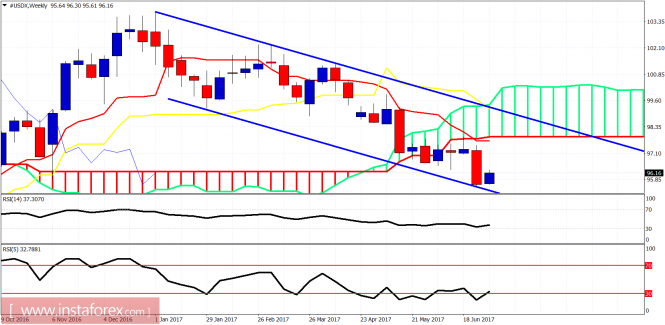
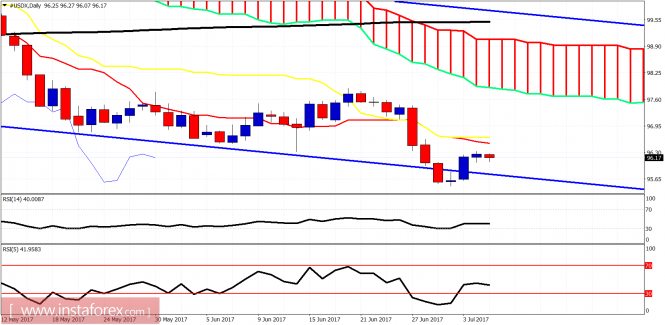
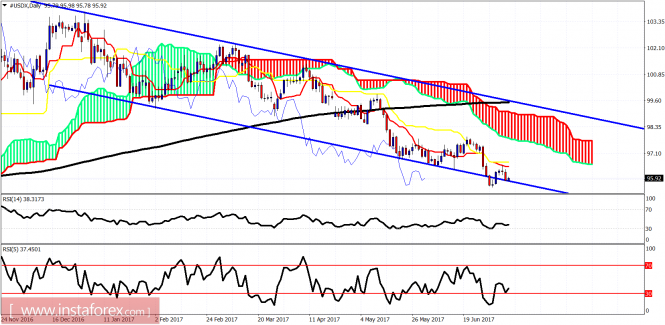
Blue lines - bearish channel The weekly trend is bearish. The oscillators are diverging and the price is touching the lower channel boundary. A bounce towards the upper channel boundary or at least the lower Kumo boundary is justified. So a bounce towards 98-98.50 is awaited. No reversal confirmation yet. Bears should be cautious.
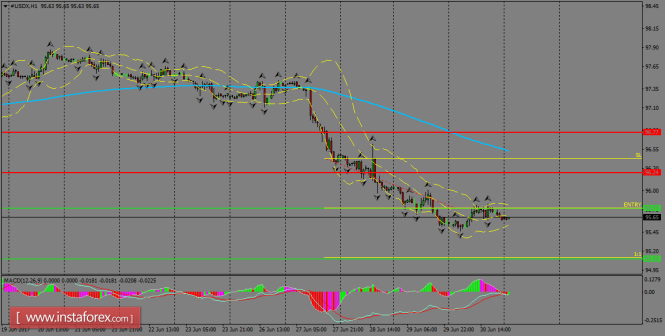
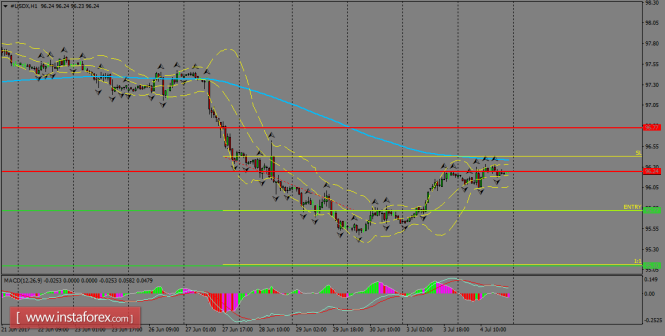
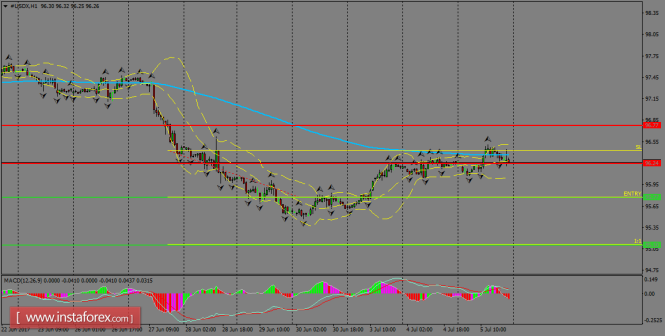
USDX ended last week in the red territory and it looks like we can expect some recovery to test the 200 SMA at H1 chart around 96.50. If the index manages to break above the resistance zone of 95.77, then that scenario could be possible. Instead, if we witness a break of last Friday's lows, next interest area for buyers is located around 95.10.
H1 chart's resistance levels: 96.77 / 97.20 H1 chart's support levels: 96.38 / 95.77 Trading recommendations for today: Based on the H1 chart, place sell (short) orders only if the USD Index breaks with a bearish candlestick; the support level is at 95.77, take profit is at 95.10 and stop loss is at 96.42.
Ichimoku indicator analysis of USDX for July 4, 2017
The Dollar index is bouncing as expected. The price is now making the minimum bounce requirements towards short-term resistance and previous support at 96.50. Overall I expect a bigger Dollar index bounce towards 98.
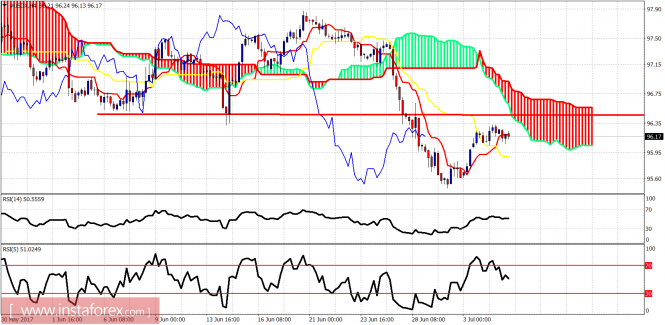
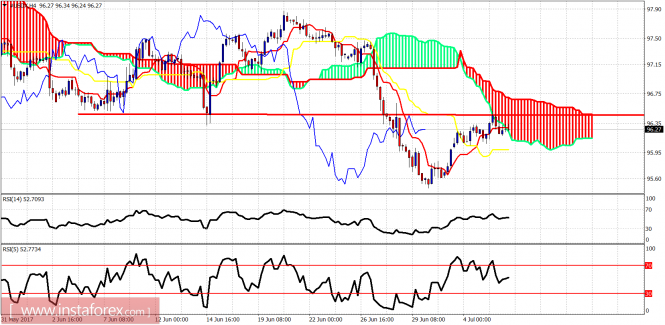
Red line - resistance Blue lines - bearish channel The Dollar Index is testing short-term resistance at 96.50 where we also find the 4-hour tenkan- and kijun-sen indicators. Oscillators bounce off oversold levels. I expect this bounce to continue higher.
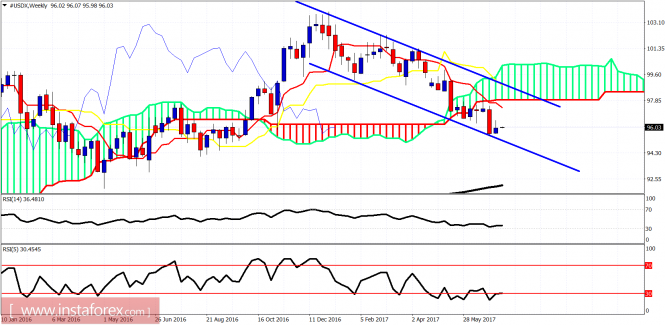
Blue lines - bearish channel On a weekly basis, although the trend is bearish and the price is below the weekly Kumo (cloud), I expect a short-term bounce for a week or two towards 98-98.50. The RSI is diverging and oversold. I expect at least a move towards the lower Kumo boundary.
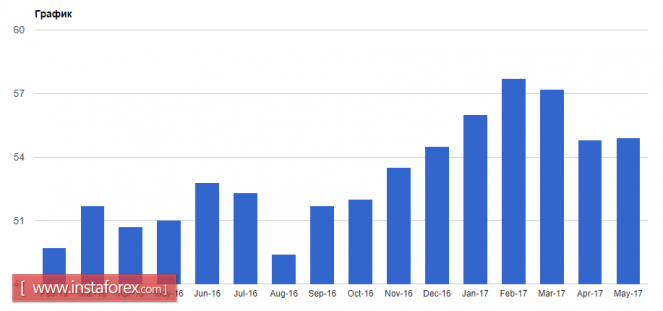
The versatile fundamental statistics of the US economy is preventing the US dollar from strengthening against the euro and the pound on Friday. According to the Chicago Business Barometer reported by the Fed-Chicago, business conditions rose from 59.4 in May to 65.7 in June. Meanwhile, data on US consumer sentiment showed a worsening situation which limited the demand for the US dollar. According to reports of the University of Michigan, consumer sentiment in the US for June was at 95.1 points versus 97.1 points in May. For today, the attention of traders will be focused on the unemployment rate in the euro area and the production data from the ISM Manufacturing Index in the US which is expected to grow.
The technical picture for the EURUSD pair suggests potential for a continued downward correction with a lower limit of 1.1385 with the first intermediate level of resistance in the range of 1.1425. Trading above this area will return the bullish momentum which will lead to the renewal of the next monthly maximum. Closing below 1.1385 for the day could seriously hit the position of buyers which may lead to the renewal at 1.1350. The Australian dollar and other commodity currencies also fell today against the US dollar despite activity growth in data China's manufacturing sector. According to the report of Caixin Media Co. and Markit, the final Purchasing Manager's Index for China's manufacturing sector in June reached 50.4 points compared to 49.6 points in May. It is to be noted that values above 50 indicate an increase in activity. The pressure on the Australian dollar today may remain before the Reserve Bank of Australia meeting. The event may increase the risk for the currency. The regulator will most likely keep interest rates unchanged as well as leave the same tone with no signals of monetary tightening or credit policy adjustments. As for the technical picture of the AUDUSD pair, the downward correction may be limited to the support of 0.7650 as big players gradually return to the market. This will further strengthen the Australian dollar to the monthly high of 0.7710 to 0.7755.
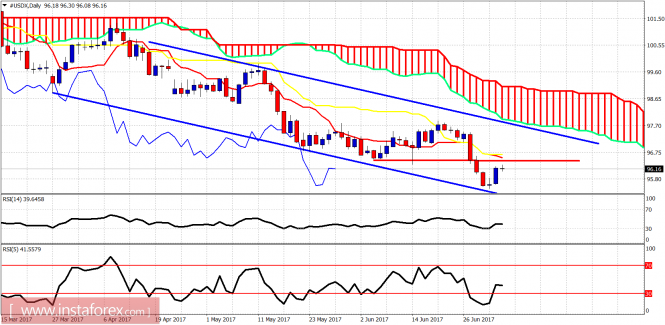
USDX had a comatose tone during Tuesday amid thin liquidity in the markets as the U.S holidays are dominating the scenario. The 200 SMA is close to the current price area and if that moving average gives up, then we might expect a continuation towards 96.77. To the downside, the target is still placed at the 95.77 level.
H1 chart's resistance levels: 96.77 / 97.20 H1 chart's support levels: 96.38 / 95.77 Trading recommendations for today: Based on the H1 chart, place sell (short) orders only if the USD Index breaks with a bearish candlestick; the support level is at 95.77, take profit is at 95.10 and stop loss is at 96.42.
Ichimoku indicator analysis of USDX for July 5, 2017
The Dollar index bounced as expected but found resistance at 96.50 and did not manage to break it. A rejection at current levels will imply a move lower below 95.
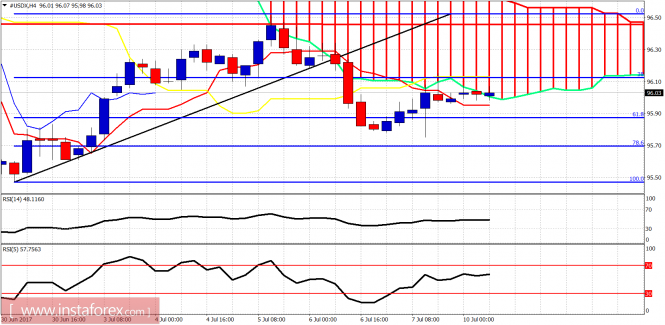
Red line - resistance Price is below the 4-hour Kumo and trying to hold above the tenkan- and kijun-sen indicators. Support is at 96 and resistance at 96.50. A break above 96.50 could push the index towards 98. A break below 96 will open the way for new lows towards 94.50.
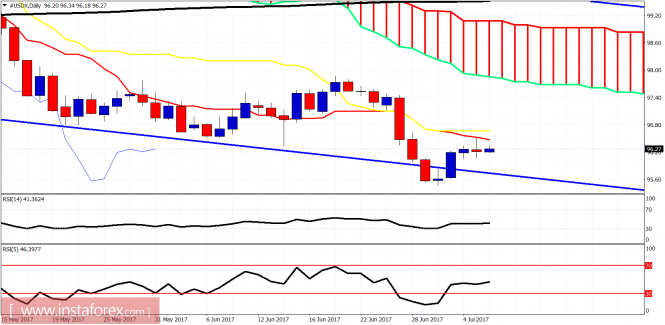
Daily resistance is found at 96.50-96.60. A break above it will open the way for a push towards the Daily Kumo at 97.80-98. The trend remains bearish as the price is still below both the tenkan- and kijun-sen. Overall I expect a bounce in the Dollar index towards 98.
Ichimoku indicator analysis of USDX for July 6, 2017
The Dollar index continued its bounce towards 96.5 resistance but got rejected. Bulls need to hold above 96 and make a higher low before the next leg up. Trend remains bearish and there is no trend reversal confirmation yet.
Red line - resistance The Dollar index bounced towards the 4-hour Kumo (cloud) and trend line resistance at 96.50 and got rejected. This increases the chances of making a new lower low. However if support at 96 holds, we could see a higher low being formed before the next leg up towards 98.50.
In the daily chart, the trend remains clearly bearish as price remains below both the tenkan- and kijun-sen indicators. Resistance is at 96.50-96.80 and if broken we should expect price to move towards the daily Kumo at 97.50-98.
The index is finding dynamic resistance around the 200 SMA area at H1 chart and the bears could appear in order to push lower to the greenback. However, if the bullish bias comes back to action, the next target would be the resistance level of 96.77, while a pullback should push lower the US Dollar Index to test the 95.77 level.
H1 chart's resistance levels: 96.77 / 97.20 H1 chart's support levels: 96.38 / 95.77 Trading recommendations for today: Based on the H1 chart, place sell (short) orders only if the USD Index breaks with a bearish candlestick; the support level is at 95.77, take profit is at 95.10 and stop loss is at 96.42.
Ichimoku indicator analysis of USDX for July 7, 2017
The Dollar index is making a higher low so far as the decline from the rejection at 96.50 has stopped around the 61.8% Fibonacci retracement. Trend remains bearish but I prefer to be on the lookout for a reversal.
Price is trading below both the tenkan- and kijun-sen indicators. Trend is bearish. But I believe we are in a process of making a higher low and then a new upward move should follow. Short-term resistance levels that need to be broken are at 96.30 and then at 96.55.
Blue lines - bearish channel Trading for so long on top of the lower channel boundary implies that an explosive upward move will come. Trend is bearish as price is below the tenkan- and kijun-sen indicators. Breaking above them (96.50-96.70) will be a very bullish sign and push price towards 98-98.50.
The Dollar index remains in a bearish trend although for the last couple of sessions we could be making at least a short-term low. I believe the upside has more potential than looking for the bearish side.
The Dollar index has retraced 61.8% of the recent rise from 95.50 to 96.50. Price remains below the 4-hour Kumo. Trend remains bearish. However the recent low could be the start of a new sequence of higher highs and higher lows. Important short-term resistance is at 96.30-96.50. Breaking it will be the first important sign of a reversal.
Blue lines - bearish channel The weekly chart remains bearish. Price is inside a bearish channel and below the weekly Kumo. However I believe we should expect a strong bounce towards 98.50-99. I believe we should bounce soon towards the lower Cloud boundary and the upper channel boundary.