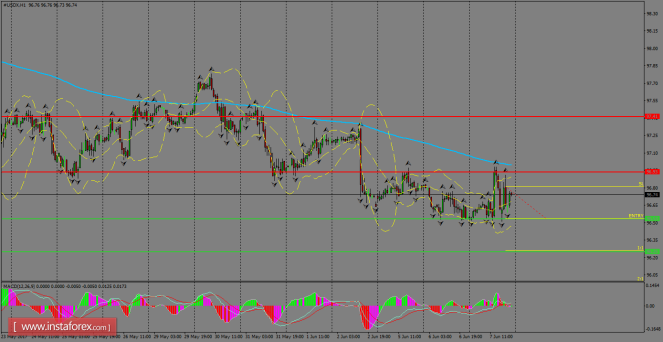
USDX continues to be supported by the 96.53 level and that's why bears cannot advance in the current structure. If that level gives up, we can witness an acceleration towards 96.25 in a first degree, as the US Dollar remains weak across the markets. To the upside, the 200 SMA at the H1 chart is the immediate resistance.
H1 chart's resistance levels: 96.93 / 97.41 H1 chart's support levels: 96.53 / 96.25
Trading recommendations for today: Based on the H1 chart, place sell (short) orders only if the USD Index breaks with a bearish candlestick; the support level is at 96.53, take profit is at 96.25 and stop loss is at 97.21.
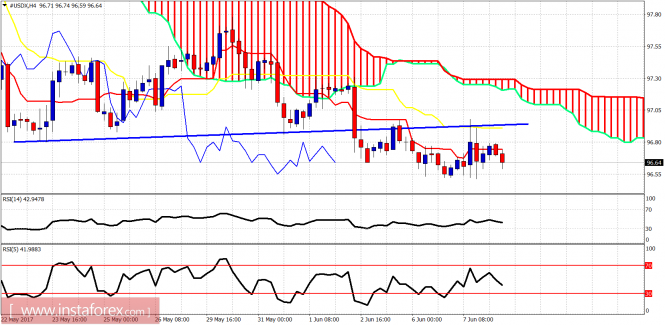
Ichimoku indicator analysis of USDX for June 8, 2017
The Dollar index bounced yesterday as we expected but got rejected at the first important short-term resistance. Yesterday's highs are now very important to the short-term trend. If broken we should expect price to move towards 99.
Blue line - resistance Previous support at 97 has turned into resistance. As expected, the index bounced yesterday and back tested it. However the rejection and inability to hold above 97 is a bearish sign that implies at least one more new lower low could be expected. It is not necessary but as long as we trade below 97, short-term trend remains bearish.
Red line- short-term resistance Blue lines - bearish channel In the daily chart, price is in a bearish trend below both tenkan- and kijun-sen. Price is inside a bearish channel and very close to the lower boundary. I expect a strong bounce to come soon that could push the index back towards the upper channel boundary and the daily Kumo (cloud) resistance at 99. There are bullish divergence signs by the RSI and this is a warning for Dollar bears to be cautious and lower their stops.
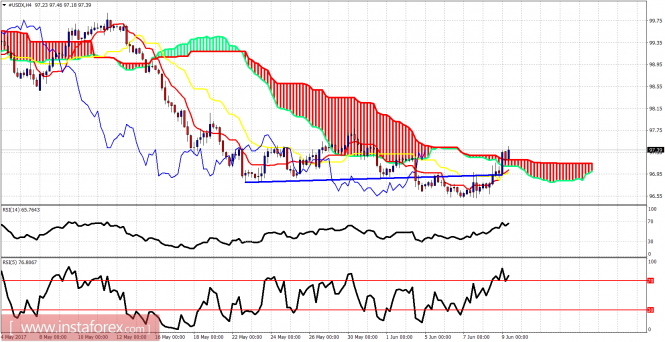
Ichimoku indicator analysis of USDX for June 9, 2017
The Dollar index has confirmed a short-term reversal as we anticipated in our previous analysis and is heading towards 99. The warning signs for Dollar bears were there and we warned them to protect their short positions as a strong bounce was anticipated. We are now bouncing and we have lots of upside room to move.
Blue line - resistance (broken) The Dollar index has broken out and above the blue trend line resistance and the 4-hour Ichimoku cloud. For the last few sessions I have been calling for a reversal and that I would at least prefer to be neutral rather than bearish. This was not the time to be short the Dollar index. We first need a bounce towards 99. Support is at 97-96.50 and resistance is at 98.50-99.
Red line - short-term resistance trend line Blue lines - bearish channel As expected in our last analysis, the Dollar index was expected to bounce off the lower channel boundary. Price has broken the red trend line resistance and is expected now to move towards the Daily Kumo (cloud). This is not the time to be short on Dollar. The Dollar index has just started its bounce.
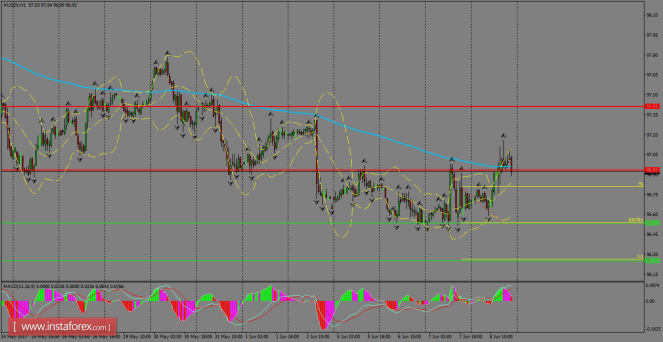
The index gained momentum during Thursday's session and it's challenging the strong resistance placed around 96.93, which is the last hurdle ahead of 97.41. Once USDX manages to consolidate above the 200 SMA at H1 chart, then it can go for higher levels and eventually for the psychological zone of 98.00. To the downside, we're still expecting a pullback towards 96.53.
H1 chart's resistance levels: 96.93 / 97.41 H1 chart's support levels: 96.53 / 96.25 Trading recommendations for today: Based on the H1 chart, place sell (short) orders only if the USD Index breaks with a bearish candlestick; the support level is at 96.53, take profit is at 96.25 and stop loss is at 97.21.
Ichimoku indicator analysis of USDX for June 12, 2017
The Dollar index showed reversal signs at the end of last week and we could see a strong bounce towards 99 as long as we trade above 97-96.50. Short-term trend is bullish as price has broken above the 4-hour Kumo (cloud).
Blue line - support The Dollar index has moved above the Kumo in the 4-hour chart and is back testing it now. I expect price to at least bounce towards the 38% Fibonacci retracement where the first important short-term resistance is found. I would then expect a pullback and then bounce towards the 61.8% Fibonacci level. But it is still too early for this. As I have been saying, the Dollar index is to be shorted higher and not around 97.
Blue lines - bearish channel Red line - trend line resistance (broken) In the Daily chart, the index has broken the short-term trend line resistance. Price is bouncing and I expect at least a move towards the kijun-sen (yellow line indicator). However there are good chances of testing cloud resistance around 99, so bears should be very patient as they will get better prices. For now I remain bullish or at least neutral the Dollar index waiting for higher levels to sell.
The index found support around the 200 SMA at H1 chart as the greenback was under selling pressure in Monday's session. If USDX manages to recover above the resistance zone of 97.41, then it can rally towards 97.75 in a first degree, but the downside continuation is still a high possibility. MACD indicator is turning neutral to negative, favoring further weakness.
H1 chart's resistance levels: 97.41 / 97.75 H1 chart's support levels: 97.22 / 96.95 Trading recommendations for today: Based on the H1 chart, place buy (long) orders only if the USD Index breaks with a bullish candlestick; the resistance level is at 97.41, take profit is at 97.75 and stop loss is at 97.07.
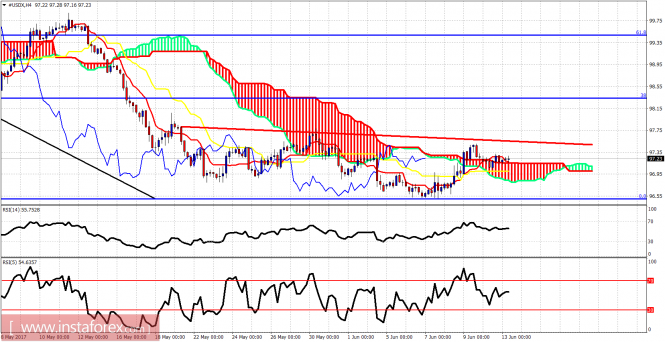
Ichimoku indicator analysis of USDX for June 13, 2017
The Dollar index continues to point to a bounce towards 98.5-99 and I continue to favor the bullish side. I believe that only after a bounce towards 99 we should look to short the index again.
Red line - short-term resistance The Dollar index is trying to break above and remain above the 4-hour Kumo (cloud). Short-term trend has changed to bullish and short-term support is at 97 where the 4-hour kijun-sen is found. Resistance is at 97.50. If broken, we will have started the move to 98.50-99.
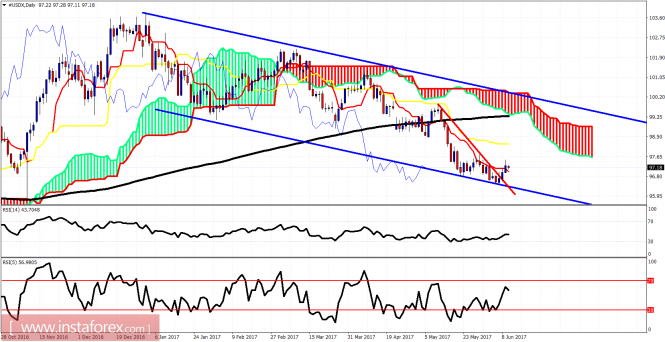
Blue lines - bearish channel The Dollar index has broken below the weekly Kumo. Weekly trend is bearish. However, I would expect a bounce back inside the Kumo and towards the upper channel boundary or at least the lower cloud boundary at 98. I remain short-term bullish about the Dollar index.
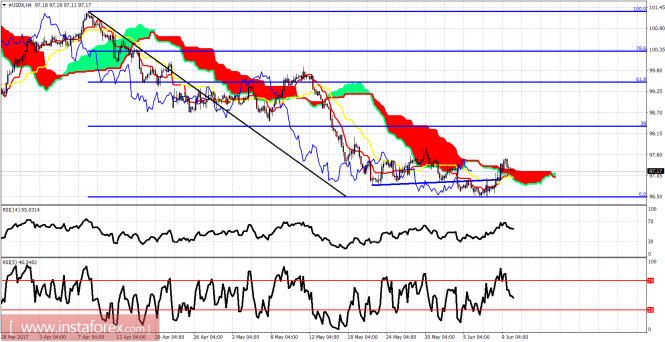
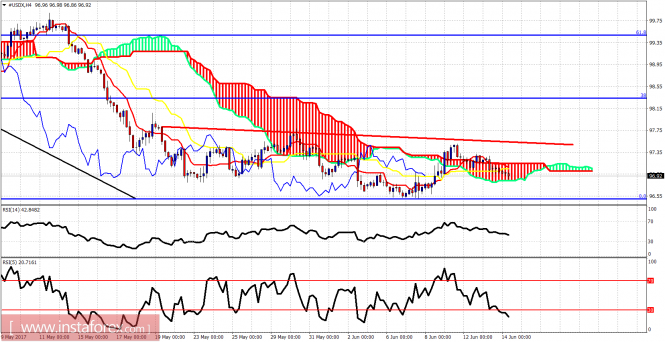
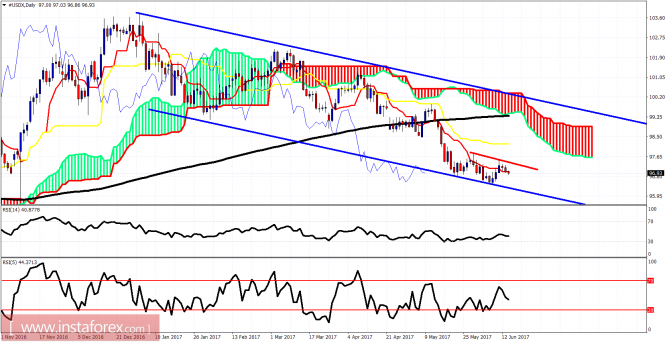
Ichimoku indicator analysis of USDX for June 14, 2017
The dollar index shows reversal signs but it is not reversing actually. The trend remains bearish. I continue to believe this is not the time to be go short. I still expect that the price will bounce towards 99 before moving towards low 90's.
Red line - short-term resistance The price has fallen back inside the 4 hour Kumo. The trend is neutral. Support is being tested now. Resistance remains at 97.50. A break above 97.50 will push the index much higher towards 98.50-99. The 38% Fibonacci retracement is the most probable first target for the bounce.
Blue lines - bearish channel Red line - resistance trend line The Dollar index continues to diverge and is very close to the lower channel boundary below the Daily Kumo and the 200 MA. The trend is clearly bearish and I continue to expect it to remain like this even after the strong bounce. I still think that a strong bounce should push price towards the daily Kumo and then reverse lower. The Dollar index is oversold at current levels.
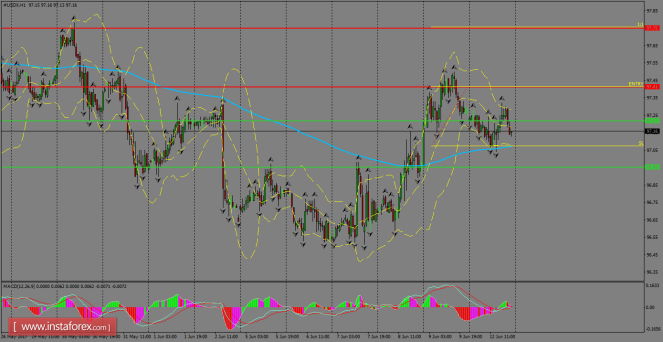
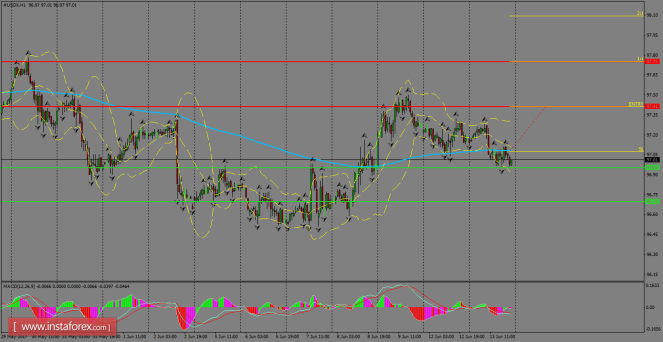
USDX continues with the corrective move that started during June 9th session and it's now finding support around 96.95. The 200 SMA at the H1 chart is acting as dynamic support and it might bring some momentum in order to reach the resistance level of 97.41. If the index manages to break above that area, then it can test the 97.75 level.
H1 chart's resistance levels: 97.41 / 97.75 H1 chart's support levels: 96.95 / 96.70 Trading recommendations for today: Based on the H1 chart, place buy (long) orders only if the USD Index breaks with a bullish candlestick; the resistance level is at 97.41, take profit is at 97.75 and stop loss is at 97.07.