Ichimoku indicator analysis of USDX for May 23, 2017
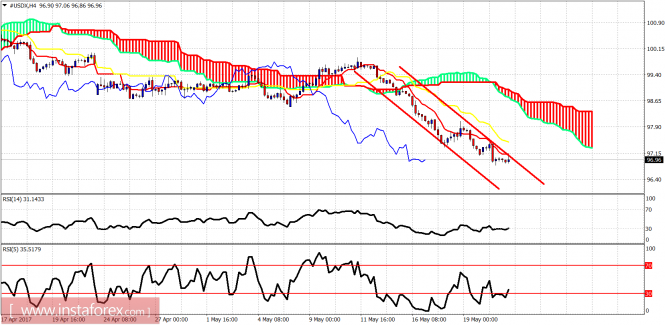
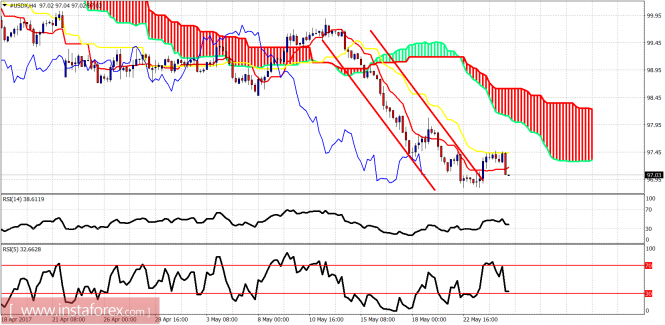
The Dollar index remains in a bearish channel. Trend remains bearish. I favor a dollar bounce this week from current levels but we still have no confirmation of a reversal.
Red lines - bearish channel Short-term resistance by the tenkan- sen is at 97.12 and by the kijun-sen at 97.47. Cloud resistance and target of the bounce expected is at 98.60-99. The RSI is diverging on the 4-hour chart.
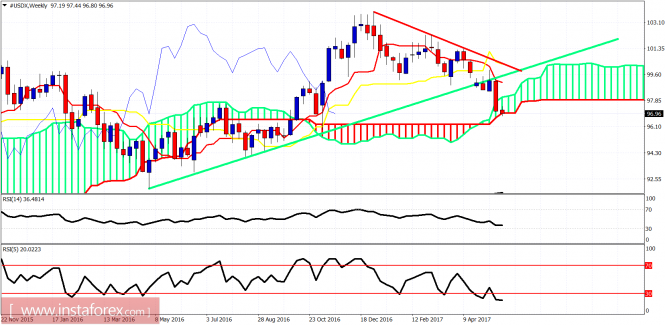
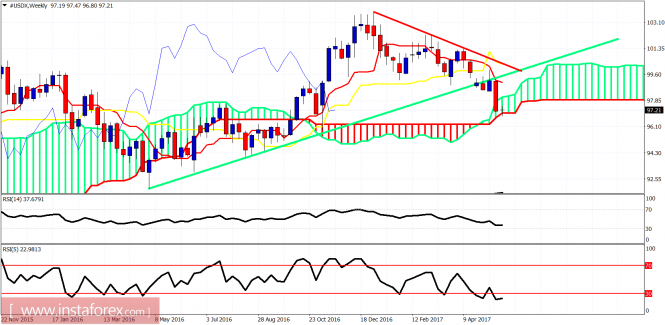
Red line - resistance Green line - long-term trend line support (broken) The weekly candle is testing the weekly Kumo support at 96.90-97 area. The RSI is oversold on a weekly basis. This is not the time be shorting but to be looking reversal signs. The bounce that will come will give a better opportunity and a better selling price level higher. Traders need to be patient. Aggressive traders will also look to play the bounce once we get the first short-term reversal signals.
Ichimoku indicator analysis of USDX for May 24, 2017
The Dollar index is turning higher as we expected. We have been waiting for a strong bounce in the Dollar index targeting the 98.50-99 area. Being bearish the Dollar index the last couple of days was wrong with no good risk reward ratio.
The Dollar index is now testing the 4-hour kijun-sen resistance. Price is expected to move towards the Kumo at 98 at least if not higher towards the 99 level where we also find the 61.8% Fibonacci retracement of the latest decline. Support is at 97. The trend is about to change in the short-term trend to bullish soon.
Red lines - triangle Black line - long-term support trend line (broken) Price has reached important weekly support at the Kumo. The price was expected to bounce off this area and this is what we get right now. The Dollar index is at least expected to bounce towards 99-99.50 area if not something bigger. This is not the time to be bearish the Dollar. If one is longer-term bearish should wait for the bounce to sell higher. Weekly resistance is now at 98.50-99 where we find the broken triangle.
Ichimoku indicator analysis of USDX for May 25, 2017
The US dollar index bounced as expected but found formidable resistance at 97.50 and got rejected. As long as we hold above the May lows, bulls have some hopes for a bigger bounce towards 99.
Red lines - bearish channel Though the price broke out of the bearish channel, the bounce reached only the kijun-sen (yellow line indicator) in the 4 hour chart but not the Kumo (cloud) as we hoped. However, the bounce might still be incomplete so we have to be patient as long as we trade above the May lows.
Red line - resistance Green line - support The weekly chart is dangerously turning weekly trend to bearish, especially if this week closes below the Kumo cloud. We are at the very important weekly support. I continue to believe that a bounce is quite possible towards 99. One need to be patient and wait and see.
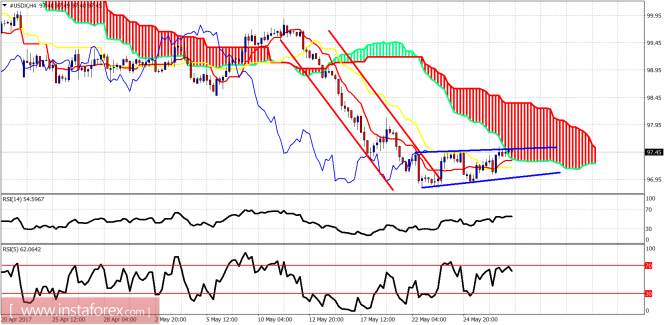
Ichimoku indicator analysis of USDX for May 26, 2017
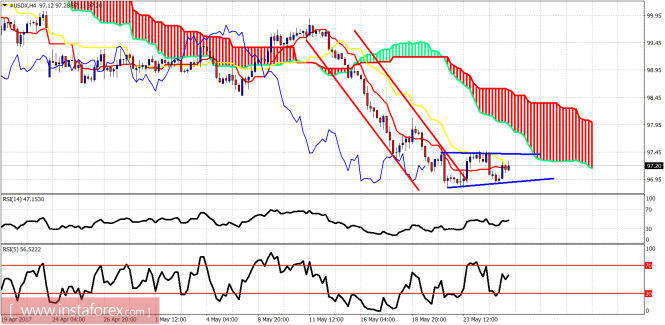
The Dollar index is moving sideways. Price has formed a triangle pattern. Soon we will have a breakout. I believe it is more probable to break to the downside towards 96 before a bigger bounce higher.
Blue lines - triangle pattern The Dollar index remains below the 4-hour Kumo (cloud). Trend remains bearish as price cannot even break above the kijun-sen indicator. Support is at 96.90 and resistance is at 97.45. I believe it is more probable to break to new lows before a bigger bounce.
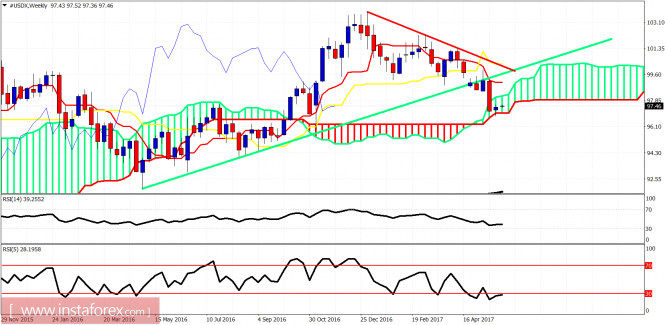
Red line - resistance Green line - broken support trend line Price is still at the edge of the weekly cloud. Price is at very important support. We could see the Kumo break but I believe a bigger reversal bounce will come over the next weeks. 96 is the next target if the short-term triangle is broken.
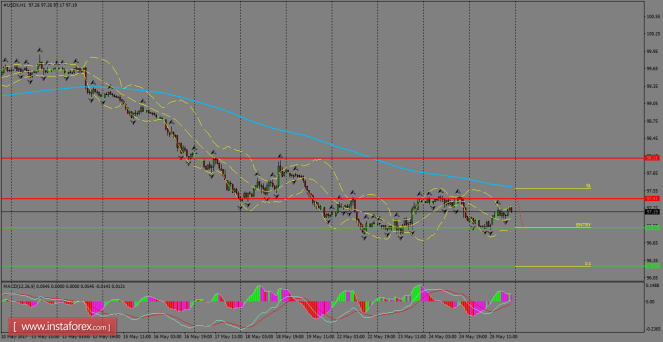
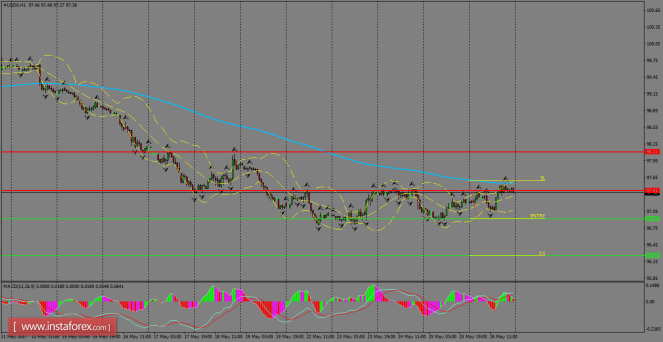
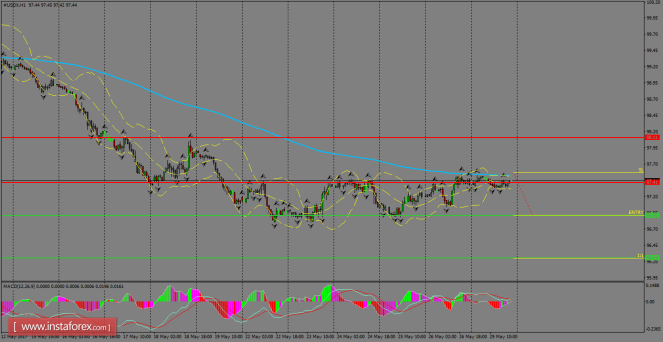
The index held its structure above the support zone of 96.90, as the bears didn't have the enough power to continue following the downside path. Overall, a corrective move is coming and that should happen when USDX manages to break above the resistance level of 97.41, with the next target placed around 98.11, which is also above the 200 SMA on H1 chart.
H1 chart's resistance levels: 97.41 / 98.11 H1 chart's support levels: 96.90 / 96.25 Trading recommendations for today: Based on the H1 chart, place sell (short) orders only if the USD Index breaks with a bearish candlestick; the support level is at 96.90, take profit is at 96.25 and stop loss is at 97.56
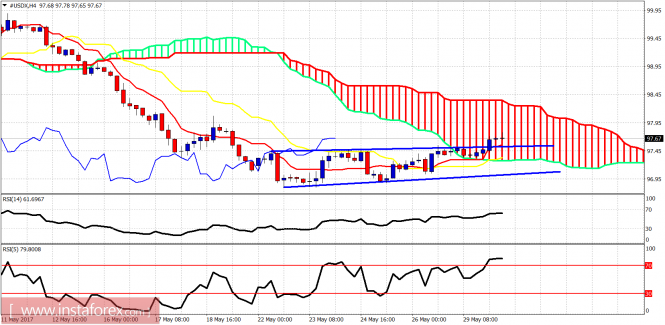
Ichimoku indicator analysis of USDX for May 29, 2017
The Dollar index as expected is showing signs of reversal off the weekly Kumo. I continue to expect the Dollar index to strengthen significantly from current levels.
Red lines - bearish channel Blue lines - trading range The Dollar index has broken out of the bearish channel but remains below the 4-hour Kumo (cloud) and inside a sideways trading range. Cloud resistance is found at 97.50. Support is at 97.
Red line - resistance Green line - former long-term support trend line The weekly candle is still above the weekly Kumo (cloud). The bounce is starting and it is a positive sign the fact that we did not break below cloud. I continue to expect a strong weekly bounce towards the upper cloud boundary or even the red downward sloping trend line. This is not the right time to be bearish about the US Dollar.
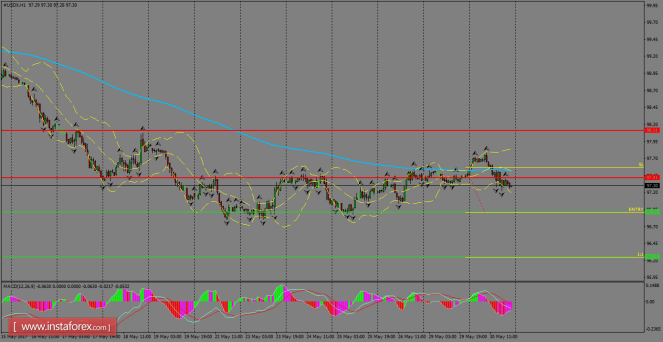
USDX was favored by a bullish momentum witnesses during Friday's session and the resistance level of 97.41 is helping to cap the bulls. Also, the 200 SMA is acting as dynamic resistance and we can expect that it continues to be a barrier for the buyers. However, if the index manages to pull back at the current stage, then it can plummet towards 96.90, which is the critical zone to pay attention during this week.
H1 chart's resistance levels: 97.41 / 98.11 H1 chart's support levels: 96.90 / 96.25 Trading recommendations for today: Based on the H1 chart, place sell (short) orders only if the USD Index breaks with a bearish candlestick; the support level is at 96.90, take profit is at 96.25 and stop loss is at 97.56.
Ichimoku indicator analysis of USDX for May 30, 2017
The Dollar index is showing reversal signs. This is not the time to be bearish on the Dollar. I expect a strong bounce higher in the Dollar index where we will get a better opportunity to sell the Dollar.
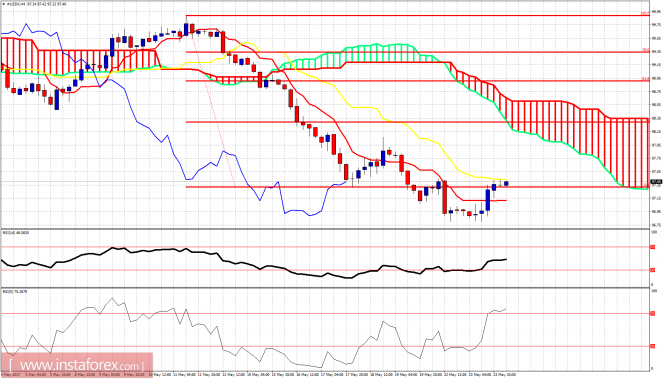
Blue lines - trading range The Dollar index has broken the trading range upwards. Price is inside the 4-hour Kumo. Trend has changed to neutral from bearish for the short term. Resistance is at 98.35. Support is at 97.28.
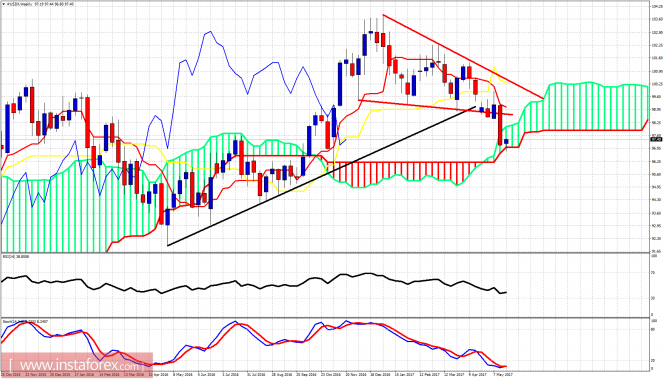
Red line - resistance Green line - long-term support trend line (broken) The Dollar index is bouncing off the weekly Kumo (cloud). This is the time for the Dollar to bounce. The Dollar is expected to move towards 99 or even higher. I'm bullish on the Dollar at current levels for at least a short-term bounce.
The index remained in sideways during the Memorial Day in the United States, capped by the 200 SMA at H1 chart. The bears are still strong across the greenback and we can expect some declines towards 96.90. However, if USDX manages to break above the 200 SMA, it's expected to see a rally that tests the resistance area of 98.11.
H1 chart's resistance levels: 97.41 / 98.11 H1 chart's support levels: 96.90 / 96.25 Trading recommendations for today: Based on the H1 chart, place sell (short) orders only if the USD Index breaks with a bearish candlestick; the support level is at 96.90, take profit is at 96.25 and stop loss is at 97.56.
USDX struggled to consolidate above the 200 SMA at H1 chart, as the bears were the main driver of the index during Tuesday's session. Currently, it's targeting the support zone of 96.90 with bearish projections towards the 96.25 level. To the upside, the next resistances are still placed around 97.41 and 98.11. MACD indicator still supports the bearish's scenario.
H1 chart's resistance levels: 97.41 / 98.11 H1 chart's support levels: 96.90 / 96.25 Trading recommendations for today: Based on the H1 chart, place sell (short) orders only if the USD Index breaks with a bearish candlestick; the support level is at 96.90, take profit is at 96.25 and stop loss is at 97.56.