
HFM
Active+ Member
- Messages
- 2,558
- Joined
- Jun 26, 2014
- Messages
- 2,558
- Reaction score
- 4
- Points
- 35
Date: 30th September 2026.
Gold Rebounds Temporarily? Weaker US Data and Yields Offer Support.

Gold rebounds on Tuesday as the bearish trend takes a pause and investors purchase at the lower price. Gold has now been in a downward-facing trend measuring 12.50% for five weeks. From the highest price in 2026 to now, the price is trading more than 25% lower. The price on Wednesday is trading higher, but what does the future look like for Gold?
Of particular interest was the quick and sudden decline seen on Monday. Gold fell more than 4% throughout all four sessions and with no attempt to rebound. The decline took the price to seven weeks now and close to the psychological price of $4,000. This is also key when analysing the rebound over the past 24 hours, as prices often rebound after such a sharp decline.
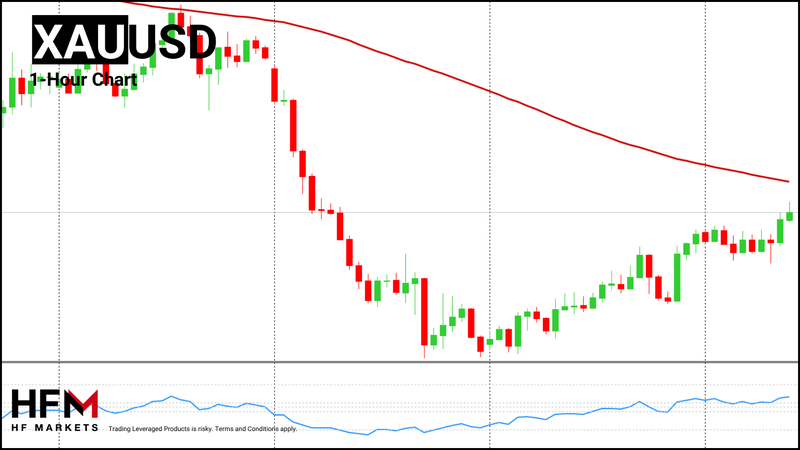
HFM - Gold 1-Hour Chart
Australia, which is one of the world’s inflation hotspots, saw its inflation fail to reach previous expectations of 4.1%. The same is also being seen in the UK and Japan. As a result, Gold seems slightly more attractive. The latest JOLTS report showed US job openings falling to around 7.08 million in August 2026, down from roughly 7.3 million in July. This points to softer labour demand. Hiring was broadly stable, quits remained subdued, and layoffs stayed relatively low, suggesting that employers are becoming more cautious about adding workers rather than making large-scale job cuts.
Another reason why Gold is attempting to rebound is the decline in oil prices and bond yields. Oil prices have fallen for three consecutive days, moving away from the $100 per barrel level which investors fear. Crude oil is now trading 14% lower than the most recent high.
Furthermore, the US 10-year Treasury yield fell 33 basis points to 5.23% on Wednesday but remains close to its highest level since 2007. Meanwhile, the 30-year yield rose as high as 5.62%, reaching levels last seen in 2002. The slight fall in bond yields also allows for Gold to retrace higher, but the persistently high levels remain a negative.
Traders should note that the rise currently does not remove all bearish signals, and pressure factors remain for Gold. In the upcoming days, key releases include the Core PCE Price Index, Final Gross Domestic Product and US Non-Farm Payroll data on Friday.
The same will apply to the upcoming Non-Farm Payroll figures scheduled for Friday. A weaker figure may support Gold, while a higher figure is likely to see the bearish trend potentially continue. These three releases are likely to determine the medium-term trend.
Currently, the possibility of an interest rate hike on October 28th is 45%, significantly lower than the 71% the day before. The reason for the fall is the weaker JOLTS Job Openings yesterday afternoon. However, this release is not enough to maintain momentum. In order for gold to continue to rise and rate hike expectations to fall, the NFP and PCE Index will need to fail to reach current expectations.
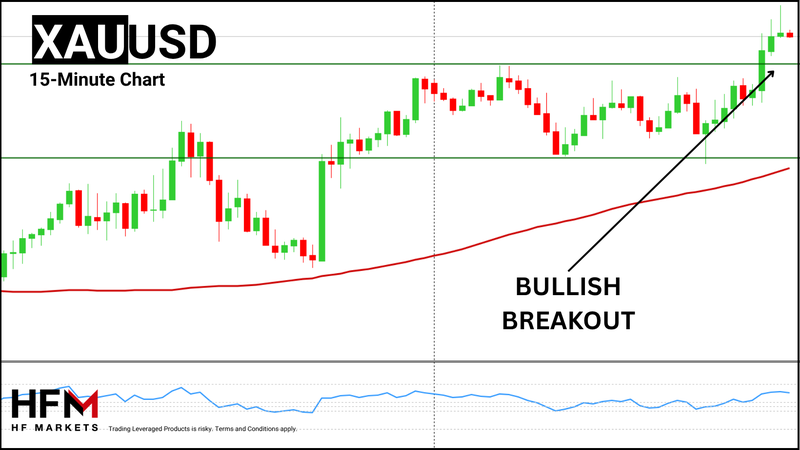
HFM - Gold 15-Minute Chart
On smaller timeframes, Gold maintains a neutral position and signal from most indications. The neutral sentiment is likely to remain between $4,166.85 and $4,187.60. A breakout of these levels may see indications strengthen. On the 15-minute timeframe, the price maintains a bullish indication while the 30-minute and larger timeframes maintain a bearish signal.
If the price breaks above the upper range bound area, bullish indications can materialise. Potential targets can be seen at the $4,213.60 level (at the 100-bar moving average) and $4,279.18 (Monday’s open price). To validate these indications, traders will ideally want to see weaker US data alongside rising prices across other metals.
A bearish breakout will see bearish sentiment rise and fall in line with the picture seen on larger timeframes. Stronger-than-expected releases will validate the decline with indications pointing towards a decline to $4,111.50 and $4,019.00.
Please note that times displayed based on local time zone and are from time of writing this report.
Click HERE to access the full HFM Economic calendar.
Want to learn to trade and analyse the markets? Join our webinars and get analysis and trading ideas combined with better understanding of how markets work. Click HERE to register for FREE!
Click HERE to READ more Market news.
Michalis Efthymiou
HFMarkets
Disclaimer: This material is provided as a general marketing communication for information purposes only and does not constitute an independent investment research. Nothing in this communication contains, or should be considered as containing, an investment advice or an investment recommendation or a solicitation for the purpose of buying or selling of any financial instrument. All information provided is gathered from reputable sources and any information containing an indication of past performance is not a guarantee or reliable indicator of future performance. Users acknowledge that any investment in Leveraged Products is characterized by a certain degree of uncertainty and that any investment of this nature involves a high level of risk for which the users are solely responsible and liable. We assume no liability for any loss arising from any investment made based on the information provided in this communication. This communication must not be reproduced or further distributed without our prior written permission.
Gold Rebounds Temporarily? Weaker US Data and Yields Offer Support.
Gold rebounds on Tuesday as the bearish trend takes a pause and investors purchase at the lower price. Gold has now been in a downward-facing trend measuring 12.50% for five weeks. From the highest price in 2026 to now, the price is trading more than 25% lower. The price on Wednesday is trading higher, but what does the future look like for Gold?
Of particular interest was the quick and sudden decline seen on Monday. Gold fell more than 4% throughout all four sessions and with no attempt to rebound. The decline took the price to seven weeks now and close to the psychological price of $4,000. This is also key when analysing the rebound over the past 24 hours, as prices often rebound after such a sharp decline.
HFM - Gold 1-Hour Chart
Gold - Weaker JOLTS Job Openings and Yields Allow A Rebound
In the past 24 hours, gold rose close to 1.90%, which is a moderate rise, but when compared with the previous decline, the rebound remains weak. The attempt to rebound is due to price attractiveness, weaker job vacancies and weaker-than-expected inflation from certain countries.Australia, which is one of the world’s inflation hotspots, saw its inflation fail to reach previous expectations of 4.1%. The same is also being seen in the UK and Japan. As a result, Gold seems slightly more attractive. The latest JOLTS report showed US job openings falling to around 7.08 million in August 2026, down from roughly 7.3 million in July. This points to softer labour demand. Hiring was broadly stable, quits remained subdued, and layoffs stayed relatively low, suggesting that employers are becoming more cautious about adding workers rather than making large-scale job cuts.
Another reason why Gold is attempting to rebound is the decline in oil prices and bond yields. Oil prices have fallen for three consecutive days, moving away from the $100 per barrel level which investors fear. Crude oil is now trading 14% lower than the most recent high.
Furthermore, the US 10-year Treasury yield fell 33 basis points to 5.23% on Wednesday but remains close to its highest level since 2007. Meanwhile, the 30-year yield rose as high as 5.62%, reaching levels last seen in 2002. The slight fall in bond yields also allows for Gold to retrace higher, but the persistently high levels remain a negative.
Traders should note that the rise currently does not remove all bearish signals, and pressure factors remain for Gold. In the upcoming days, key releases include the Core PCE Price Index, Final Gross Domestic Product and US Non-Farm Payroll data on Friday.
Gold - Economic Release To Drive Upcoming Swings
Markets are expecting the Core PCE Price Index to add a further 0.3% keeping the year on year figure at 3.3%. If the figure rises more than 0.3%, an October rate will almost become certain. However, a 0.4% rise has not been seen since February. If the Core PCE Price Index rises less than the current predictions, Gold may gain bullish momentum. The outcome of the release, along with the final GDP, will be key.The same will apply to the upcoming Non-Farm Payroll figures scheduled for Friday. A weaker figure may support Gold, while a higher figure is likely to see the bearish trend potentially continue. These three releases are likely to determine the medium-term trend.
Currently, the possibility of an interest rate hike on October 28th is 45%, significantly lower than the 71% the day before. The reason for the fall is the weaker JOLTS Job Openings yesterday afternoon. However, this release is not enough to maintain momentum. In order for gold to continue to rise and rate hike expectations to fall, the NFP and PCE Index will need to fail to reach current expectations.
Gold - Market Forecasts and Technical Analysis
HFM - Gold 15-Minute Chart
On smaller timeframes, Gold maintains a neutral position and signal from most indications. The neutral sentiment is likely to remain between $4,166.85 and $4,187.60. A breakout of these levels may see indications strengthen. On the 15-minute timeframe, the price maintains a bullish indication while the 30-minute and larger timeframes maintain a bearish signal.
If the price breaks above the upper range bound area, bullish indications can materialise. Potential targets can be seen at the $4,213.60 level (at the 100-bar moving average) and $4,279.18 (Monday’s open price). To validate these indications, traders will ideally want to see weaker US data alongside rising prices across other metals.
A bearish breakout will see bearish sentiment rise and fall in line with the picture seen on larger timeframes. Stronger-than-expected releases will validate the decline with indications pointing towards a decline to $4,111.50 and $4,019.00.
Key Takeaways:
- Gold is rebounding, but the broader trend remains bearish, with prices still sharply lower over the past five weeks.
- Weaker JOLTS data, lower oil prices and softer Treasury yields have helped support the recent recovery.
- Core PCE, US GDP and Non-Farm Payrolls are likely to drive Gold’s next major move and influence Fed rate expectations.
- Technical signals remain mixed, with short-term bullish momentum but larger timeframes still pointing to downside risk.
Please note that times displayed based on local time zone and are from time of writing this report.
Click HERE to access the full HFM Economic calendar.
Want to learn to trade and analyse the markets? Join our webinars and get analysis and trading ideas combined with better understanding of how markets work. Click HERE to register for FREE!
Click HERE to READ more Market news.
Michalis Efthymiou
HFMarkets
Disclaimer: This material is provided as a general marketing communication for information purposes only and does not constitute an independent investment research. Nothing in this communication contains, or should be considered as containing, an investment advice or an investment recommendation or a solicitation for the purpose of buying or selling of any financial instrument. All information provided is gathered from reputable sources and any information containing an indication of past performance is not a guarantee or reliable indicator of future performance. Users acknowledge that any investment in Leveraged Products is characterized by a certain degree of uncertainty and that any investment of this nature involves a high level of risk for which the users are solely responsible and liable. We assume no liability for any loss arising from any investment made based on the information provided in this communication. This communication must not be reproduced or further distributed without our prior written permission.


