HFM
Active+ Member
- Messages
- 2,573
- Joined
- Jun 26, 2014
- Messages
- 2,573
- Reaction score
- 4
- Points
- 35
Date: 15th October 2026.
CPI Shock Triggers ‘Risk-Off’ Sentiment: What It Means for Gold and the NASDAQ.

The US inflation rate, as well as core inflation data, reads higher than analysts' previous expectations. The US inflation rose from 3.4% to 3.7%, while core inflation rose to 2.6%. Both inflation readings are 0.1% higher than previous expectations, indicating that the Federal Reserve will almost certainly hike before year-end.
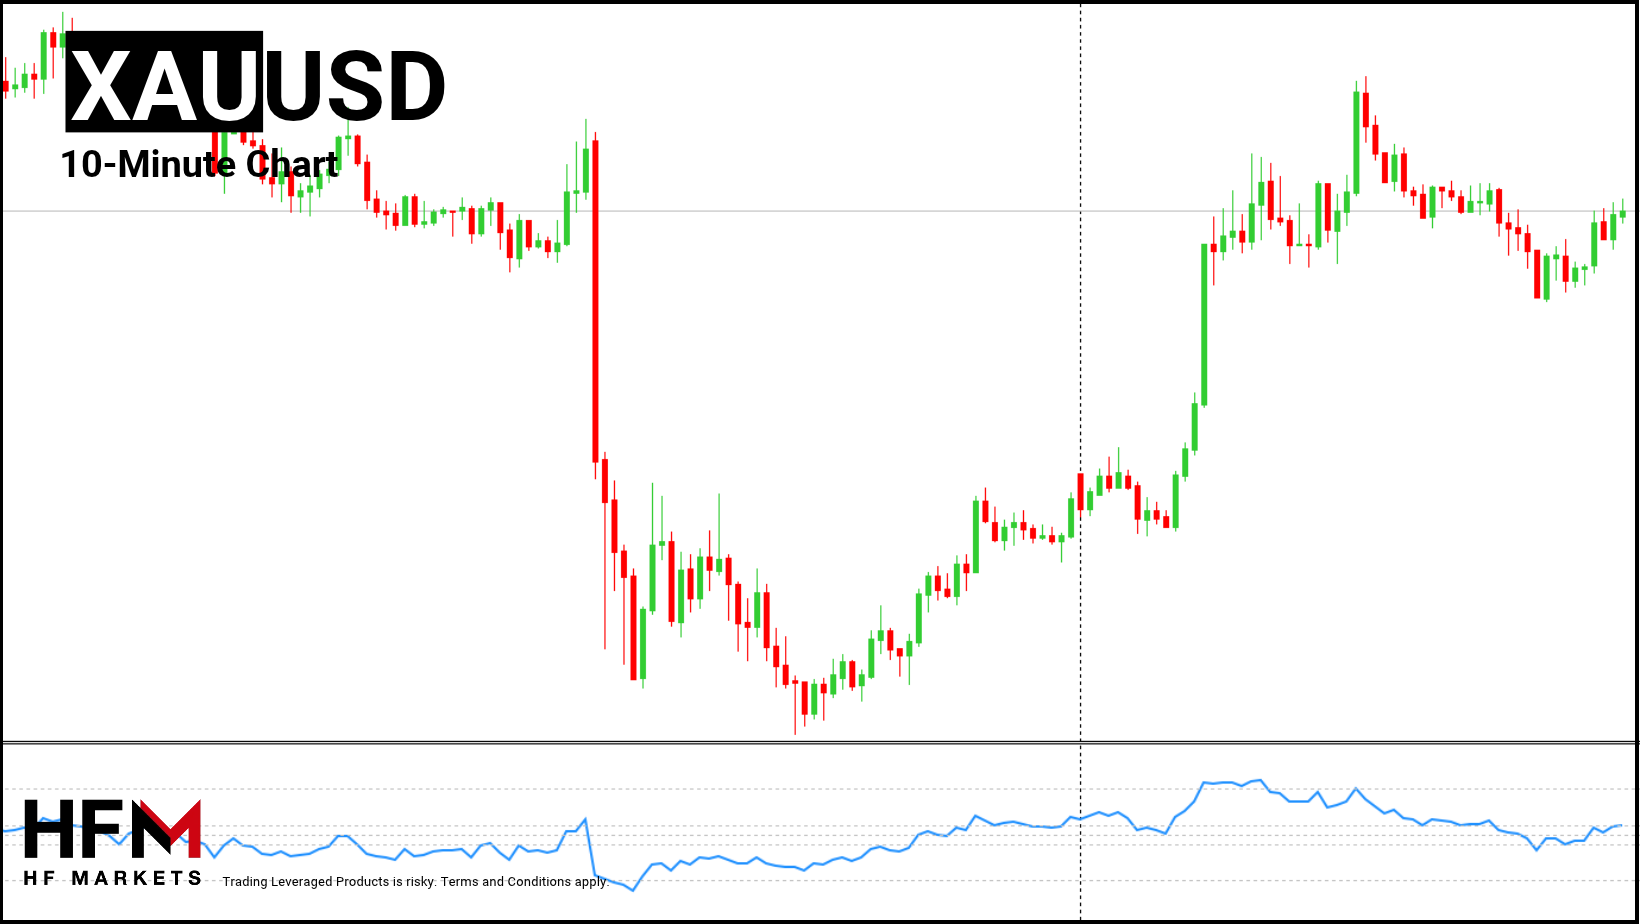
The reading was quick to trigger volatility and strong order flow as markets reacted. One of the most volatile assets was Gold, which fell 2.30% from high to low. However, the asset that had the most one-sided trend was the NASDAQ. The NASDAQ is currently trading at a four-week low.
Gasoline prices surged 9.1% during September, accounting for more than half of the monthly increase, while overall energy costs rose 5.2%. Inflation also affected housing, with shelter costs increasing 0.4%, alongside higher prices for airfares, used vehicles, recreation, and education.
Looking ahead, economists expect inflationary pressures to remain elevated, particularly if geopolitical tensions continue to disrupt energy supplies. Higher fuel and transportation costs could gradually affect other sectors, making inflation more difficult to control.
Lastly, markets have seen a surge in demand for bonds after the CPI release, indicating a move towards safer’ assets.
The reason for the original decline is that the impact the higher inflation figure has on the Federal Reserve, the US Dollar and bond Yields. Both bond yields and the US Dollar rose to new highs for 2026. In addition, markets are now considering a Federal Reserve rate hike for October.
Rate hikes, a strong Dollar, and high bond yields are known to pressure Gold. This is also one of the reasons why Gold has been in a bearish trend over the past eight weeks. However, the higher inflation reading eventually prompts a ‘risk-off’ appetite. As the ‘risk-off’ sentiment gains momentum, the mood towards gold improves.
Markets are now considering an economic slowdown. The Federal Reserve’s latest Beige Book highlights sluggish consumer spending, limited economic growth across several regions and signs of a softer labour market. Now, with higher inflation and oil prices remaining above $90 per barrel, economists believe a slowdown is plausible.
If employment and economic growth weaken, the US Dollar loses its attractiveness and demand for gold rises. At the same time, the Federal Reserve will not be able to hike rates further to bring inflation down, further supporting Gold.
For this reason, Gold is now correcting upwards, but technical analysts advise volatility in both directions is likely as investors weigh both positive and negative elements.
Investors are decreasing their exposure to the stock market and particularly to the AI trend. Economists are saying that risks are mounting and strong earnings are currently not adequate to offset other risks.
On one side, investors are considering higher bond yields, Fed hikes, high oil prices, and fears over AI security. So far, earnings and economic resilience have kept the market afloat. However, investors now fear an economic slowdown in 2027. As a result, investors are decreasing exposure.
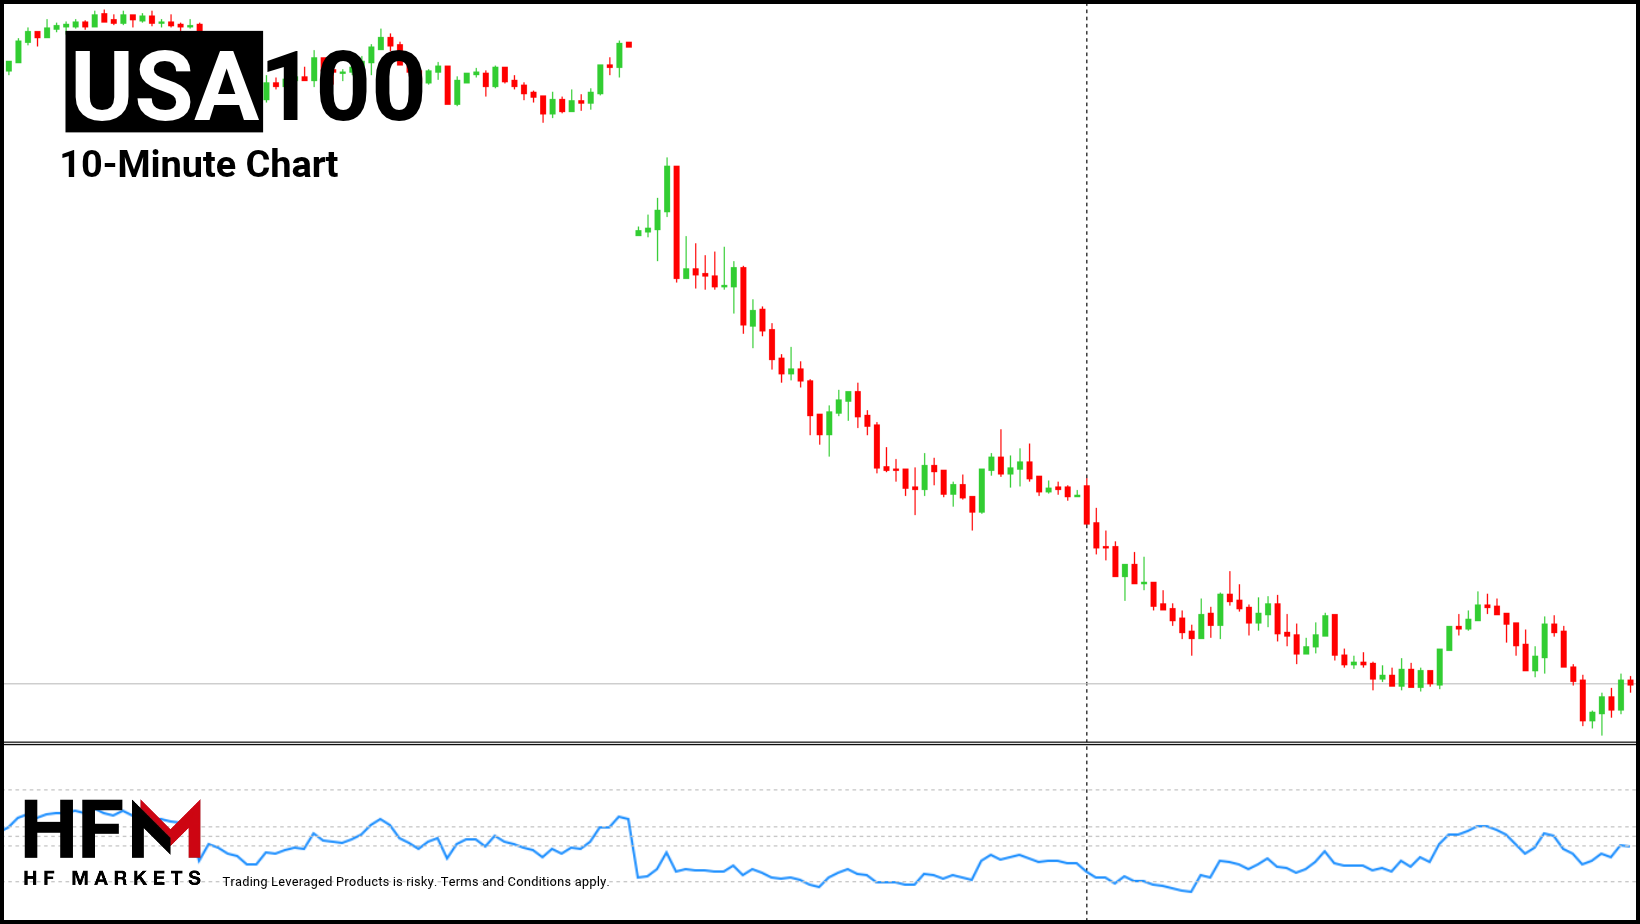 HFM - NASDAQ 10-Minute Chart
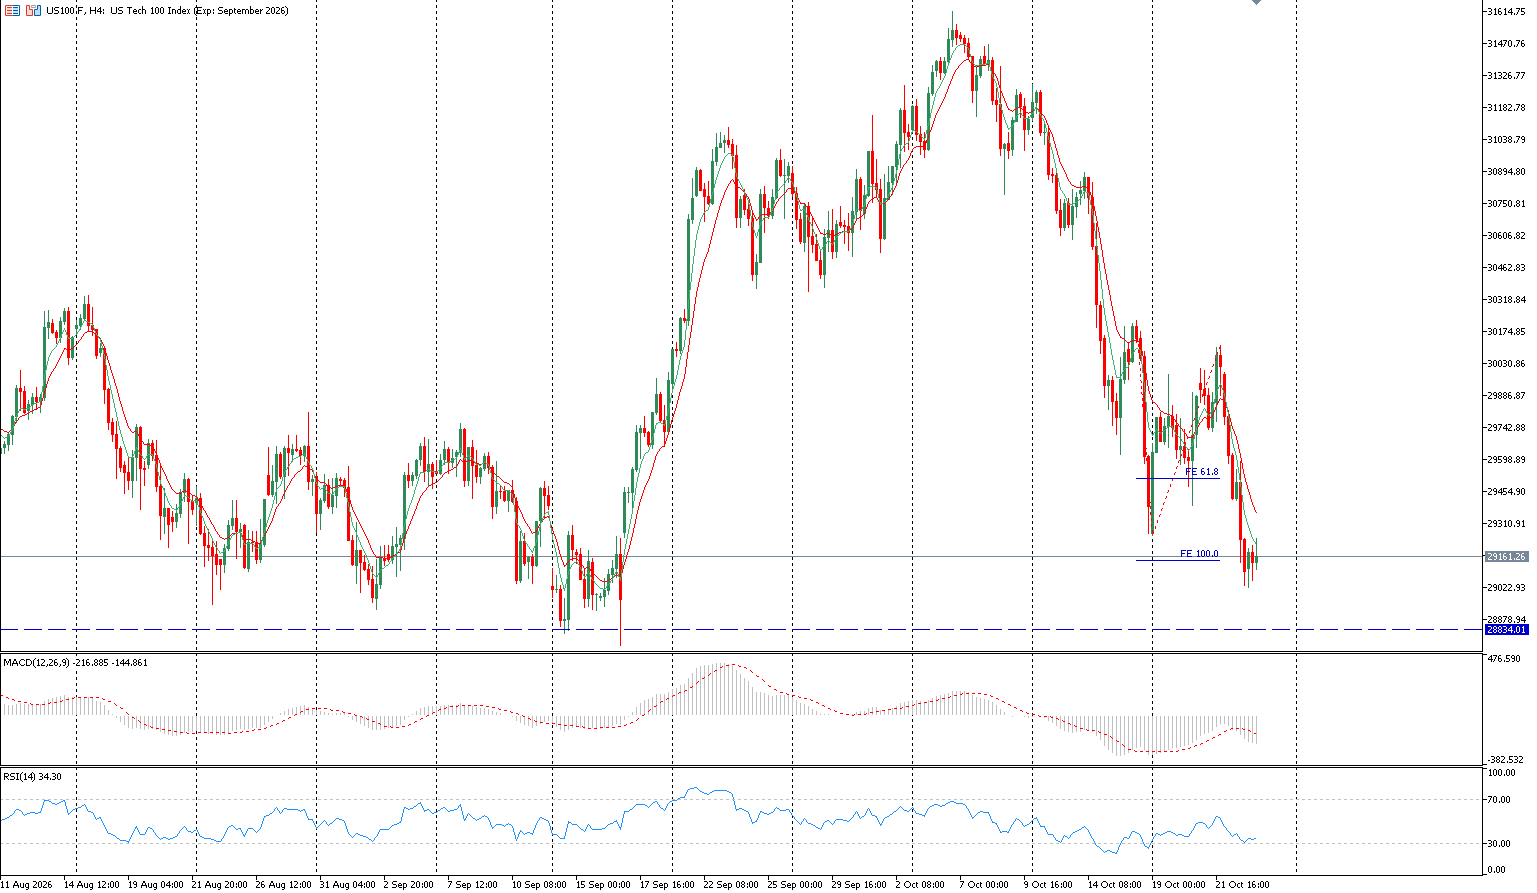
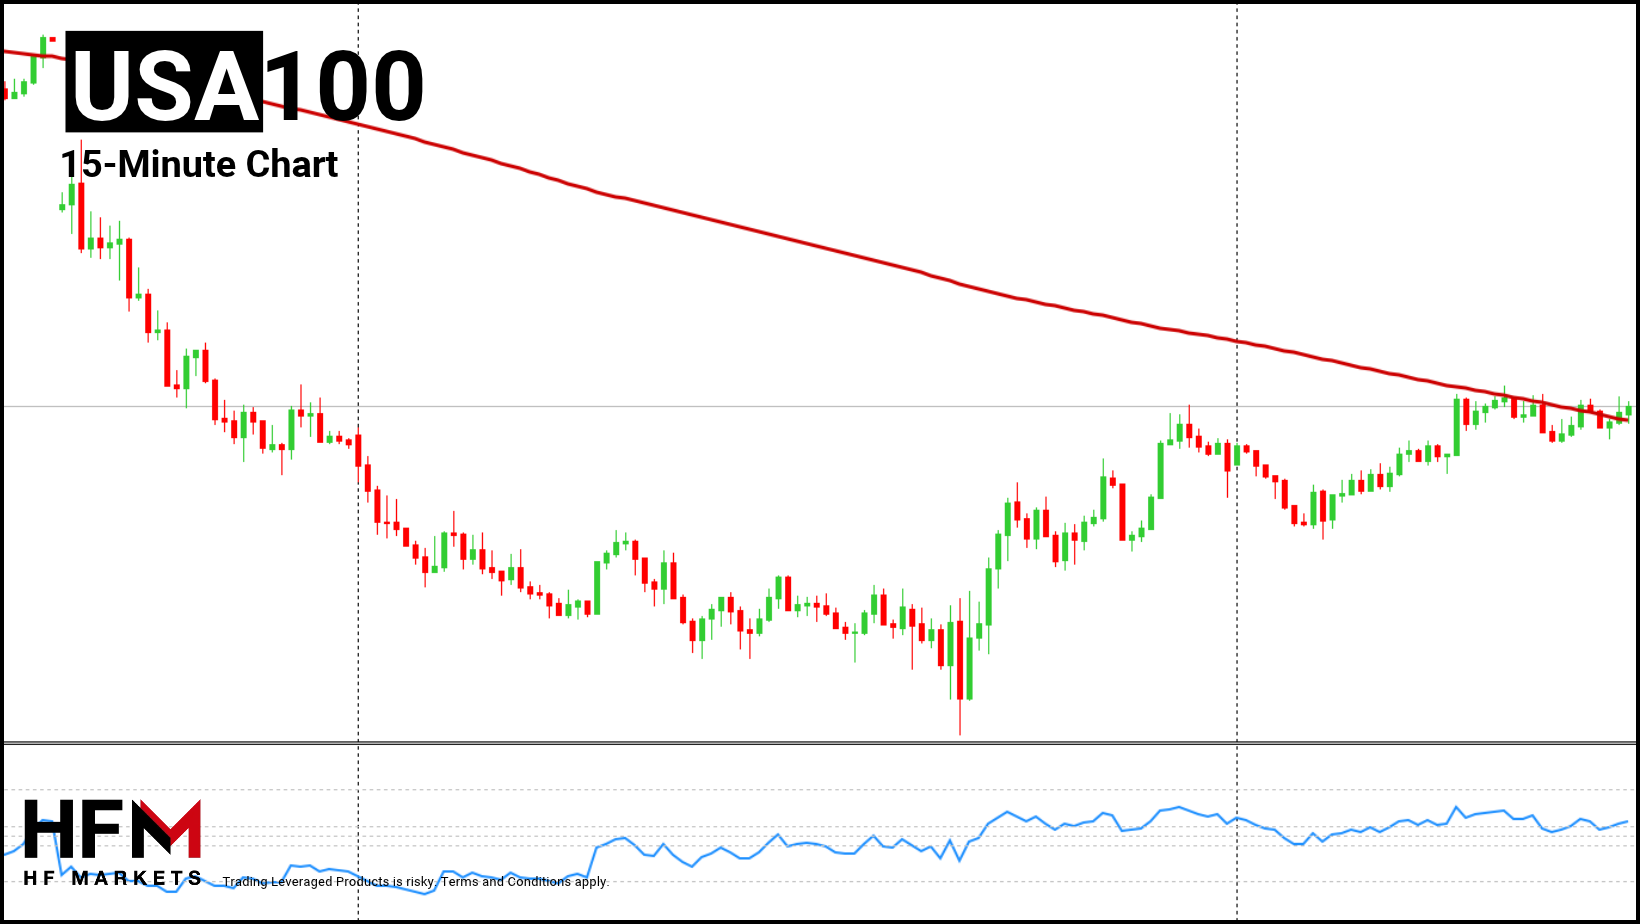
For this reason, the NASDAQ is also showing clear bearish indications from technical analysis. The price is trading below key moving averages and the VWAP. Currently, the order flow blocks are also indicating weak demand.
Price action is also indicating a downward trend as the price maintains bearish momentum. However, oscillators are mainly indicating an oversold condition The key support level on the daily timeframe is at $28,866.70.
Please note that times displayed based on local time zone and are from time of writing this report.
Click HERE to access the full HFM Economic calendar.
Want to learn to trade and analyse the markets? Join our webinars and get analysis and trading ideas combined with better understanding of how markets work. Click HERE to register for FREE!
Click HERE to READ more Market news.
Michalis Efthymiou
HFMarkets
Disclaimer: This material is provided as a general marketing communication for information purposes only and does not constitute an independent investment research. Nothing in this communication contains, or should be considered as containing, an investment advice or an investment recommendation or a solicitation for the purpose of buying or selling of any financial instrument. All information provided is gathered from reputable sources and any information containing an indication of past performance is not a guarantee or reliable indicator of future performance. Users acknowledge that any investment in Leveraged Products is characterized by a certain degree of uncertainty and that any investment of this nature involves a high level of risk for which the users are solely responsible and liable. We assume no liability for any loss arising from any investment made based on the information provided in this communication. This communication must not be reproduced or further distributed without our prior written permission.
CPI Shock Triggers ‘Risk-Off’ Sentiment: What It Means for Gold and the NASDAQ.
The US inflation rate, as well as core inflation data, reads higher than analysts' previous expectations. The US inflation rose from 3.4% to 3.7%, while core inflation rose to 2.6%. Both inflation readings are 0.1% higher than previous expectations, indicating that the Federal Reserve will almost certainly hike before year-end.
The reading was quick to trigger volatility and strong order flow as markets reacted. One of the most volatile assets was Gold, which fell 2.30% from high to low. However, the asset that had the most one-sided trend was the NASDAQ. The NASDAQ is currently trading at a four-week low.
US Consumer Price Index Prompt ‘Risk-Off’ Market Move
The issue for investors is not necessarily that inflation is too high, but that the higher-than-expected inflation reading means inflation will remain above 2% for more years. If inflation remains above 2% for much longer, economists fear that the higher rate could become the new norm, which carries economic risks.Gasoline prices surged 9.1% during September, accounting for more than half of the monthly increase, while overall energy costs rose 5.2%. Inflation also affected housing, with shelter costs increasing 0.4%, alongside higher prices for airfares, used vehicles, recreation, and education.
Looking ahead, economists expect inflationary pressures to remain elevated, particularly if geopolitical tensions continue to disrupt energy supplies. Higher fuel and transportation costs could gradually affect other sectors, making inflation more difficult to control.
Lastly, markets have seen a surge in demand for bonds after the CPI release, indicating a move towards safer’ assets.
Gold Being Paused By Two Driving Forces
Gold initially fell 1.65% immediately after the Consumer Price Index release, before declining a further 0.28% in the hours that followed. However, since this decline, Gold has risen and fully regained all previous losses. The price this morning is showing a strong upward impulse wave, but is retracing as the European session nears.The reason for the original decline is that the impact the higher inflation figure has on the Federal Reserve, the US Dollar and bond Yields. Both bond yields and the US Dollar rose to new highs for 2026. In addition, markets are now considering a Federal Reserve rate hike for October.
Rate hikes, a strong Dollar, and high bond yields are known to pressure Gold. This is also one of the reasons why Gold has been in a bearish trend over the past eight weeks. However, the higher inflation reading eventually prompts a ‘risk-off’ appetite. As the ‘risk-off’ sentiment gains momentum, the mood towards gold improves.
Markets are now considering an economic slowdown. The Federal Reserve’s latest Beige Book highlights sluggish consumer spending, limited economic growth across several regions and signs of a softer labour market. Now, with higher inflation and oil prices remaining above $90 per barrel, economists believe a slowdown is plausible.
If employment and economic growth weaken, the US Dollar loses its attractiveness and demand for gold rises. At the same time, the Federal Reserve will not be able to hike rates further to bring inflation down, further supporting Gold.
For this reason, Gold is now correcting upwards, but technical analysts advise volatility in both directions is likely as investors weigh both positive and negative elements.
Investors Dump NASDAQ In Exchange For Safer Assets
While the direction of Gold is less certain due to both positives and negatives, the NASDAQ is witnessing a strong decline. The NASDAQ fell 2.16% on Wednesday and a further 1.25% during this morning’s Asian session. Economists are also saying that there is a direct switch between stocks and bonds.Investors are decreasing their exposure to the stock market and particularly to the AI trend. Economists are saying that risks are mounting and strong earnings are currently not adequate to offset other risks.
On one side, investors are considering higher bond yields, Fed hikes, high oil prices, and fears over AI security. So far, earnings and economic resilience have kept the market afloat. However, investors now fear an economic slowdown in 2027. As a result, investors are decreasing exposure.
For this reason, the NASDAQ is also showing clear bearish indications from technical analysis. The price is trading below key moving averages and the VWAP. Currently, the order flow blocks are also indicating weak demand.
Price action is also indicating a downward trend as the price maintains bearish momentum. However, oscillators are mainly indicating an oversold condition The key support level on the daily timeframe is at $28,866.70.
Key Takeaways:
- Annual inflation rises to 3.7%, while core inflation reaches 2.6%, strengthening expectations of a Federal Reserve interest rate hike before year-end.
- Gold rebounds from its CPI losses as increased safe-haven demand offsets pressure from bond yields and a stronger US Dollar.
- The NASDAQ faces sustained selling pressure as investors reduce exposure to tech stocks amid inflation concerns and weakening risk appetite.
- Inflation, elevated energy prices, and signs of a weakening economy increase concerns about a potential US economic slowdown in 2027.
Please note that times displayed based on local time zone and are from time of writing this report.
Click HERE to access the full HFM Economic calendar.
Want to learn to trade and analyse the markets? Join our webinars and get analysis and trading ideas combined with better understanding of how markets work. Click HERE to register for FREE!
Click HERE to READ more Market news.
Michalis Efthymiou
HFMarkets
Disclaimer: This material is provided as a general marketing communication for information purposes only and does not constitute an independent investment research. Nothing in this communication contains, or should be considered as containing, an investment advice or an investment recommendation or a solicitation for the purpose of buying or selling of any financial instrument. All information provided is gathered from reputable sources and any information containing an indication of past performance is not a guarantee or reliable indicator of future performance. Users acknowledge that any investment in Leveraged Products is characterized by a certain degree of uncertainty and that any investment of this nature involves a high level of risk for which the users are solely responsible and liable. We assume no liability for any loss arising from any investment made based on the information provided in this communication. This communication must not be reproduced or further distributed without our prior written permission.
![2026-10-20 10_52_59-48132278 - HFMarketsGlobal-Demo - Netting - HF Markets (SV) Ltd. - [GBPJPYc,H4]](https://www.hfm.com/api/get-analysis-image/?file=images/2026-10-20_10_52_59-48132278_-_HFMarketsGlobal-.original.png "2026-10-20 10_52_59-48132278 - HFMarketsGlobal-Demo - Netting - HF Markets (SV) Ltd. - [GBPJPYc,H4]")
![2026-10-21 07_38_40-48132278 - HFMarketsGlobal_[AUDUSD,H1]](https://www.hfm.com/api/get-analysis-image/?file=images/2026-10-21_07_38_40-48132278_-_HFMarketsGlobal_.original.png "2026-10-21 07_38_40-48132278 - HFMarketsGlobal_[AUDUSD,H1]")