Chartreaderpro
Freshie
- Messages
- 26
- Joined
- Apr 1, 2018
- Messages
- 26
- Reaction score
- 0
- Points
- 3
EURUSD Forecast of the day: Corrective rally loses momentum
The bullish “corrective” rally of EURUSD seems to be ended at the EMA 50 resistance of the Daily Charts. 1.17880 resistance worked well.
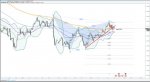
Harmonic Patterns sometimes really do their job very well. The Bearish Gartley worked well as predicted with the help of EMA resistance.
Markets will focus on U.S PPI figures and ECB President Draghi’s speech today. Another concern is the trade war tensions.
Technically:
EURUSD is pricing at 1.17230 as of writing.
On the daily chart, we can clearly see the bearish pressure as the pair holds below EMA 50.
1.17880 remains as the major resistance in the H4 Chart timeframe. The pair tested Fibonacci 38.20% of CD impulse after breaking the 1.17340 minor resistance, reversed upwards and retested the broken trendline.
1.17140 is the key level of today as EMA 200 in H4 Chart and Murrey Math Lines 0/8.
A break below 1.17100, may lead the price 1.17030 and 1.16800.
The real war will start at 1.16800.
Conclusion:
We can not talk about a trend reversal as long as the price holds below 1.18500.
EURUSD needs to make a few H4 closings above 1.17800- 1.1800 to continue its short-term bullish move.
Break and close below 1.17100 will make the Bears much eager to sell. In this case, 1.16800 is likely to be tested soon.
A better than expected U.S PPI may lead the price 1.15960 – 1.15300 region.
Key Levels for Today:
Upside: 1.17500 1.17800 1.18100
Downside: 1.17100 1.16800 1.16570
Midterm traders: You can sell EURUSD after breaking below 1.17100 with a stop loss above 1.18100 targeting 1.16800 and 1.15700. Pullbacks are selling opportunities as long as the price holds below 1.18500.
Visit Our Web for 1000+ Instruments
chartreaderpro.com
DISCLAIMER: This is a technical analysis study, not an advice or recommendation to invest money
The bullish “corrective” rally of EURUSD seems to be ended at the EMA 50 resistance of the Daily Charts. 1.17880 resistance worked well.
Harmonic Patterns sometimes really do their job very well. The Bearish Gartley worked well as predicted with the help of EMA resistance.
Markets will focus on U.S PPI figures and ECB President Draghi’s speech today. Another concern is the trade war tensions.
Technically:
EURUSD is pricing at 1.17230 as of writing.
On the daily chart, we can clearly see the bearish pressure as the pair holds below EMA 50.
1.17880 remains as the major resistance in the H4 Chart timeframe. The pair tested Fibonacci 38.20% of CD impulse after breaking the 1.17340 minor resistance, reversed upwards and retested the broken trendline.
1.17140 is the key level of today as EMA 200 in H4 Chart and Murrey Math Lines 0/8.
A break below 1.17100, may lead the price 1.17030 and 1.16800.
The real war will start at 1.16800.
Conclusion:
We can not talk about a trend reversal as long as the price holds below 1.18500.
EURUSD needs to make a few H4 closings above 1.17800- 1.1800 to continue its short-term bullish move.
Break and close below 1.17100 will make the Bears much eager to sell. In this case, 1.16800 is likely to be tested soon.
A better than expected U.S PPI may lead the price 1.15960 – 1.15300 region.
Key Levels for Today:
Upside: 1.17500 1.17800 1.18100
Downside: 1.17100 1.16800 1.16570
Midterm traders: You can sell EURUSD after breaking below 1.17100 with a stop loss above 1.18100 targeting 1.16800 and 1.15700. Pullbacks are selling opportunities as long as the price holds below 1.18500.
Visit Our Web for 1000+ Instruments
chartreaderpro.com
DISCLAIMER: This is a technical analysis study, not an advice or recommendation to invest money
Attachments
-
 33.4 KB Views: 61