XAUUSD London Session — Would You Take This Setup?
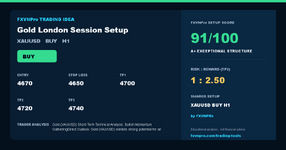
BUY • H1
Entry: 4670
Stop Loss: 4650
TP1: 4700
TP2: 4720
TP3: 4740
Risk/Reward to TP2: 1:2.5
My reasoning
Gold (XAU/USD) Short-Term Technical Analysis: Bullish Momentum GatheringDirect Outlook:
Gold (XAU/USD) exhibits strong potential for an upward reversal as multiple momentum indicators signal an oversold correction and a shift toward bullish control.
Relative Strength Index (RSI-14): The RSI has dipped into the oversold territory (below 30) and is currently turning upward. This exit from the oversold zone establishes a clear structural signal that seller exhaustion has kicked in, clearing a path for buyers to drive the price higher.
Stochastic Oscillator (5,3,3): Confirming the RSI signal, the Stochastic lines have formed a definitive bullish crossover within the deep oversold region (below 20). The %K line crossing above the %D line indicates an immediate accumulation of buying pressure and strong near-term upward velocity.
What would you change?
Entry?
Stop Loss?
TP1/TP2?
Timeframe?
Would you SELL instead?
I built a free tool on FXVNPro that lets traders enter their own Entry, SL, TP, timeframe, indicators and reasoning, then generate a shareable trade-idea page.
Full setup / modify this idea:
You can change my assumptions, analyze your version and share the result back here.
New ideas : https://www.fxvnpro.com/trading-tool...-idea-builder/
Disclosure: I'm associated with FXVNPro and built the tool. It's free to use. This post is for trading discussion and educational purposes, not financial advice.
BUY • H1
Entry: 4670
Stop Loss: 4650
TP1: 4700
TP2: 4720
TP3: 4740
Risk/Reward to TP2: 1:2.5
My reasoning
Gold (XAU/USD) Short-Term Technical Analysis: Bullish Momentum GatheringDirect Outlook:
Gold (XAU/USD) exhibits strong potential for an upward reversal as multiple momentum indicators signal an oversold correction and a shift toward bullish control.
Relative Strength Index (RSI-14): The RSI has dipped into the oversold territory (below 30) and is currently turning upward. This exit from the oversold zone establishes a clear structural signal that seller exhaustion has kicked in, clearing a path for buyers to drive the price higher.
Stochastic Oscillator (5,3,3): Confirming the RSI signal, the Stochastic lines have formed a definitive bullish crossover within the deep oversold region (below 20). The %K line crossing above the %D line indicates an immediate accumulation of buying pressure and strong near-term upward velocity.
What would you change?
Entry?
Stop Loss?
TP1/TP2?
Timeframe?
Would you SELL instead?
I built a free tool on FXVNPro that lets traders enter their own Entry, SL, TP, timeframe, indicators and reasoning, then generate a shareable trade-idea page.
Full setup / modify this idea:
You can change my assumptions, analyze your version and share the result back here.
New ideas : https://www.fxvnpro.com/trading-tool...-idea-builder/
Disclosure: I'm associated with FXVNPro and built the tool. It's free to use. This post is for trading discussion and educational purposes, not financial advice.
Attachments
-
 36 KB Views: 7
Last edited: