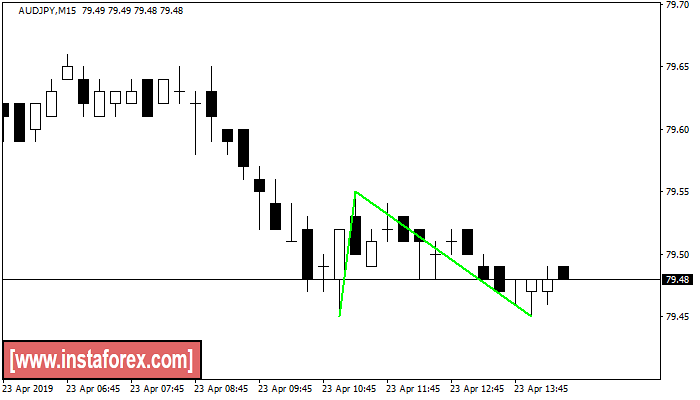
Double Bottom
was formed on 23.04 at 11:31:22 (UTC+0)
signal strength 2 of 5
The Double Bottom pattern has been formed on AUDJPY M15. This formation signals a reversal of the trend from downwards to upwards. The signal is that a buy trade should be opened after the upper boundary of the pattern 79.55 is broken. The further movements will rely on the width of the current pattern 10 points.
The M5 and M15 time frames may have more false entry points.
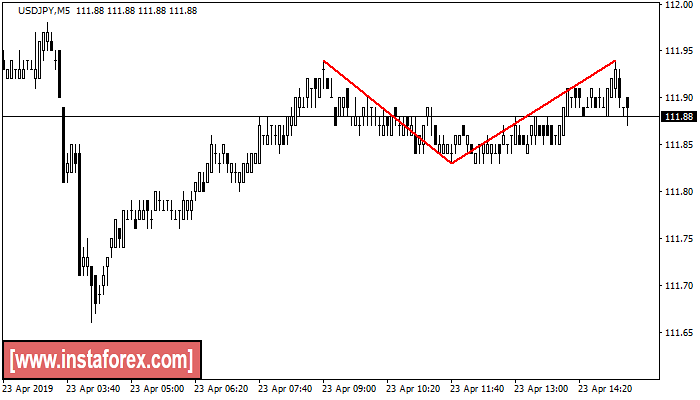
Double Top
was formed on 23.04 at 12:25:35 (UTC+0)
signal strength 1 of 5
On the chart of USDJPY M5 the Double Top reversal pattern has been formed. Characteristics: the upper boundary 111.94; the lower boundary 111.83; the width of the pattern 11 points. The signal: a break of the lower boundary will cause continuation of the downward trend targeting the 111.68 level.
The M5 and M15 time frames may have more false entry points.
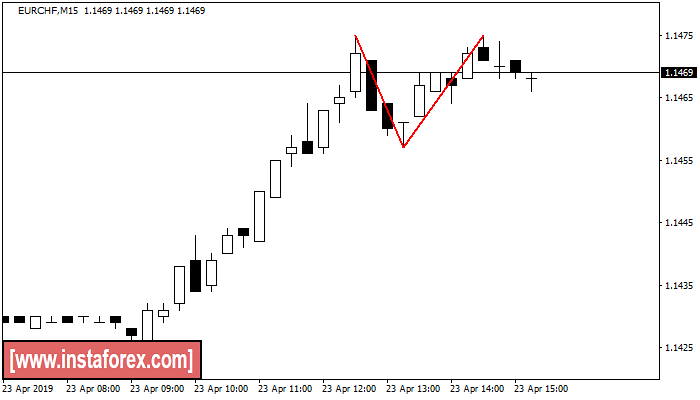
Double Top
was formed on 23.04 at 12:32:13 (UTC+0)
signal strength 2 of 5
The Double Top reversal pattern has been formed on EURCHF M15. Characteristics: the upper boundary 1.1475; the lower boundary 1.1457; the width of the pattern is 18 points. Sell trades are better to be opened below the lower boundary 1.1457 with a possible movements towards the 1.1435 level.
The M5 and M15 time frames may have more false entry points.
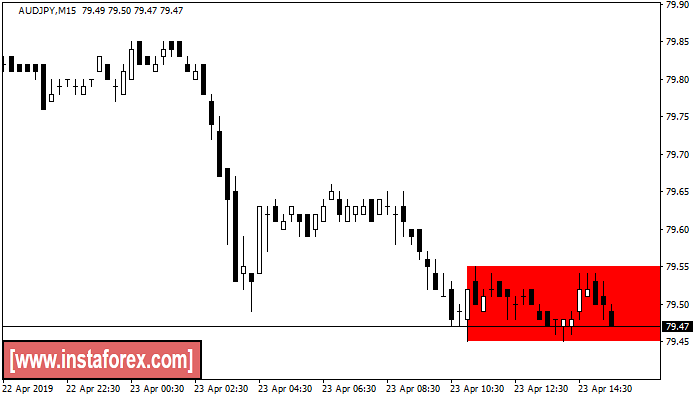
Bullish Rectangle
was formed on 23.04 at 12:33:25 (UTC+0)
signal strength 2 of 5
According to the chart of M15, AUDJPY formed the Bullish Rectangle. This type of a pattern indicates a trend continuation. It consists of two levels: resistance 79.55 - 0.00 and support 79.45 – 79.45. In case the resistance level 79.45 - 79.45 is broken, the instrument is likely to follow the bearish trend.
The M5 and M15 time frames may have more false entry points.
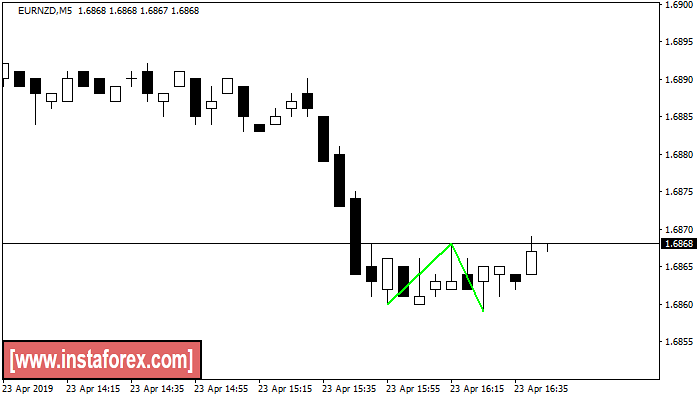
Double Bottom
was formed on 23.04 at 13:45:53 (UTC+0)
signal strength 1 of 5
The Double Bottom pattern has been formed on EURNZD M5; the upper boundary is 1.6868; the lower boundary is 1.6859. The width of the pattern is 8 points. In case of a break of the upper boundary 1.6868, a change in the trend can be predicted where the width of the pattern will coincide with the distance to a possible take profit level.
The M5 and M15 time frames may have more false entry points.
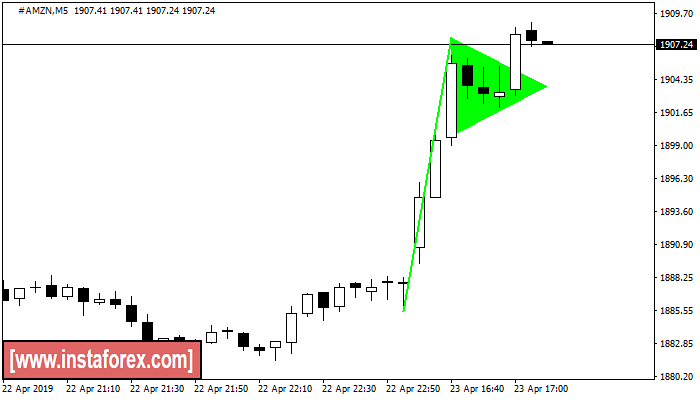
Bullish pennant
was formed on 23.04 at 14:10:15 (UTC+0)
signal strength 1 of 5
The Bullish pennant signal – Trading instrument #AMZN M5, continuation pattern. Forecast: it is possible to set up a buy position above the pattern’s high of 1907.76, with the prospect of the next move being a projection of the flagpole height.
The M5 and M15 time frames may have more false entry points.
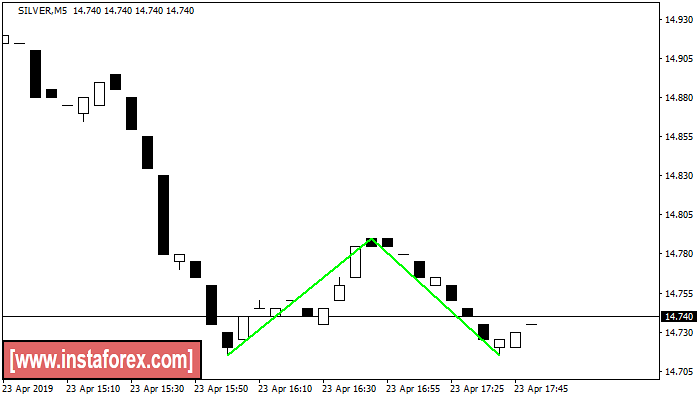
Double Bottom
was formed on 23.04 at 14:58:05 (UTC+0)
signal strength 1 of 5
The Double Bottom pattern has been formed on SILVER M5. Characteristics: the support level 14.71; the resistance level 14.79; the width of the pattern 75 points. If the resistance level is broken, a change in the trend can be predicted with the first target point lying at the distance of 75 points.
The M5 and M15 time frames may have more false entry points.
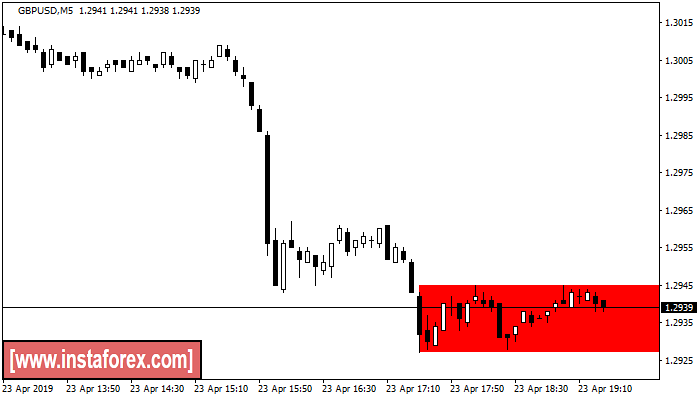
Bullish Rectangle
was formed on 23.04 at 16:26:14 (UTC+0)
signal strength 1 of 5
According to the chart of M5, GBPUSD formed the Bullish Rectangle which is a pattern of a trend continuation. The pattern is contained within the following borders: lower border 1.2927 – 1.2927 and upper border 1.2945 – 1.2945. In case the lower border is broken, the instrument is likely to follow the downward trend.
The M5 and M15 time frames may have more false entry points.
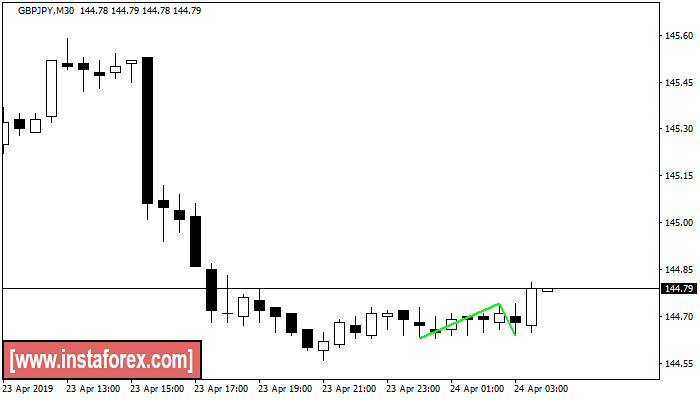
Double Bottom
was formed on 24.04 at 01:00:22 (UTC+0)
signal strength 3 of 5
The Double Bottom pattern has been formed on GBPJPY M30; the upper boundary is 144.74; the lower boundary is 144.64. The width of the pattern is 11 points. In case of a break of the upper boundary 144.74, a change in the trend can be predicted where the width of the pattern will coincide with the distance to a possible take profit level.
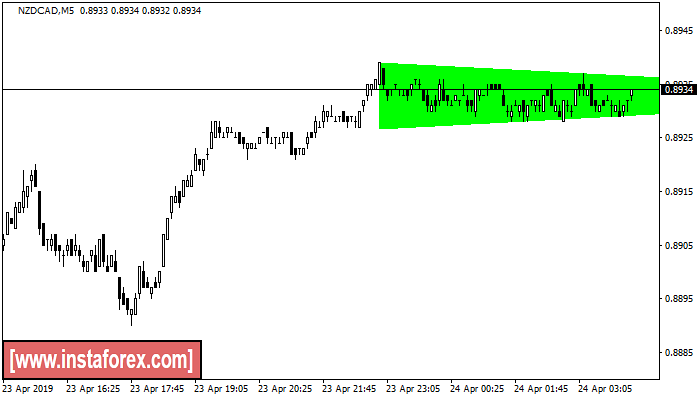
Bearish Symmetrical Triangle
was formed on 24.04 at 01:14:10 (UTC+0)
signal strength 1 of 5
According to the chart of M5, NZDCAD formed the Bearish Symmetrical Triangle pattern. Trading recommendations: A breach of the lower border 0.8939 is likely to encourage a continuation of the downward trend.
The M5 and M15 time frames may have more false entry points.