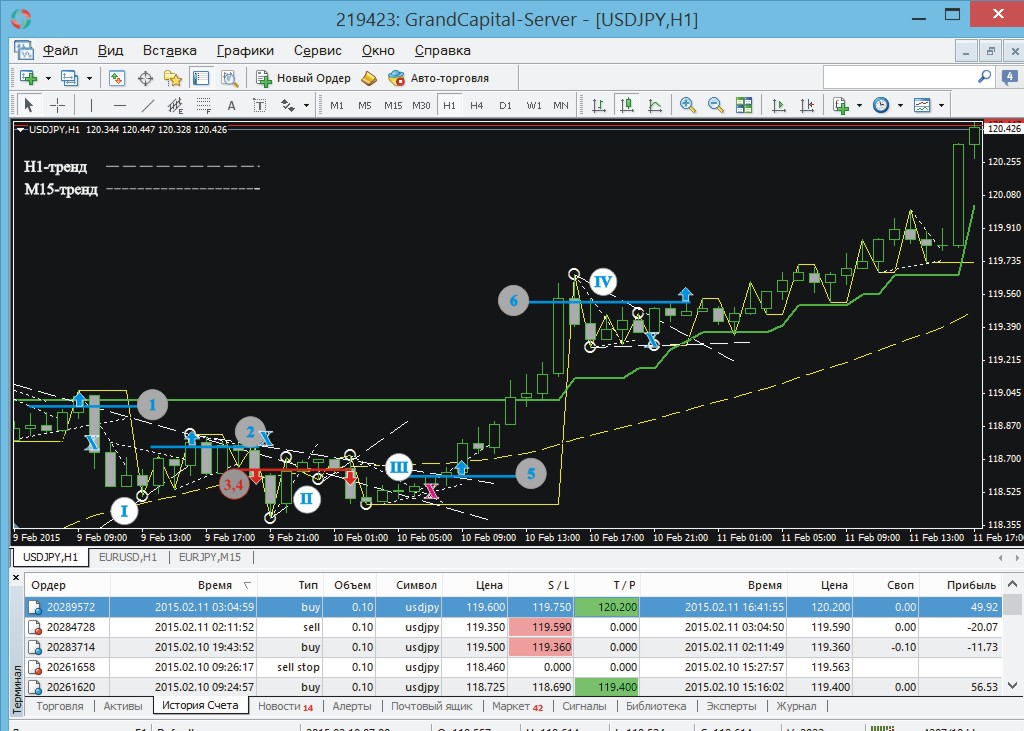
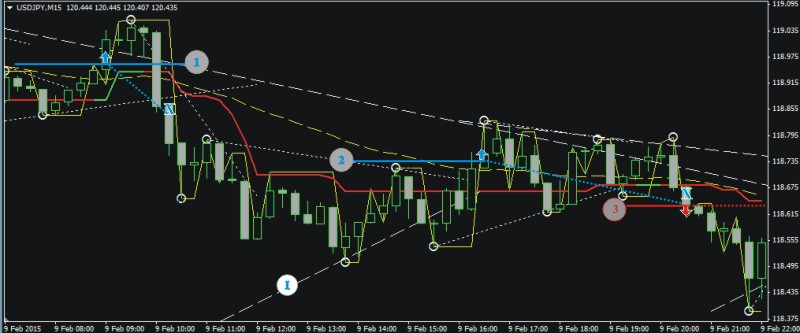
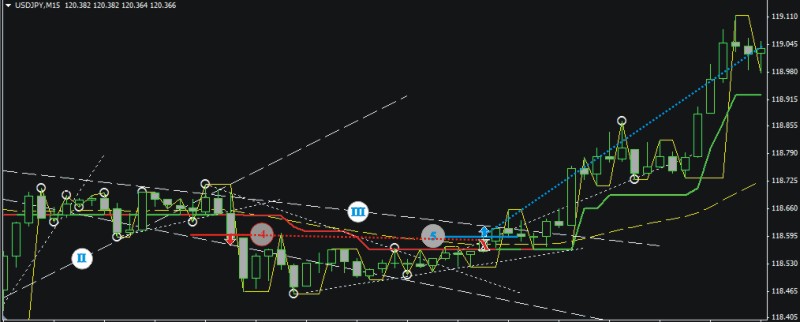
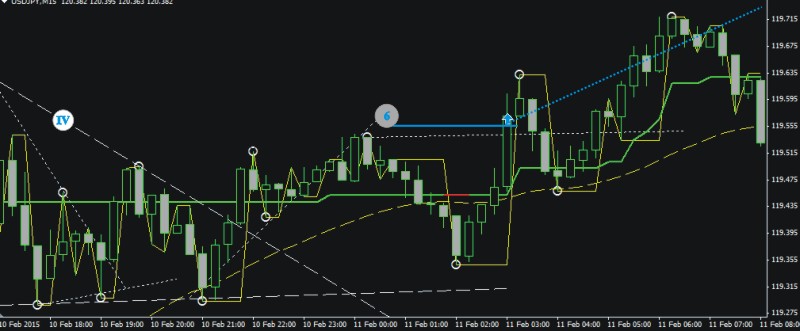
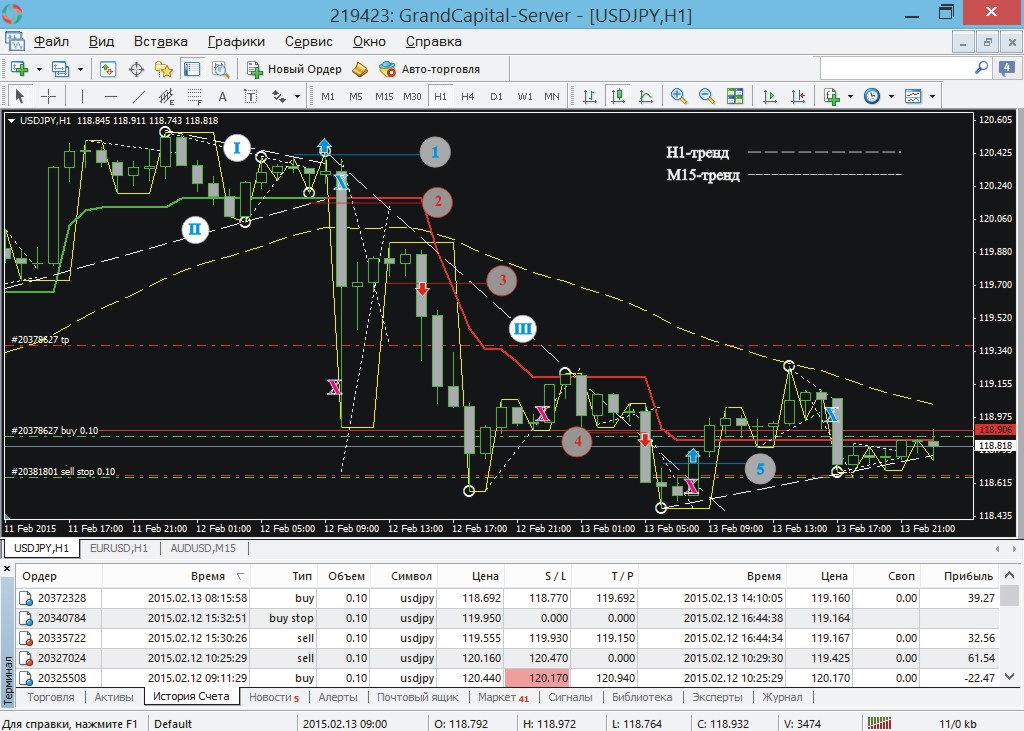
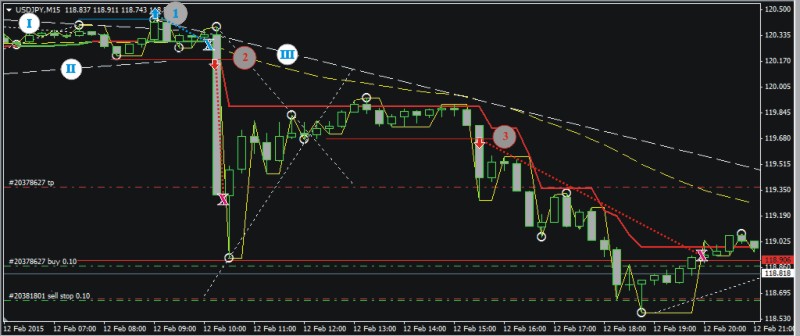
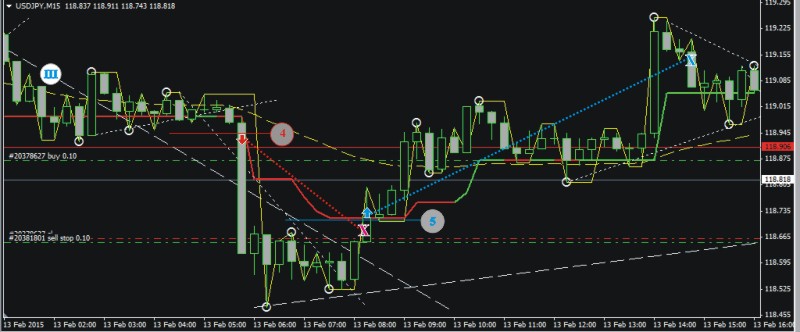
Strategy uses Eliot wave theory, but in practic all simple - using two last circles we build trend, we connect fractals using rules: minimums we connect when prev.min lower than new - it is up trend, maximums we connect when prev.max higher than new. - it is a down trend. minimums - it is bottom fractals, maximums - it is upper fractials. Trends are built on H1 and M15 charts, when both trends are crossed by price +3 pips - open trade. Exit - then new M15 trend crossed in revers direction
BTC
USD
62,450.4
Gold
USD
4,511.63
Time now:
Jun 1, 12:00 AM
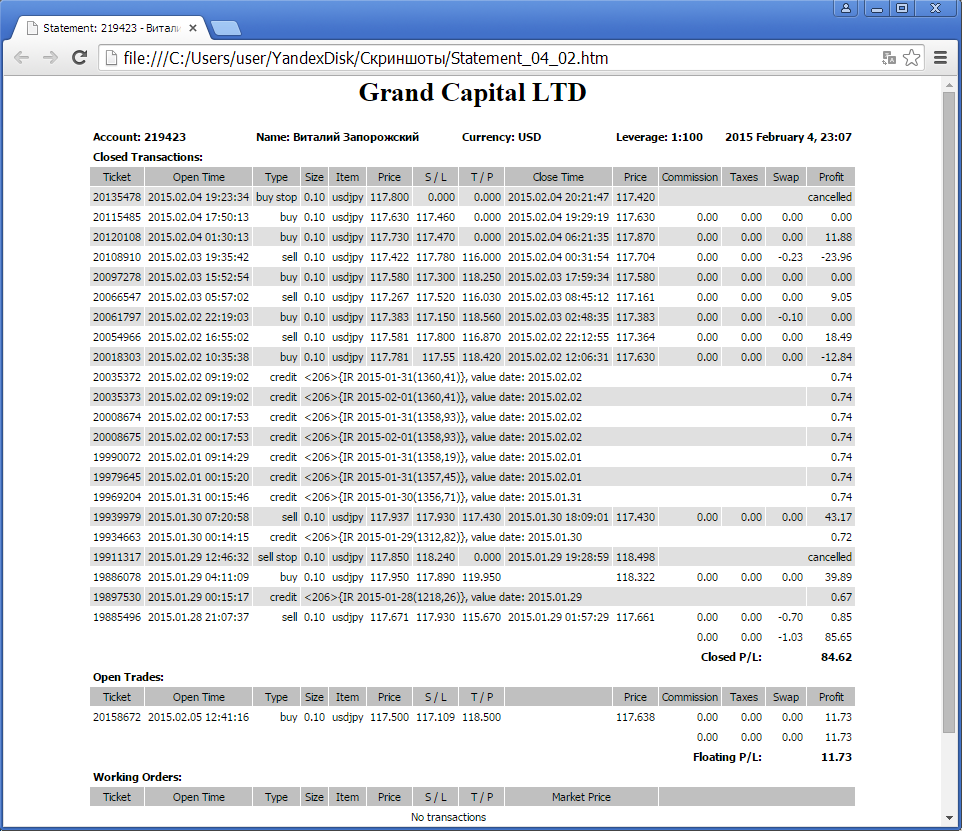
Breakthrough trend forex strategy using indicator towave


Similar threads
Forex News
-
 Pasaran forex tidak menentu selepas kebimbangan AI dan ketegangan Timur Tengah
- Started by Forex Analysis
- Replies: 0
-
Euro mengukuh berbanding mata wang utama lepas gencatan senjata Lebanon, walau jualan runcit Eurozone lemah
- Started by Forex Analysis
- Replies: 0
-
Euro meningkat setelah gencatan senjata Lebanon meski jualan runcit Eurozone lemah
- Started by Forex Analysis
- Replies: 0
-
Euro kukuh berbanding mata wang utama, catat kenaikan terhadap pound, dolar AS, dan lain-lain
- Started by Forex Analysis
- Replies: 0
-
 Ringgit Ditutup Rendah Berbanding Dolar AS, Ketidakpastian Global Jejaskan Sentimen
- Started by Bernama
- Replies: 0
Live Forex Chart
Currency
Rates
EUR / USD
1.16416
USD / JPY
159.768
GBP / USD
1.34589
USD / CHF
0.78713
USD / CAD
1.38950
EUR / JPY
185.996
AUD / USD
0.71469