BTC USD 82,950.2 Gold USD 4,144.52
Time now: Jun 1, 12:00 AM

Breakthrough trend forex strategy using indicator towave

dci2002

Freshie
Messages
13
Joined
Jan 20, 2015
Messages
13
Reaction score
0
Points
3
The principle of this strategy:
1) we build H1 and M15 trends using two last fractals of towave indicator
2) trade is opened when M15 trend is broken (crossed) through resistance point (+/- 3pips) in one case - with breakthrough H1-trend (situations 1,2,4) and in other case - in direction of H1-trend (sit.3,5)
3) stop-loss is set on the last fractal of M15-timeframe (+/-3 pips)
4) trade finished when M15-trend is crossed in reverse direction
Strategy.jpg


Strategy uses two indicators ToWave indicator and TREND-MA.
The indicator TREND-MA draws support/resistance lines. The indicator ToWave uses Elliot theory base. Look on price changes, ToWave builds extremums('resistance points'), fractals (significant point of trend).
ExampleForex.jpg


Examples of trades on USDJPY: 15.01.2015-16.01.2015 - Profit: 89 pips
At this days I provided two successfull trades:
1) case №3 - sale trade is opened - М15-trend is crossed into Н1-trend direction (I)
2) case №5 - buy trade is opened - М15-trend is crossed into Н1-trend direction (2)
H1-timeframe
attachment.php

More details on look on Facebook in my page ToWaveStrategy and my site assigned with it.
 
Trades 19.01.2015 (+50 pips USDJPY)
Was closed 1 trade (case 2) on breakthrough H1-trend (II) with strategy rule (breakthrough M15-trend with breakthrough H1-trend)
20150119_1.jpg
 
USING STRATEGY TOWAVE. TRADES 20-21.01.2015 (+90 PIPS USDJPY)
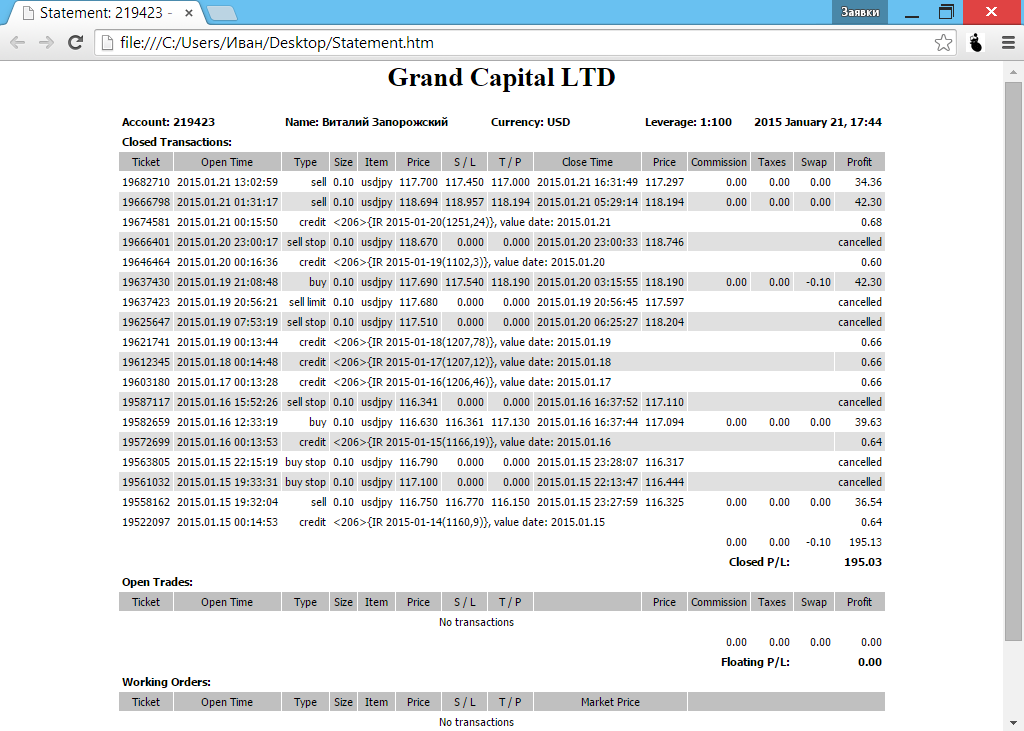
Examples of trades with strategy using indicator ToWave. After that - weekly results 15-21.01.2015 (+229 pips). Strategy was described in my blog early
During two days may be possible 5 trades.
Case 1 - buy, M15 trend is crossed in direction of H1-trend; this position I don't open, was busy
Case 2 - buy, M15 trend is crossed in direction of H1-trend; this position I don't open, I was afraid that it is 4 breakthrough and price would be ready to cross H1-up trend
Case 3 - sell, M15 trend is crossed with breakthrough H1-trend, profit 50 pips
Case 4 - sell M15 trend is crossed in direction of H1-trend; profit 40 pips; according the strategy this trade would made profit 5 pips, but I closed position look at market volatility, when price twice touched +40 pips level
Case 5 - M15 trend is crossed with breakthrough H1-trend
Additionaly, about closing of trade. There are 3 cases that I use: 1) price achieved +50pips, 2)M15-trend is crossed in reverse direction; 3) stop-loss case
Weekly results +229 pips, +195$, +17% to deposit
Pict: H1-chart, M15-chart (cases 2,3), M15-chart (cases 4,5), weekly report
20150121_1.jpg

20150121_2.jpg

20150121_3.jpg

zKiDS87h.png
 
boleh cerita bahasa melayu x,kurang faham bahasa inggeris ni hihi
 
USING STRATEGY TOWAVE. TRADES 22-23.01.2015 (+80 PIPS USDJPY)
During two days may be possible 5 trades.
Case 1 - sell, M15 trend is crossed with breakthrough of H1-trend; profit +42 pips
Case 2 - buy, M15 trend is crossed with breakthrough of H1-trend (I); profit +40 pips
Case 3 - buy, M15 trend is crossed n direction of H1-trend (II); loss trade; I didn't open it
Case 4 - buy, M15 trend is crossed n direction of H1-trend(II); loss trade; loss -27 pips
Case 5 - M15 trend is crossed with breakthrough H1-trend(II); this position I closed with profit (+25 pips), because previous trade was lossed,stop loss higher than trade open price, and I closed trade when summary profit was equals zero.
Screenshorts:
H1-chart, M15-chart (cases 1, 2), M15-chart (cases 3, 4, 5)
20150123_1.jpg

20150123_2.jpg

20150123_3.jpg
 
USING STRATEGY TOWAVE. TRADES 26-28.01.2015 (USDJPY)
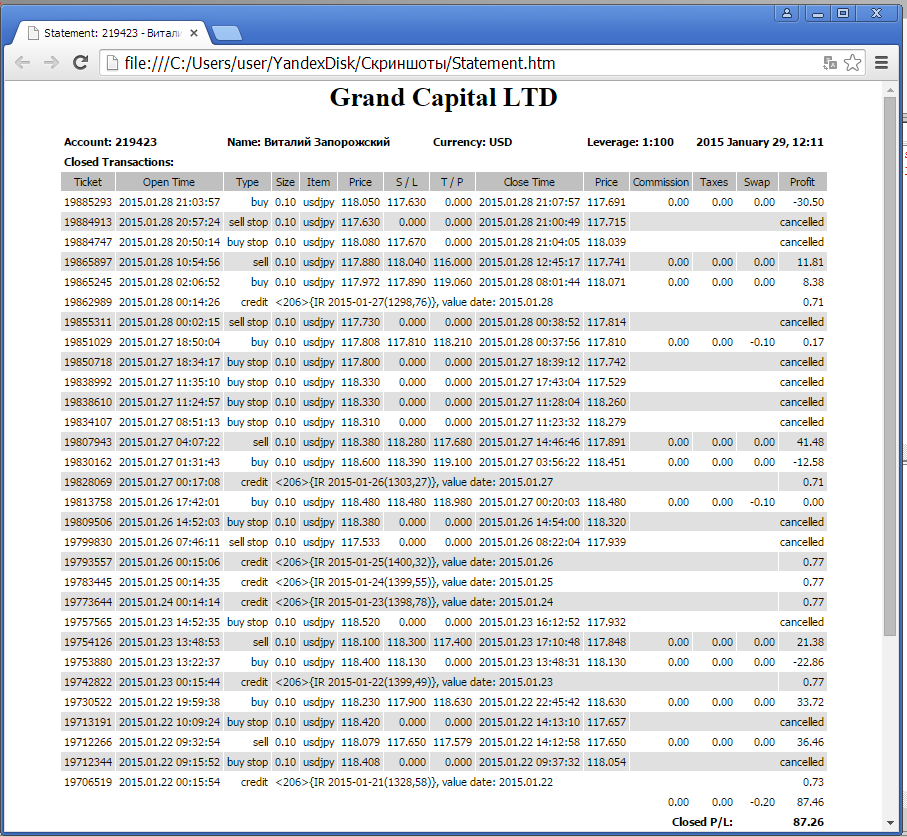
Examples of trades with strategy using indicator ToWave. After that - weekly results 22-28.01.2015 (+103 pips). Summary from 15.01-28.01.2015 +332 pips.

There are 7 trades may be possible during 3 days.
Case 1 - buy, M15 trend is crossed in direction of H1-trend; loss -15 pips;
Case 2 - sell, M15 trend is crossed with breakthrough H1-trend; this case I combine with case 3 (don't close, because it is high probability to open second sell position in direction of trend)
Case 3 - sell, M15 trend is crossed in direction of H1-trend; profit +49 pips;
Case 4- buy, M15 trend is crossed with breakthrough H1-trend; profit +10 pips;
Case 5 - sell, M15 trend is crossed with breakthrough H1-trend; profit +14 pips;
Case 6- buy, M15 trend is crossed with breakthrough H1-trend; loss -36 pips; FRS reports - high risk, usually I don't open trades in this period;
Case 7- sell, M15 trend is crossed with breakthrough H1-trend; profit +0 pips.
Weekly results: +103 pips, +87$, +6% to deposit
Charts: Н1, М15 (cases 1,2,3), М15 (cases 4,5), М15(cases 6,7), weekly report
20150128_1.jpg

20150128_2.jpg

20150128_3.jpg

20150128_4.jpg

K79tHt4S.png
 
USING STRATEGY TOWAVE. TRADES 29-30.01.2015 (+98 PIPS USDJPY)
During two days may be possible 2 trades.
Case 1 - buy, M15 trend is crossed in direction of H1-trend ; profit +51 pips;
Case 2 - sell, M15 trend is crossed in direction of H1-trend ; profit +47 pips.
Charts: H1-chart, M15-chart (case 1), M15-chart (case 2).
20150130_1.jpg

20150130_2.jpg

20150130_3.jpg
 
this looks like algorithm system to me...
 

Latest Posts

Live Forex Chart

Currency
Rates
EUR / USD
1.13752
USD / JPY
156.911
GBP / USD
1.32682
USD / CHF
0.83114
USD / CAD
1.41565
EUR / JPY
178.490
AUD / USD
0.70156
Back
Top
Log in Register