BTC USD 76,071.1 Gold USD 4,272.19
Time now: Jun 1, 12:00 AM

⭐ The Weekly Market Matrix: Stocks, Crypto, Geopolitics & Key Events with PlexyTrade

Wednesday 17 June 2026

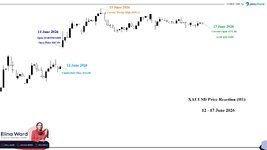
XAU/USD Analysis — 14 June 2026 to 17 June 2026Timeframe: H1 | Net Move: +1.49% | Range: +2.37% | Bias & Key Risk: Bullish Recovery with Fed & Deal Risk


From 14 June to 17 June 2026, spot gold (XAU/USD) opened with a strong weekend gap higher, rising from the 12 June close at 4,216.96 to the 14 June open at 4,267.94. The move extended into 15 June, when gold reached the current weekly high at 4,369.12, before cooling and stabilising around the 17 June current open at 4,331.48.

The move showed that gold was supported by a major shift in the geopolitical and macro backdrop after headlines confirmed progress on a US–Iran agreement and a possible reopening of the Strait of Hormuz. However, the rally was not only a classic safe-haven move. Gold also benefited because the agreement pushed oil prices lower, reduced fears of another energy-driven inflation shock, eased rate-hike expectations, pressured Treasury yields, and weakened the U.S. dollar backdrop.

By 17 June, XAU/USD had pulled back from the weekly high but remained above the 14 June opening level. This showed that the immediate peace-deal optimism had already been partly priced in, while the market waited for the Federal Reserve decision and more confirmation around the US–Iran deal implementation.


PRICE ACTION SUMMARY

MetricValue
12 June Close4,216.96
14 June Period Open4,267.94
Current Weekly High4,369.12
17 June Current Open4,331.48
Weekend Gap (12 Close → 14 Open)+1.21%
Net Move (14 Open → 17 Current Open)+1.49%
Open → Weekly High Move+2.37%
High → Current Open Pullback-0.86%
12 Close → Current Open Move+2.72%

🔴 RESISTANCE said:
4,369.12 — Current weekly high reached on 15 June. This became the main resistance area after the weekend gap and US–Iran deal-driven rally.

🟢 SUPPORT said:
4,267.94 / 4,216.96 — The 14 June open at 4,267.94 acted as the main post-gap support reference, while the 12 June close at 4,216.96 marked the pre-gap base before the weekend move.


FUNDAMENTAL DRIVERS

US–IRAN PEACE DEAL & STRAIT OF HORMUZ

The main catalyst for gold was the US–Iran agreement headline and the possibility of reopening the Strait of Hormuz. The deal changed the market’s view of the conflict because the biggest concern had been energy disruption. Once traders started pricing in improved oil flows, the geopolitical shock shifted from an inflationary threat into a relief story.

WEEKEND GAP HIGHER
Gold opened sharply higher on 14 June, creating a weekend gap from 4,216.96 to 4,267.94. This reflected how quickly traders repriced the market after the weekend headlines. The gap showed that buyers reacted before normal weekday liquidity fully returned, and the move continued into 15 June as gold reached 4,369.12.

OIL PRICES & INFLATION EXPECTATIONS
Oil remained the key transmission channel for gold. Earlier in the conflict, higher oil prices had pressured gold because traders feared that energy-driven inflation would force the Federal Reserve to stay restrictive for longer. After the US–Iran deal headlines, falling oil prices reduced that inflation pressure. This supported gold because lower inflation risk reduced the need for additional Fed rate hikes.

U.S. TREASURY YIELDS & FED EXPECTATIONS
Gold benefited as rate-hike fears eased and Treasury-yield pressure softened. Since gold does not pay interest, lower yields reduce the opportunity cost of holding XAU/USD. This helped explain why gold was able to rally even though the headline itself was a de-escalation story rather than a fresh escalation shock.

U.S. DOLLAR WEAKNESS
The U.S. dollar came under pressure as peace-deal optimism improved global risk sentiment and reduced defensive dollar demand. A softer dollar made dollar-priced gold more attractive for non-U.S. buyers, adding support to the move above the 4,300 area.

FED INTEREST RATE DECISION
The 16–17 June FOMC decision remained the biggest event risk for gold. Traders expected the Fed to hold rates steady, but the market focus was on the tone of the statement and the press conference. If the Fed sounded more hawkish because inflation remained elevated, gold risked losing momentum. If the Fed acknowledged easing oil-driven inflation pressure, gold had a stronger chance of holding its recovery.

GEOPOLITICAL & SAFE HAVEN
Geopolitics affected gold in a more complex way than usual. Normally, conflict risk supports gold directly through safe-haven demand. In this case, the key market concern was oil-driven inflation. When the US–Iran deal reduced oil and inflation pressure, gold rose because the rate outlook became less restrictive. This meant gold was supported by de-escalation, lower yields, and a weaker dollar at the same time.


INTERMARKET CORRELATIONS

AssetMove / BiasContext
Gold (XAU/USD)+1.49%Gold moved from the 14 June open at 4,267.94 to the 17 June current open at 4,331.48 after reaching a weekly high at 4,369.12.
OilLowerUS–Iran deal optimism and potential Hormuz reopening reduced the energy-risk premium and eased inflation fears.
U.S. Treasury YieldsLower PressureLower oil and inflation concerns reduced the need to price in a more aggressive Fed path.
U.S. DollarSofter BiasThe dollar weakened as peace optimism improved risk sentiment and reduced defensive demand.
EquitiesRisk-OnGlobal stocks were supported as investors welcomed lower oil prices and reduced geopolitical stress.


WHAT TO WATCH NEXT

June 17, 2026
— Federal Reserve Policy Decision

The Fed decision was the key short-term event for XAU/USD. Gold was sensitive to whether the Fed focused on easing oil-driven inflation pressure or maintained a hawkish tone because inflation remained above target.

US–Iran Deal Details — Signing, Implementation, and Hormuz Flows
Markets were watching whether the agreement would be formally implemented and whether the Strait of Hormuz could reopen smoothly. Any delay, disagreement, or renewed tension could quickly bring geopolitical risk back into oil and gold.

Oil Market Reaction — Brent, WTI, and Energy Inflation
Oil remained the most important macro link for gold. If oil continued to fall, inflation pressure could ease further and support gold through lower yields. If oil rebounded because the deal stalled, gold could face a mixed reaction: safe-haven demand could rise, but inflation and Fed-rate pressure could return.

4,369.12 Weekly High — Key Technical Resistance
The 15 June high at 4,369.12 became the main upside level to watch. A failure to reclaim this zone would show that gold was consolidating after the gap rally, while a sustained move above it would confirm renewed bullish momentum.

4,267.94 Gap Open — Key Technical Support
The 14 June open at 4,267.94 remained the key downside reference. A move back toward this level would suggest that the weekend gap was being tested, while holding above it would keep the recovery structure intact.


BIAS & KEY RISK said:
BULLISH RECOVERY WITH FED & DEAL RISK

XAU/USD remained in a bullish recovery from 14 June to 17 June after the weekend gap lifted gold from 4,216.96 to 4,267.94 and the rally extended to a weekly high of 4,369.12. The move was supported by US–Iran peace-deal optimism, lower oil prices, reduced inflation fears, softer rate-hike expectations, a weaker U.S. dollar, and lower Treasury-yield pressure.

CRITICAL RISK: The main risk for gold was a hawkish Fed surprise or a breakdown in the US–Iran agreement. A more hawkish Fed tone could lift yields and pressure XAU/USD, while renewed tension around the Strait of Hormuz could push oil higher again and revive inflation concerns. Gold’s recovery remained stronger while price held above the 4,267.94 gap-open zone, but the 4,369.12 weekly high remained the key resistance level to break.


PROFIT STUDY

A trader who was following the US–Iran headlines before the weekend would have known that potential talks could lead to a peace-deal surprise, lower oil-risk pressure, and a strong reaction in gold.

Entering XAU/USD near the 12 June close at 4,216.96 before the weekend gap would have positioned them ahead of the sharp climb toward 4,369.12. On a 1 standard lot position, assuming 100 ounces, that 152.16-point move represented a potential gross movement of $15,216, with required margin of around $843.39 at 1:500 leverage or $210.85 at 1:2000 leverage.

The position did not need to be closed exactly at the high either — closing anywhere within the move after the gap could still have produced a profit. This showed how powerful informed trading around major geopolitical events could be, but also how dangerous weekend gaps and high leverage could become if the market moved the other way.
 

Attachments

  • 96.3 KB Views: 19
Thursday 18 June 2026

Brent Crude Falls as US–Iran Interim Peace Deal Removes War Premium

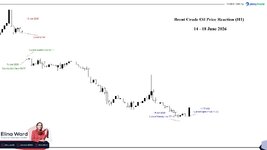
Brent Crude Oil Price Reaction: 15–18 June 2026

Brent Crude Oil came under heavy pressure between Monday 15 June and Thursday 18 June 2026, as traders quickly priced out part of the Middle East war-risk premium after the US–Iran interim peace deal.

According to the chart, Brent closed at 87.96 on 12 June, then opened the new week lower at 84.77, creating a clear weekend gap. The price briefly reached a weekly high of 85.11, but the recovery attempt failed as sellers took control.

The main driver was the expected reopening of the Strait of Hormuz. During the conflict, Brent had been supported by fears of disrupted Gulf supply routes, tighter shipping conditions, and higher energy prices. Once the agreement pointed toward restored maritime traffic and a possible return of supply, the market shifted from supply-risk pricing to supply-recovery expectations.

By 18 June, Brent had fallen to a weekly low of 77.15 before opening around 77.75. From Monday’s open at 84.77 to the current open, Brent dropped 7.02 points, or around 8.28%.

Price Action Summary

MovementFromToPoint Move% Move
12 June Close to 15 June Open87.9684.77-3.19-3.63%
15 June Open to Current Open84.7777.75-7.02-8.28%
Weekly High to Weekly Low85.1177.15-7.96-9.35%
Weekly Low to Current Open77.1577.75+0.60+0.78%

What Drove the Move?

The biggest driver was de-escalation. The US–Iran interim peace deal reduced fears of a prolonged Gulf supply disruption and raised expectations that oil flows through the Strait of Hormuz could normalize.

There were still short-lived rebounds during the move. Trump warned that attacks could resume if Iran failed to honor the agreement, which briefly brought some caution back into the market. However, the broader trend stayed bearish because traders were focused on returning supply, lower shipping risk, and reduced fear of a major disruption.

Conclusion

Brent’s decline was mainly about supply expectations, not a sudden collapse in demand. The market moved from pricing in war risk to pricing in supply recovery.

From Monday’s open to the current open, Brent fell around 8.28%. From the weekly high to the weekly low, the decline reached around 9.35%, showing how quickly oil prices adjusted once the US–Iran interim peace deal reduced fears around the Strait of Hormuz.

Profit Study:

With 1:200 leverage, opening one standard lot at 84.77 would require approximately $423.85 in margin, assuming a 1,000-barrel contract size.

From 84.77 to the weekly low of 77.15, Brent moved 7.62 points lower. On one standard lot, that move represented a potential $7,620 opportunity for a short position.

This is where volatility turns into opportunity. Capturing the full move is never easy, but even a controlled entry within that range could have delivered a meaningful result for traders who understood the risk and reacted quickly.

When fear cools, oil can fall. When tensions return, oil can climb. The real question is simple: are you just watching the headlines, or are you ready for the move?
 

Attachments

Friday 19 June 2026

📊 High-Impact Economic Calendar – 22–28 June 2026

🌍 Week Overview

This week focused on inflation data, PMI flash releases, U.S. PCE inflation, GDP, durable goods, and labor market updates, with major attention on Canadian inflation, global PMI data, Australian inflation, and Thursday’s U.S. Core PCE + GDP cluster.

Times in GMT

All events are 🔴 HIGH IMPACT for traders


🗓️ Monday, 22 Jun 2026

TimeCountryEventForecastPreviousImpact
12:30🇨🇦 CACore Inflation Rate MoM (MAY)0.5%0.2%🔴 High
12:30🇨🇦 CACore Inflation Rate YoY (MAY)2.2%2.1%🔴 High
12:30🇨🇦 CAInflation Rate YoY (MAY)2.9%2.8%🔴 High
23:00🇦🇺 AUS&P Global Manufacturing PMI Flash (JUN)50.050.7🔴 High
23:00🇦🇺 AUS&P Global Services PMI Flash (JUN)49.048.7🔴 High
23:00🇦🇺 AUS&P Global Composite PMI Flash (JUN)49.148.7🔴 High

🗓️ Tuesday, 23 Jun 2026

TimeCountryEventForecastPreviousImpact
00:30🇯🇵 JPS&P Global Manufacturing PMI Flash (JUN)53.654.5🔴 High
00:30🇯🇵 JPS&P Global Composite PMI Flash (JUN)50.851.1🔴 High
00:30🇯🇵 JPS&P Global Services PMI Flash (JUN)50.350.0🔴 High
07:15🇫🇷 FRS&P Global Services PMI Flash (JUN)44.044.3🔴 High
07:15🇫🇷 FRS&P Global Manufacturing PMI Flash (JUN)49.649.7🔴 High
07:15🇫🇷 FRS&P Global Composite PMI Flash (JUN)45.144.9🔴 High
07:30🇩🇪 DES&P Global Services PMI Flash (JUN)46.048.1🔴 High
07:30🇩🇪 DES&P Global Composite PMI Flash (JUN)47.948.8🔴 High
07:30🇩🇪 DES&P Global Manufacturing PMI Flash (JUN)49.050.1🔴 High
08:00🇪🇺 EAS&P Global Services PMI Flash (JUN)46.047.7🔴 High
08:00🇪🇺 EAS&P Global Manufacturing PMI Flash (JUN)52.351.6🔴 High
08:00🇪🇺 EAS&P Global Composite PMI Flash (JUN)48.048.5🔴 High
08:30🇬🇧 GBS&P Global Composite PMI Flash (JUN)52.149.7🔴 High
08:30🇬🇧 GBS&P Global Manufacturing PMI Flash (JUN)53.453.9🔴 High
08:30🇬🇧 GBS&P Global Services PMI Flash (JUN)51.949.3🔴 High
13:45🇺🇸 USS&P Global Services PMI Flash (JUN)50.450.7🔴 High
13:45🇺🇸 USS&P Global Composite PMI Flash (JUN)50.651.5🔴 High
13:45🇺🇸 USS&P Global Manufacturing PMI Flash (JUN)54.555.1🔴 High
14:00🇺🇸 USRichmond Fed Manufacturing Index (JUN)713🔴 High

🗓️ Wednesday, 24 Jun 2026

TimeCountryEventForecastPreviousImpact
01:30🇦🇺 AUInflation Rate YoY (MAY)4.9%4.2%🔴 High
08:00🇩🇪 DEIfo Business Climate (JUN)84.284.9🔴 High
14:00🇺🇸 USNew Home Sales MoM (MAY)-2.9%-6.2%🔴 High
14:00🇺🇸 USNew Home Sales (MAY)600K622K🔴 High

🗓️ Thursday, 25 Jun 2026

TimeCountryEventForecastPreviousImpact
01:30🇦🇺 AUEmployment Change (MAY)30K-18.6K🔴 High
01:30🇦🇺 AUUnemployment Rate (MAY)4.4%4.5%🔴 High
01:30🇦🇺 AUFull-Time Employment Change (MAY)40K-10.7K🔴 High
01:30🇦🇺 AUHousehold Spending YoY (MAY)4.1%4.9%🔴 High
06:00🇩🇪 DEGfK Consumer Confidence (JUL)-30.0-29.8🔴 High
12:30🇺🇸 USPersonal Income MoM (MAY)0.1%0.0%🔴 High
12:30🇺🇸 USCore PCE Price Index MoM (MAY)0.2%0.2%🔴 High
12:30🇺🇸 USPersonal Spending MoM (MAY)0.4%0.5%🔴 High
12:30🇺🇸 USCore PCE Price Index YoY (MAY)3.3%3.3%🔴 High
12:30🇺🇸 USDurable Goods Orders MoM (MAY)-3.2%7.9%🔴 High
12:30🇺🇸 USPCE Price Index YoY (MAY)4.0%3.8%🔴 High
12:30🇺🇸 USGDP Growth Rate QoQ Final (Q1)1.6%0.5%🔴 High
12:30🇺🇸 USInitial Jobless Claims (JUN/20)225K226K🔴 High

🗓️ Sunday, 28 Jun 2026

TimeCountryEventForecastPreviousImpact
23:50🇯🇵 JPRetail Sales MoM (MAY)0.7%1.3%🔴 High

📌 Week Summary


This week’s main focus centered on inflation, PMI activity, and U.S. macro data, with Thursday’s U.S. Core PCE, PCE, GDP, durable goods, income, and spending cluster expected to be the strongest volatility window. Canadian inflation, Australian inflation, global PMI flash releases, and Australian labor data also created important market-moving moments. Planning ahead for these high-impact releases can help prepare for potential volatility across currencies, commodities, stocks, and indices before the week unfolds.
 
Monday 22 June 2026

Intel’s Rally Was a Foundry Validation Move, Not Just a Tech Bounce​

Intel’s latest stock movement was not simply a broad semiconductor rally. It was a sharp re-rating of the company’s turnaround story after President Donald Trump said Apple had agreed to work with Intel to design and manufacture chips in the United States.

The market reaction was strong because Apple was not just another potential customer. For Intel, Apple represented a high-profile validation of its foundry strategy — the part of the business where Intel manufactures chips designed by other companies. That business had been central to Intel’s attempted comeback, but investors had repeatedly questioned whether the company could attract enough top-tier customers to compete with Taiwan Semiconductor Manufacturing Company.

That was why the Apple headline mattered so much. If confirmed and converted into meaningful production, the partnership would give Intel a major customer, strengthen confidence in its U.S. manufacturing roadmap, and show that large technology companies were willing to look beyond TSMC for advanced chip capacity.

The move also came at a moment when the broader setup was supportive. Semiconductor stocks were already benefiting from renewed AI momentum, stronger demand for chip capacity, and easing inflation concerns after oil prices cooled. Intel, however, outperformed because the Apple news directly touched the biggest question around the company: could Intel turn its manufacturing arm into a credible external foundry business?

The timing also helped. Intel had already been building a stronger comeback narrative. The company had received major political backing through the U.S. government’s 10% stake, attracted strategic attention from major technology buyers, advanced its next-generation manufacturing roadmap, and recently pushed its 18A-P process into risk production. Each of those developments made the market more willing to believe that Intel’s turnaround was becoming real.

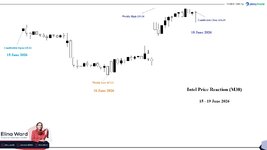
From the chart, Intel finished the week with a 3.94% gain from open to close, while the move from the weekly low to the weekly high showed a much sharper 15.49% rebound.

Price Action Summary​

MovementFromToPoint Move% MoveVisual Move
Open to Close129.16134.25+5.09+3.94%🟢 +5.09 / +3.94% ↗️
Weekly Low to Weekly High117.21135.36+18.15+15.49%🟢 +18.15 / +15.49% ↗️

For Apple, the logic was different. Apple already designed its own chips and relied heavily on external manufacturing partners. Working with Intel could help diversify its supply chain, reduce dependence on TSMC, and add U.S.-based production capacity at a time when AI demand was stretching chip foundries. That made the potential deal strategically useful for Apple, but the upside was much more transformational for Intel.
Still, the rally carried risk. Neither Intel nor Apple had confirmed detailed terms at the time of the reports, and no specific chip types, production volumes, or financial impact were disclosed. That meant investors were not pricing in confirmed earnings yet; they were pricing in a higher probability that Intel’s foundry business could finally win blue-chip customers.

The key takeaway was simple: Intel moved because the market saw the Apple announcement as a credibility event. The stock reaction reflected renewed confidence that Intel’s turnaround, U.S. manufacturing strategy, and foundry ambitions were gaining traction — but the next stage depended on whether the partnership became a confirmed, material, revenue-generating agreement.

Profit Study:

Imagine catching the weekly low at 117.21 — with 1:20 leverage and a 100-unit position, the required margin would have been just $586.05. From there, Intel rallied to the weekly high, creating an 18.15-point move, equal to a potential $1,815 profit, excluding spreads, commissions, and financing costs.

The beauty? You did not need to catch the exact weekly high. Any exit above the 117.21 entry level would have kept the position in profit, while the full low-to-high move showed how powerful the weekly reversal became.
 

Attachments

Tuesday 23 June 2026

BTCUSD Fell as Middle East Relief Rally Faded Under Hawkish Fed Pressure

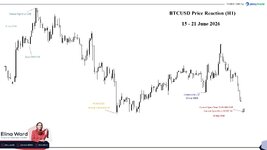
BTCUSD moved through a volatile week between 15 and 21 June 2026. According to the chart, Bitcoin opened the period at 65,607.84 on 15 June, climbed to a weekly high of 67,273.66, then reversed sharply and fell to a weekly low of 62,253.35 on 18 June. By 21 June, BTCUSD closed at 63,285.58, leaving the market down 3.54% from open to close, while the move from the weekly high to the weekly low marked a 7.46% decline. The pressure also extended into the next current open, with BTCUSD opening at 62,367.10 on 23 June at 10:00 AM GMT, another 1.45% below the weekly close.

Price Action Summary

MovementPeriodFromToPoint Move% MoveVisual Move
Open to Close15–21 Jun 202665,607.8463,285.58-2,322.26-3.54%🔴 -2,322.26 ↘ / -3.54%
Weekly High to Weekly Low15–18 Jun 202667,273.6662,253.35-5,020.31-7.46%🔴 -5,020.31 ↘ / -7.46%
Weekly Close to Current Open21–23 Jun 202663,285.5862,367.10-918.48-1.45%🔴 -918.48 ↘ / -1.45%

The first major move came on 15 June, when Bitcoin rallied alongside broader risk sentiment as markets reacted to easing geopolitical stress in the Middle East. Reports of a U.S.–Iran preliminary agreement and expectations that the Strait of Hormuz would reopen reduced the immediate energy-supply shock. Oil prices fell as part of the war premium was priced out, helping investors look more positively at risk-sensitive assets. For Bitcoin, the connection was indirect but important: lower oil prices can ease inflation pressure, and lower inflation pressure can support expectations for a more favorable liquidity backdrop.

However, the rally was not built on strong crypto-specific momentum. Bitcoin entered the week with sentiment already fragile after earlier June pressure. Investors had been rotating attention and capital toward artificial intelligence and large technology-related opportunities, while Bitcoin ETF flows had weakened. Strategy’s first Bitcoin sale since 2022 also added to market caution because the company had long represented one of the strongest institutional conviction trades in Bitcoin. This background made the 15 June rally vulnerable to fading once the initial relief reaction passed.

On 16 June, BTCUSD began to lose momentum from the high area. The market was no longer only reacting to the peace-deal headline; traders were also questioning how quickly the Hormuz reopening and broader energy normalization would actually take place. At the same time, investors were waiting for the Federal Reserve’s upcoming policy decision. Bitcoin’s pullback suggested that the early relief rally had moved faster than the confirmed macro improvement behind it.

The defining reversal came around 17–18 June. The Federal Reserve held rates steady, but the message was more hawkish than markets had hoped. Under Kevin Warsh’s first Fed decision, policymakers signaled that a rate increase later in the year remained possible, while inflation concerns stayed central. The dollar and Treasury yields moved higher, equities came under pressure, and Bitcoin lost momentum. This became the most important macro catalyst of the week because BTCUSD remains highly sensitive to liquidity expectations. A stronger dollar and higher yields generally make speculative, non-yielding assets less attractive, and Bitcoin traded under that pressure.

By 18 June, BTCUSD had fallen to the weekly low of 62,253.35. The move reflected a broader adjustment to a higher-for-longer rate environment, combined with already weak crypto sentiment from ETF outflows, AI-sector rotation, and Strategy-related concerns. The decline was not the result of one single crypto headline. It was better understood as a macro-liquidity repricing layered on top of fragile market confidence.

From 19 to 21 June, Bitcoin stabilized after the sharp Fed-driven selloff, but the recovery remained limited. After falling toward the 62,000 area, buyers returned cautiously, yet BTCUSD still closed the week at 63,285.58, below its 15 June opening level. That showed the market had not fully recovered from the midweek reversal. The next current open at 62,367.10 on 23 June suggested that selling pressure had not fully disappeared after the weekly close.

Overall, BTCUSD’s movement from 15 to 21 June was shaped by three main forces: a geopolitical relief rally at the start of the week, a hawkish Federal Reserve repricing in the middle of the week, and a limited technical recovery into the weekend. The early rally showed how quickly Bitcoin could respond to improved risk sentiment, but the final close showed that the market remained vulnerable to inflation concerns, interest-rate expectations, dollar strength, and weaker confidence in crypto-linked institutional demand.


Attachments

Wednesday 26 June 2026


Gold Lost Its Safe-Haven Shine as Fed Rate Bets Took Control​

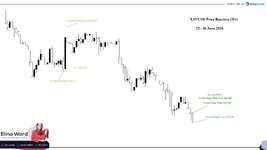
Gold moved through a volatile but increasingly bearish structure between Monday 22 June and Wednesday 24 June 2026, as the market shifted its focus from Middle East supply risk to U.S. monetary policy. XAUUSD initially found support at the start of the week, but that support faded quickly as the U.S. dollar strengthened and traders increased expectations that the Federal Reserve may raise interest rates again this year.

On Monday 22 June, gold recovered from a recent low as optimism around U.S.–Iran peace talks pushed oil prices lower. The drop in oil helped reduce fears that energy-driven inflation would keep rising, which gave gold a temporary lift. Spot gold rose around 0.5% to $4,220.39, although U.S. gold futures still settled lower, showing that the market was not fully convinced the rebound could last.

By Tuesday 23 June, the tone changed sharply. Gold fell as the U.S. dollar climbed to its highest level in more than a year. A stronger dollar usually pressures gold because it makes the metal more expensive for buyers using other currencies. More importantly, investors began pricing in a higher probability of Federal Reserve rate hikes after the Fed’s hawkish June meeting.

The market’s message was clear: gold was no longer reacting mainly to Middle East headlines. It was reacting to interest-rate expectations.

This matters because gold does not pay interest. When traders expect higher rates, Treasury yields and dollar assets become more attractive, while non-yielding assets such as gold lose some appeal. That is why even softer oil prices and progress in U.S.–Iran talks were not enough to support XAUUSD.

By Wednesday 24 June, gold extended its decline and touched a near two-week low. Spot gold slipped to around $4,050.43, while U.S. gold futures also moved lower. The decline reflected three connected forces: a stronger U.S. dollar, higher expected interest rates, and weaker investment demand.

The upcoming U.S. PCE inflation release became the next major focus for gold traders. Core PCE is the Federal Reserve’s preferred inflation gauge, and the market was watching it closely for confirmation of whether inflation pressure remained strong enough to justify further rate hikes. Forecasts pointed to another firm monthly reading, keeping gold under pressure ahead of the data.

In short, gold behaved this way because the market moved from “geopolitical hedge” mode into “Fed tightening” mode. Lower oil prices reduced one source of inflation fear, but they also reduced gold’s safe-haven support. At the same time, the stronger dollar and rising rate-hike expectations created a heavier headwind.

Unless PCE data comes in softer than expected or the dollar rally weakens, XAUUSD may struggle to regain strong upside momentum in the near term. However, deeper declines could still attract central-bank demand and long-term buyers, meaning the market remains vulnerable to sharp reversals if macro conditions shift again.

The key takeaway: gold did not fall because geopolitical risk disappeared completely. It fell because the Fed and the dollar became more powerful drivers than the war premium.


Profit Study:​

With 1:500 leverage, opening one standard XAUUSD lot at 4,220.39 would require approximately $844.08 in margin. With 1:2000 leverage, the required margin would be around $211.02.

From 4,220.39 to the weekly low of 4,037.52, gold moved 182.87 points lower. On one standard lot, where each $1 move in gold is worth approximately $100, that decline represented a potential gross $18,287 opportunity for a short position.

This is where volatility turns into opportunity. Capturing the full move is never easy, but even a controlled entry within that range could have delivered a meaningful result for traders who understood the risk and reacted quickly.

When inflation pressure rises, rate expectations shift, and the dollar strengthens, gold can come under pressure. But when macro fear returns or rate expectations cool, gold can reverse sharply. The real question is simple: are you just watching the headlines, or are you ready for the move?
 

Attachments

Last edited:
Friday 25 June 2026

Brent Crude Oil Fell as Hormuz Supply Fears Faded and Middle East Risk Premium Unwound​

Brent Crude Oil Price Movement: 22–25 June 2026​

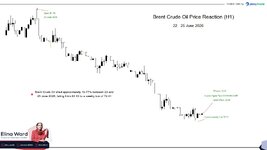
Brent crude oil moved sharply lower between 22 June and 25 June 2026, as the market rapidly repriced the risk of a prolonged Middle East supply disruption. After settling at $77.90 per barrel on 22 June, Brent extended its decline through the week and moved toward the $72–$73 range by 25 June.

The move represented a fall of roughly 6.6% over the period, as traders shifted away from wartime supply fears and began pricing in a faster return of oil flows through the Strait of Hormuz.

The main driver behind the decline was not weaker demand alone. The sharper catalyst was the easing of geopolitical risk. Progress in US–Iran peace efforts, the reopening of tanker routes, and the return of more visible shipping activity through Hormuz reduced the fear premium that had supported crude prices during the conflict.

What Caused Brent Crude Oil to Fall?​

The first major factor was the improvement in oil traffic through the Strait of Hormuz. The strait is one of the world’s most important energy chokepoints, and any disruption there can immediately lift crude prices. During the week, however, reports showed that more tankers were exiting the Gulf, including stranded vessels that had been unable to move freely during the conflict.

This created the impression that the worst-case supply scenario was becoming less likely. As more barrels began moving out of the region, traders reduced their exposure to higher oil prices.

The second factor was progress in US–Iran peace talks. Markets had previously priced in the risk that the conflict could keep Hormuz restricted for longer, limiting Middle Eastern exports and tightening global supply. But as diplomatic momentum improved, Brent began giving back its wartime gains. The market started to treat the situation less like a supply crisis and more like a temporary disruption moving toward normalization.

The third factor was the temporary relief around Iranian oil exports. A short-term easing of restrictions allowed more Iranian crude and already-loaded cargoes to enter the market. This added to expectations of rising supply and helped push physical crude prices lower across several regions.

Another important signal came from the Brent forward curve. The prompt Brent spread shifted into bearish contango, meaning near-term contracts traded below later-dated contracts. This usually suggests that the market sees sufficient or even excessive short-term supply. For traders, that was a strong sign that the immediate shortage fear had faded.

Why the Drop Was So Sharp​

Brent’s decline was sharp because the market had been carrying a significant geopolitical premium. When oil prices rise because of war risk, they can fall quickly once that risk begins to unwind.

From 22 June onward, the market received several bearish signals at the same time: peace talks were progressing, more tankers were moving through Hormuz, physical cargo discounts were spreading, and short-term supply expectations improved. Together, these factors triggered a fast repricing.

The decline was also supported by concerns over demand. Slower global growth fears and softer demand signals from major consumers added pressure to the market. However, demand was not the main story. The main story was the return of supply confidence.

Market Reaction​

By 25 June, Brent had moved close to levels last seen before the Iran war began. That was significant because it showed that traders were no longer pricing the conflict as a major ongoing threat to global oil supply.

The fall in Brent also affected broader markets. Lower oil prices helped ease inflation concerns, supported sentiment in fuel-sensitive sectors such as airlines, and reduced pressure on economies exposed to energy import costs. At the same time, the sharp drop created pressure on energy producers and reflected growing caution across the physical crude market.

Outlook​

The key question now is whether the normalization of Hormuz traffic can continue. A full return to normal shipping may still take time because of mine-clearance issues, insurance concerns, damaged infrastructure, and political uncertainty around the US–Iran agreement.

If tanker flows continue to recover, Brent could remain under pressure. But if the peace process weakens or shipping risks return, oil could quickly regain a geopolitical premium.

For now, the message from the market is clear: Brent crude fell because supply fear faded faster than expected. The market moved from pricing a prolonged energy crisis to pricing a gradual return of Middle Eastern barrels.


Potential Profit Study​

A short entry on XBRUSD at 81.15 with 1 standard lot would have required approximately $405.75 in margin when using 1:200 leverage.

From 81.15 to the current weekly low of 72.41, Brent Crude Oil moved approximately 8.74 points lower. On a 1 standard lot position, this movement could have represented a potential gross profit of around $8,740 before trading costs.

This example highlights how strong market volatility can create trading opportunities. Traders who were actively following the news and staying up to date with developments in the region would have been better positioned to anticipate the move and stay ahead of the market. They would not have needed to capture the full move to benefit from the price swing. Even securing part of the decline could have produced a meaningful result for those with a clear strategy, effective risk management, and a strong understanding of the market catalyst behind the move.
 

Attachments

Friday 26 June 2026

📊 High-Impact Economic Calendar – 28 June – 3 July 2026​

🌍 Week Overview

This week focused on China PMI data, Eurozone inflation, German and French economic releases, U.S. labor market data, Canadian GDP, and Japanese retail/industrial indicators. The strongest volatility windows were expected around China NBS Manufacturing PMI, Eurozone CPI, U.S. ADP and NFP labor data, and Canada GDP.

Times in GMT

All events are 🔴 HIGH IMPACT for traders

📅 Sunday, 28 Jun 2026​

TimeCountryEventForecastPreviousImpact
23:50🇯🇵 JPRetail Sales MoM (MAY)0.7%1.3%🔴 High

📅 Monday, 29 Jun 2026​

TimeCountryEventForecastPreviousImpact
14:30🇺🇸 USDallas Fed Manufacturing Index (JUN)20.4🔴 High
23:30🇯🇵 JPUnemployment Rate (MAY)2.5%2.5%🔴 High
23:50🇯🇵 JPIndustrial Production MoM Prel (MAY)0.3%0.5%🔴 High

📅 Tuesday, 30 Jun 2026​

TimeCountryEventForecastPreviousImpact
01:30🇨🇳 CNNBS Manufacturing PMI (JUN)50.350.0🔴 High
01:30🇦🇺 AURBA Meeting Minutes🔴 High
06:00🇩🇪 DERetail Sales MoM (MAY)0.1%-0.3%🔴 High
06:45🇫🇷 FRPPI MoM (MAY)1.5%-2.1%🔴 High
06:45🇫🇷 FRInflation Rate MoM Prel (JUN)0.4%0.1%🔴 High
06:45🇫🇷 FRInflation Rate YoY Prel (JUN)2.4%2.4%🔴 High
06:45🇫🇷 FRPPI YoY (MAY)4.6%2.1%🔴 High
07:55🇩🇪 DEUnemployment Rate (JUN)6.4%6.3%🔴 High
12:00🇩🇪 DEInflation Rate YoY Prel (JUN)2.9%2.6%🔴 High
12:00🇩🇪 DEInflation Rate MoM Prel (JUN)0.3%-0.2%🔴 High
12:30🇨🇦 CAGDP MoM (APR)0.4%-0.1%🔴 High
13:45🇺🇸 USChicago PMI (JUN)61.062.7🔴 High
14:00🇺🇸 USCB Consumer Confidence (JUN)95.093.1🔴 High
14:00🇺🇸 USJOLTS Job Openings (MAY)7.6M7.618M🔴 High
23:50🇯🇵 JPTankan Large Non-Manufacturing Index (Q2)3436🔴 High
23:50🇯🇵 JPTankan Large Manufacturers Index (Q2)1317🔴 High

📅 Wednesday, 1 Jul 2026​

TimeCountryEventForecastPreviousImpact
01:30🇦🇺 AUBuilding Permits MoM Prel (MAY)4.5%-3.4%🔴 High
01:45🇨🇳 CNRatingDog Manufacturing PMI (JUN)51.451.8🔴 High
05:00🇯🇵 JPConsumer Confidence (JUN)32.033.6🔴 High
06:30🇨🇭 CHRetail Sales MoM (MAY)-0.1%0.1%🔴 High
09:00🇪🇺 EAInflation Rate MoM Flash (JUN)0.3%0.1%🔴 High
09:00🇪🇺 EAInflation Rate YoY Flash (JUN)3.2%3.2%🔴 High
09:00🇪🇺 EACore Inflation Rate YoY Flash (JUN)2.6%2.6%🔴 High
09:00🇪🇺 EACPI Flash (JUN)103.5103.13🔴 High
12:15🇺🇸 USADP Employment Change (JUN)85K122K🔴 High
14:00🇺🇸 USISM Manufacturing PMI (JUN)53.654.0🔴 High
22:45🇳🇿 NZBuilding Permits MoM (MAY)-6.3%10.9%🔴 High

📅 Thursday, 2 Jul 2026​

TimeCountryEventForecastPreviousImpact
01:30🇦🇺 AUBalance of Trade (MAY)A$1.5BA$1.791B🔴 High
06:30🇨🇭 CHInflation Rate YoY (JUN)0.7%0.6%🔴 High
09:00🇪🇺 EAUnemployment Rate (MAY)6.3%6.3%🔴 High
12:30🇺🇸 USUnemployment Rate (JUN)4.5%4.3%🔴 High
12:30🇺🇸 USNon-Farm Payrolls (JUN)90K172K🔴 High
12:30🇺🇸 USInitial Jobless Claims (JUN/27)210K215K🔴 High
14:00🇺🇸 USFactory Orders MoM (MAY)-1.7%4.8%🔴 High

📅 Friday, 3 Jul 2026​

TimeCountryEventForecastPreviousImpact
06:45🇫🇷 FRIndustrial Production MoM (MAY)0.5%0.1%🔴 High

📌 Week Summary​


This week’s main focus centered on China manufacturing data, Eurozone inflation, U.S. labor market releases, and Canadian GDP, with the strongest expected volatility likely around China NBS Manufacturing PMI, U.S. Non-Farm Payrolls, U.S. ADP Employment Change, and Eurozone CPI Flash. Planning ahead for these high-impact releases can help prepare for potential volatility across currencies, commodities, stocks, and indices before the week unfolds.

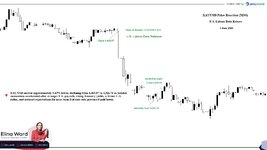
Below is a chart illustrating how a high-impact U.S. labor data release affected XAU/USD on June 5, 2026, with price action shown on a 30-minute candlestick timeframe.

Friday 5 June 2026 U.S. Labour Data Release

U.S. job growth came in much stronger than expected in May, with nonfarm payrolls rising by 172,000 compared with the 80,000 forecast, while the unemployment rate held steady at 4.3%. Wage growth remained stable, with average hourly earnings increasing 0.3% for the month and 3.4% year-on-year, both in line with expectations. Job gains were broad, led by leisure and hospitality, local government, and health care, while prior months were also revised higher, reinforcing the view that the labor market remained resilient despite inflation and high energy prices. The strong report pushed Treasury yields higher and reduced expectations for near-term Federal Reserve rate cuts, leaving policymakers more likely to maintain a wait-and-see approach as they focused on inflation risks rather than labor market weakness.


Potential Profit Study

An entry on XAU/USD at 4,465.07 with 1 standard lot would have required approximately $893.01 in margin at 1:500 leverage. With 1:2000 leverage, the required margin would have decreased to around $223.25.

The move from 4,465.07 down to the intraday low of 4,311.71 covered approximately 153.36 points. On a 1 standard lot position, this would represent a potential profit of around $15,336 if the move was captured in the correct direction.

This example highlights the power of volatility during high-impact market releases. The full move did not need to be captured perfectly — even securing part of the price swing could have created a meaningful opportunity for those who had a clear strategy, managed risk effectively, and understood the impact of the underlying market catalyst.
 

Attachments

Monday 29 June 2026

Apple Stock Fell as AI Costs Hit Hardware Prices​


Apple Stock Price Reaction: 22–26 June 2026​

Apple shares moved lower last week as investors reacted mainly to Apple’s hardware price increases, while broader caution around megacap tech and the AI trade added further pressure.

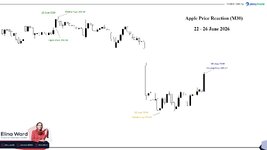
According to the chart, AAPL opened the week at $299.20 on Monday, 22 June, before reaching a weekly high of $302.36. However, the early strength faded as investors became more cautious about whether rising AI-related costs could start affecting consumer technology companies.

The strongest selling pressure came on Thursday, 25 June, when Apple fell to a weekly low of $273.66. The decline followed Apple’s decision to raise prices on several products, including MacBooks and iPads, as memory and storage costs increased sharply.

The market did not view the price hikes only as a sign of Apple’s pricing power. Instead, investors saw them as a warning that the AI boom is pushing up component costs across the consumer hardware supply chain. Higher prices raised concerns about demand, margins, and whether customers would continue absorbing more expensive devices.

By Friday, 26 June, Apple recovered part of the decline and closed at $285.27. The rebound suggested some investors viewed the selloff as overdone, but the recovery did not erase the weekly damage.

From the weekly open of $299.20 to the Friday close of $285.27, Apple fell around 4.66%. From the weekly high of $302.36 to the weekly low of $273.66, the stock moved nearly 9.49% lower.

In simple terms, the market shifted from asking how much Apple can benefit from AI to asking how much AI will cost Apple. Last week showed that even the strongest tech names can come under pressure when supply-chain inflation starts affecting prices, margins, and consumer demand.

Profit Study:

Imagine catching the weekly high at 302.36 with a short position. With 1:20 leverage and a trade size of 100 units, the required margin would have been just $1,511.80.

From there, Apple fell to 273.66, creating a 28.70-point move, equal to a potential $2,870 profit.

The key point? You did not need to catch the exact weekly high. Any exit below the 302.36 entry level would have kept the short position in profit, while the full high-to-low move shows how powerful the weekly selloff became.
 

Attachments

Latest Posts

Live Forex Chart

Currency
Rates
EUR / USD
1.14718
USD / JPY
156.271
GBP / USD
1.33804
USD / CHF
0.82590
USD / CAD
1.39882
EUR / JPY
179.152
AUD / USD
0.70868
Back
Top
Log in Register