BTC USD 83,918.7 Gold USD 4,285.46
Time now: Jun 1, 12:00 AM

Tifia Daily Market Analytics

AUD/USD: Current Dynamics
06/18/2019

As follows from the minutes published on Tuesday (01:30 GMT) from the meeting of the RBA, held on June 4, the bank's management signaled a tendency to further easing of monetary policy. Governor of the Reserve Bank of Australia, Philip Lowe, stated that "there is reason to expect a lower key rate". According to the leaders of the central bank, unemployment should fall from the current level of 5.2% to 4.5% in order for inflation to accelerate to the target range of 2% -3%.
Many economists predict two or more rate cuts this year and a key rate reaching a record minimum of 0.75%.
This is a strong fundamental factor in favor of further weakening AUD.
Meanwhile, the attention of financial market participants is shifted to the 2-day Fed meeting, which will end on Wednesday with the publication (at 18:00 GMT) of the interest rate decision. Probably, the rate will remain at the same level of 2.5%. However, signals from the leadership of the Fed in favor of lowering the rate by the end of this year will put downward pressure on the dollar. At the same time, the demand for the US dollar is likely to save.
The US economy looks more resilient in international trade conflicts.
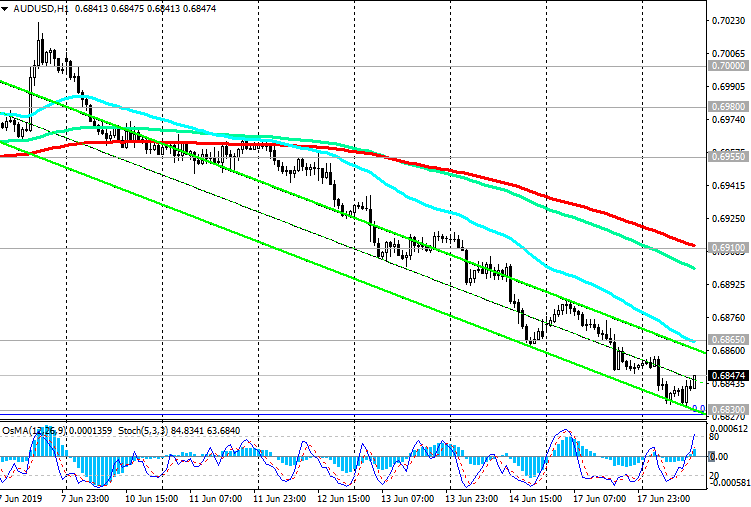
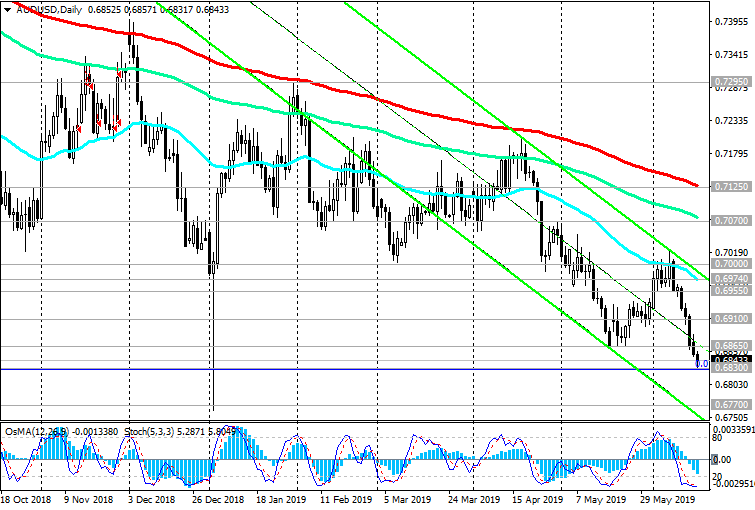
AUD / USD continues to decline, remaining in a long-term bearish trend since July 2014. The lows of the last wave of decline are located near the mark of 0.6830. A strong negative impulse prevails in anticipation of a further reduction in the RBA interest rate. The immediate goal of the decline is located at around 0.6770 (2019 lows).
Below the key resistance levels of 0.7070 (EMA144 on the daily chart), 0.7125 (EMA200 on the daily chart) short positions remain preferable.
Support Levels: 0.6830, 0.6800, 0.6770
Resistance Levels: 0.6865, 0.6910, 0.6955, 0.6980, 0.7000, 0.7070, 0.7125

Trading Recommendations

Sell in the market. Stop Loss 0.6880. Take-Profit 0.6830, 0.6800, 0.6770
Buy Stop 0.6880. Stop Loss 0.6820. Take-Profit 0.6910, 0.6955, 0.6980, 0.7000
180619-AU-D.png

180619-AU-H1.png

*) For up-to-date and detailed analytics and news on the forex market visit Tifia Forex Broker website tifia.com
 
EUR/USD: Current Dynamics
19/06/2019

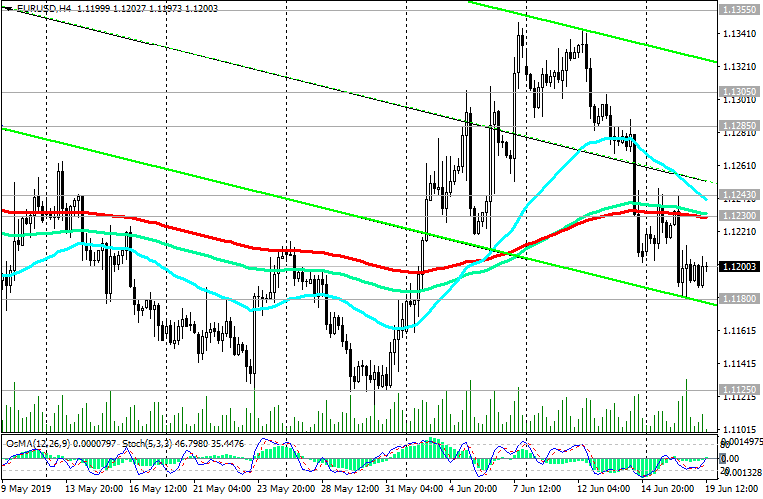
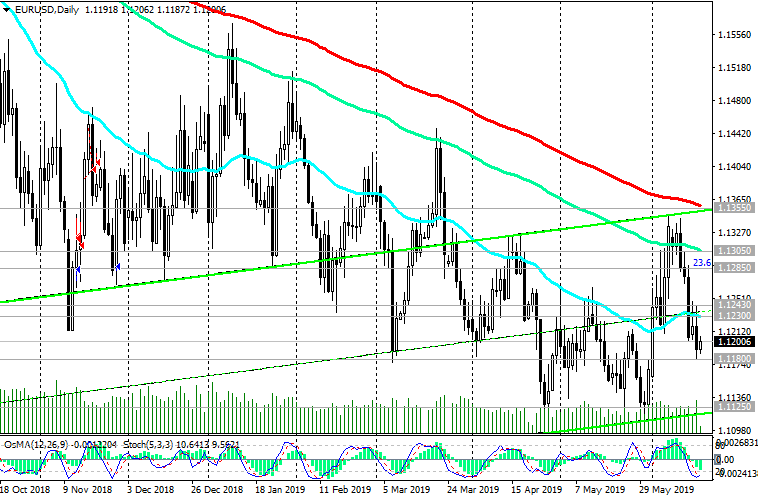
Since May 2014, EUR / USD remains in the global downtrend. At the beginning of the European session on Wednesday, EUR / USD is trading near the 1.1200 mark, below resistance levels 1.1230 (ЕМА200 on the 4-hour chart), 1.1243 (ЕМА200 on the 1-hour chart).
The focus of traders on Wednesday is the publication (at 18:00 GMT) of the Fed decision on rates. It is expected that the rate will remain at the same level of 2.5%. Nevertheless, many financial market participants are waiting for signals from the Fed about the possibility of lowering the rate.
At 18:30 (GMT), the Fed’s press conference will begin. Market participants will analyze the statements of the Fed Chairman to understand how likely a decrease in the rate is in July. The soft tone of the statement and press conference or direct signals aimed at easing monetary policy will cause an increase in stock indices and a fall in the dollar, including against the euro.
The soft monetary policy of the central bank usually contributes to the cheapening of the national currency.
In the current situation, technical analysis fades into the background. Probably the most cautious investors would prefer to stay out of the market during this time period.
Breakdown of the local support level of 1.1180 will accelerate the EUR / USD decline towards annual lows near the support level of 1.1125.
If the Fed announces a rate cut, at least later this year, the dollar will decline and the EUR / USD pair will go towards resistance levels of 1.1285 (Fibonacci level 23.6% of the correction to a fall from the level of 1.3900, which began in May 2014), 1.13050 (EMA144 on the daily chart). Below these levels, negative dynamics prevail; short positions still look better.
Support Levels: 1.1180, 1.1125, 1.1100, 1.1000
Resistance Levels: 1.1230, 1.1243, 1.1285, 1.1305, 1.1355

Trading Recommendations

Sell Stop 1.1170. Stop Loss 1.1250. Take-Profit 1.1125, 1.1100, 1.1000
Buy Stop 1.1250. Stop Loss 1.1170. Take-Profit 1.1285, 1.1305, 1.1355
190619-EU-H4.png

190619-EU-D.png

*) For up-to-date and detailed analytics and news on the forex market visit Tifia Forex Broker website tifia.com
 
USD/JPY: Current Situation
20/06/2019

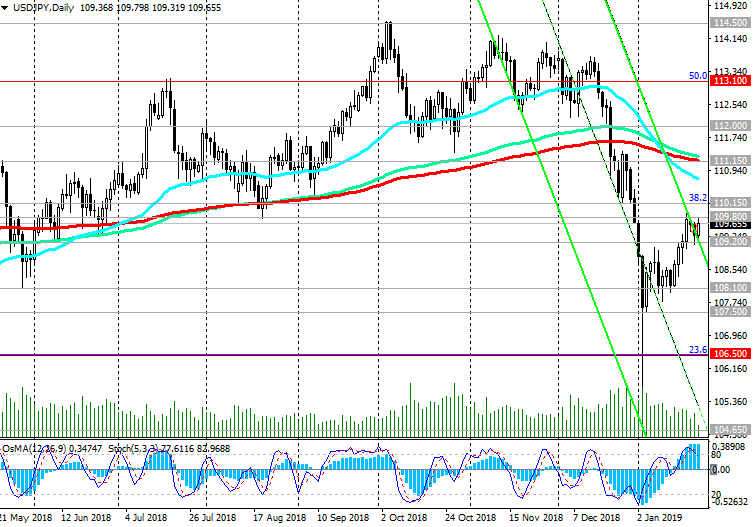
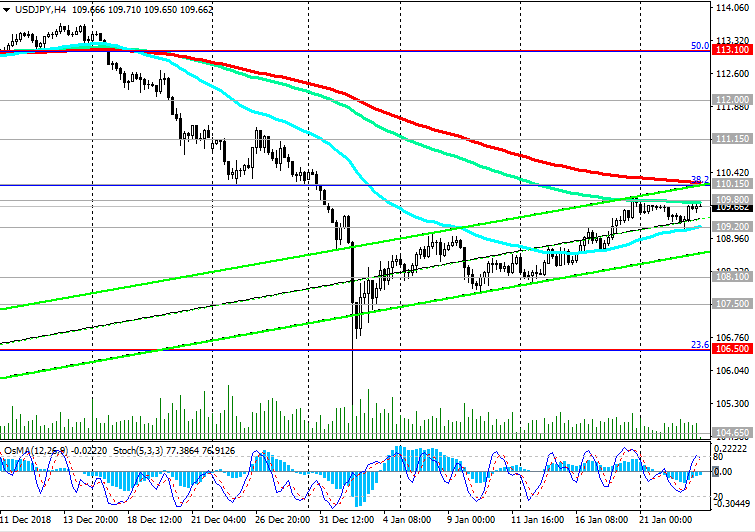
USD / JPY resumed its decline after the Fed meeting ended on Wednesday. As you know, on Wednesday, the Fed kept its monetary policy unchanged. Fed Chairman Jerome Powell said that "the committee (FOMC) wants a clearer picture of the economic situation". At the same time, Powell also said that "the arguments in favor of additional policy easing were strengthened". This statement was considered by investors as a signal to the Fed rate cut soon, and the dollar fell on sales.
On Thursday, the management of the Bank of Japan decided to leave the target level of yield on 10-year Japanese bonds around zero, and the short-term deposit rate at -0.1%.
At the same time, the bank promised to maintain the current extra-soft monetary policy at least until the spring of 2020.
However, this did not prevent further decline of the USD / JPY pair.
In the event of a breakdown of the support level of 107.00, the targets for further decline will be the support levels of 106.50 (Fibonacci level 23.6% of the pair’s fall correction from the level of 125.65 that began in June 2015), 104.70 (2018 lows).
A strong negative dynamic prevails. Short positions are preferred.
Support Levels: 107.30, 107.00, 106.50, 105.00, 104.70
Resistance Levels: 108.35, 108.80, 109.15, 109.70, 110.15, 110.50

Trading scenarios

Buy Stop 108.40. Stop Loss 107.40. Take-Profit 108.80, 109.15, 109.70, 110.15, 110.50
Sell Stop 107.40. Stop Loss 108.40. Take-Profit 107.00, 106.50, 105.00, 104.70
230119-UJ-D.png

230119-UJ-H4.png

*) For up-to-date and detailed analytics and news on the forex market visit Tifia Forex Broker website tifia.com
 
WTI: price increase is corrective in nature
06/21/2019
Current Dynamics

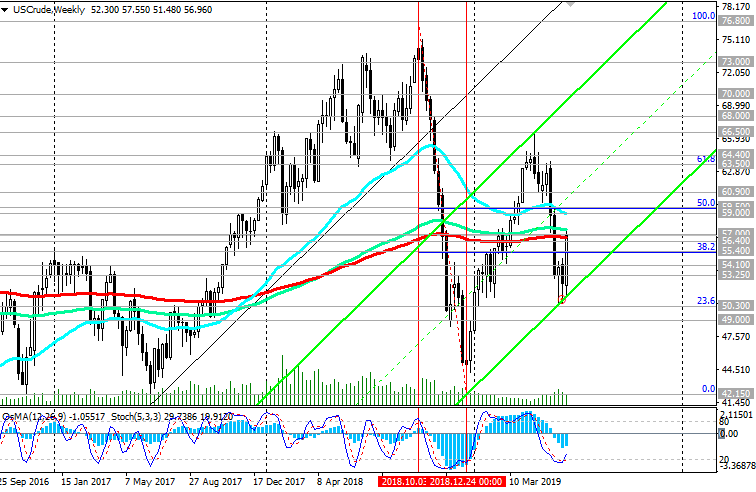
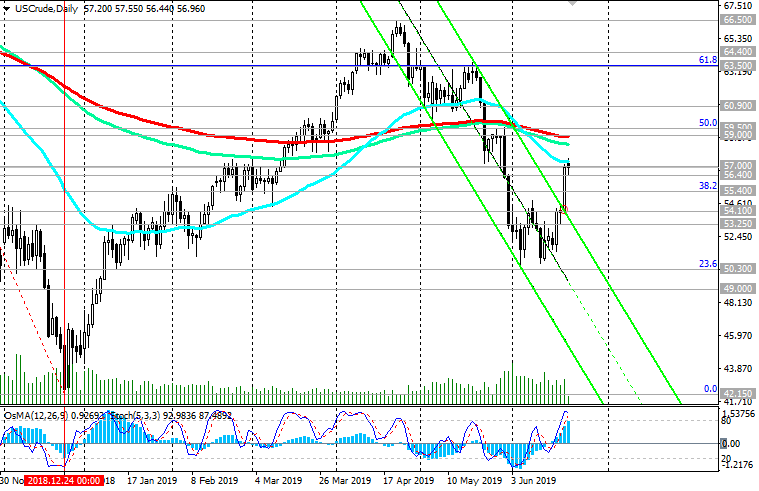
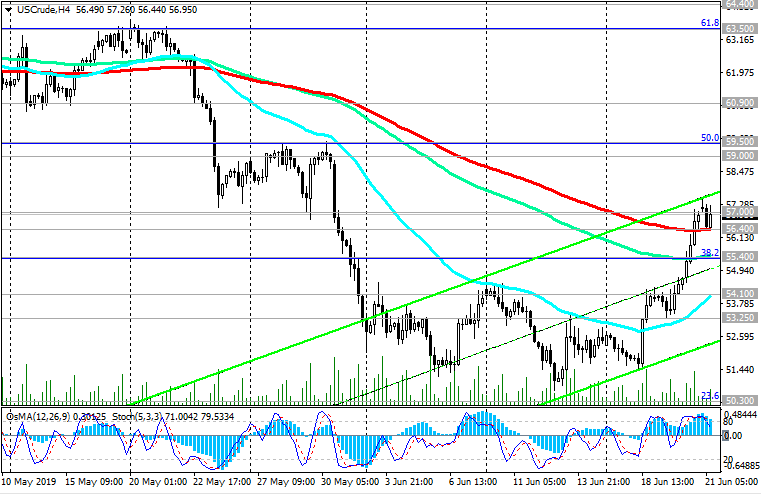
Since the opening of today's trading day, WTI crude oil has been trading in a narrow range near the mark of 57.00 dollars per barrel. One of 3 key resistance levels (ЕМА200 on the weekly chart) passes through this mark. Below this level and resistance levels of 59.50 (Fibonacci level 50% of the upward correction to a fall from the highs of the last few years near the 76.80 mark to the support level near the 42.15 mark), 59.00 (ЕМА200 on the daily chart) is dominated by a long-term negative dynamic.
The current increase in the price of oil, which is observed this week, so far can be described as corrective, provoked by a number of fundamental factors.
This is the growth of geopolitical tensions in the Middle East, as well as the weakening of the dollar, occurring against the backdrop of the Fed's statements about the increased likelihood of monetary easing. After last week two oil tankers were attacked in the Gulf of Oman, on Thursday, US officials reported a missile attack on a desalination plant in Saudi Arabia, which was allegedly inflicted from Yemen. Later, the Islamic Revolutionary Corps announced that it had shot down an American reconnaissance drone over Iranian territory. The United States on Thursday announced preparations for a retaliatory strike on Iran.
Earlier, the Iranian authorities have repeatedly threatened to close the Strait of Hormuz, if US sanctions against Iran are not lifted.
The increased risk of oil supply disruptions from the Middle East, coupled with a weaker dollar, led to a sharp rise in oil prices this week.
On Friday, oil market participants will follow the publication at 17:00 (GMT) of a weekly report on the number of active drilling rigs in the United States from the American oilfield services company Baker Hughes. If the report again indicates a decrease in the number of such installations (788 units at the moment), this may give an additional positive impetus to prices.
Nevertheless, it is premature to consider price growth above key resistance levels 59.00, 59.50.
Below these resistance levels, a long-term bearish trend prevails.
*)An advanced fundamental analysis is available on the Tifia Forex Broker website at tifia.com/analytics

Trading recommendations
At the beginning of the European session, WTI crude oil is priced at $ 57.00 per barrel, below the important resistance levels of 59.50 (Fibonacci 50% of the upward correction to a fall from the highs of the past few years near 76.80 to the support near 42.15), 59.00 (ЕМА200 on the daily chart).
The signal for the resumption of sales will be the breakdown of support levels of 56.40 (ЕМА200 on 4-hour chart), 55.40 (Fibonacci 38.2%) with long-term goals located near the support level of 42.15 (Fibonacci 0% and lows of December 2018).
Support Levels: 56.40, 55.40, 54.10, 53.25, 50.30, 49.00, 42.15
Resistance Levels: 57.00, 59.00, 59.50

Trading recommendations

Sell Stop 55.30. Stop Loss 57.80. Take-Profit 54.10, 53.25, 50.30, 49.00, 42.15
Buy Stop 57.80. Stop Loss 55.30. Take-Profit 59.00, 59.50
210619-WTI-W.png

210619-WTI-D.png

210619-WTI-H4.png


*) For up-to-date and detailed analytics and news on the forex market visit Tifia Forex Broker website tifia.com
 
EUR/USD: Current Dynamics
06/24/2019

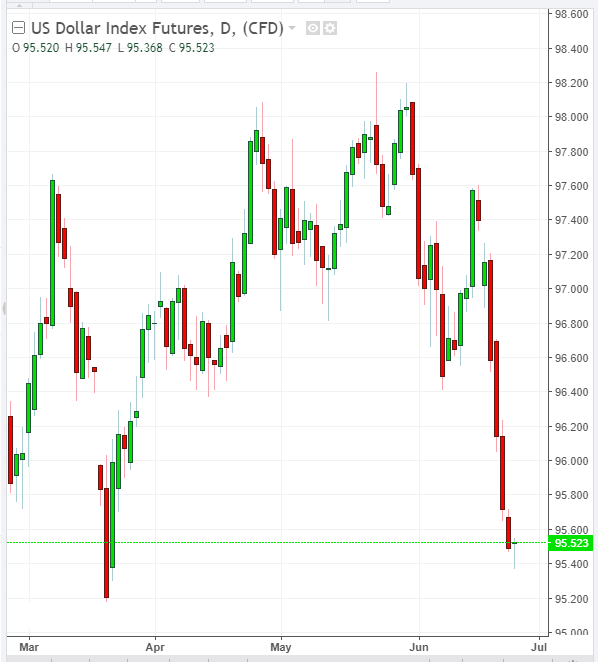
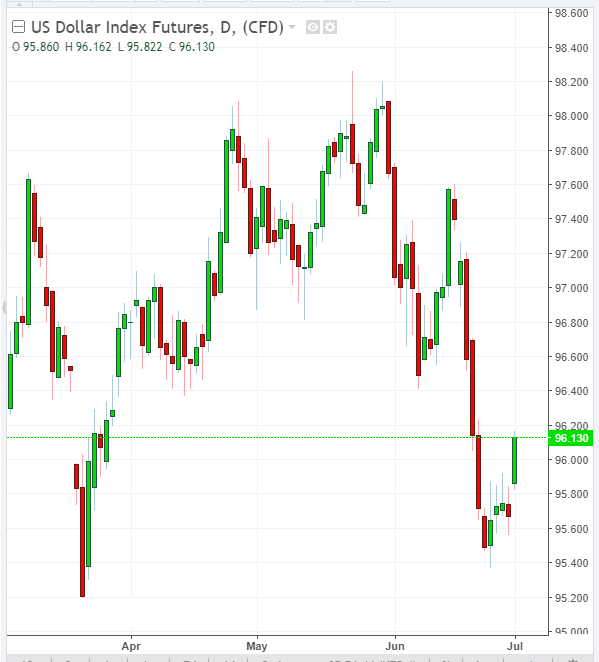
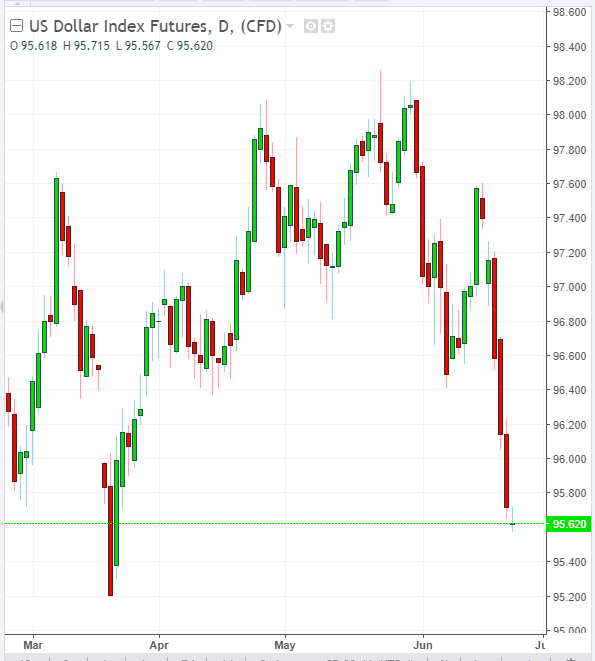
The dollar continued to decline in the first half of the trading day on Monday. At the beginning of the US session, the DXY dollar index futures, reflecting the value of the dollar to a basket of 6 major currencies, is trading near the 95.62 mark, 10 points lower than the closing price last Friday. The weekly drop in the index was the strongest since February 2018. The main driver of the dollar decline in the current situation is the expectation of a Fed rate cut soon.
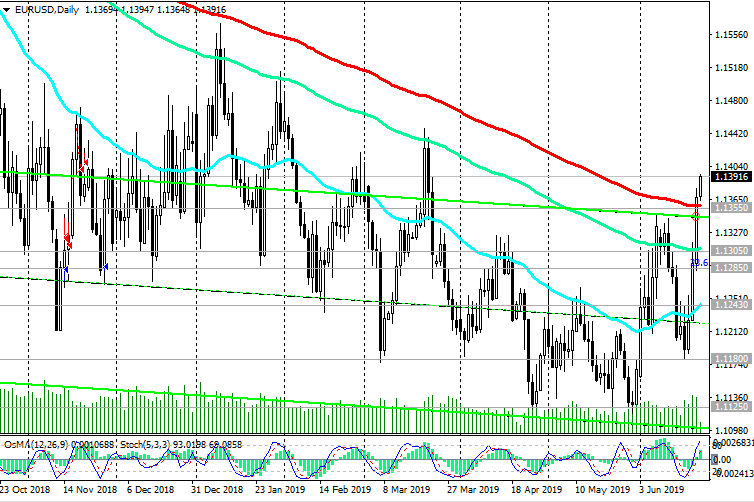
Against the background of a falling dollar, the EUR / USD pair is rising after the pair reached a 3-month high on Friday near the 1.1377 mark. At the beginning of the American session, EUR / USD is trading near the 1.1390 mark after the publication (08:00 GMT) of the IFO indices for Germany, which showed that the European economy is still far away from the recovery.
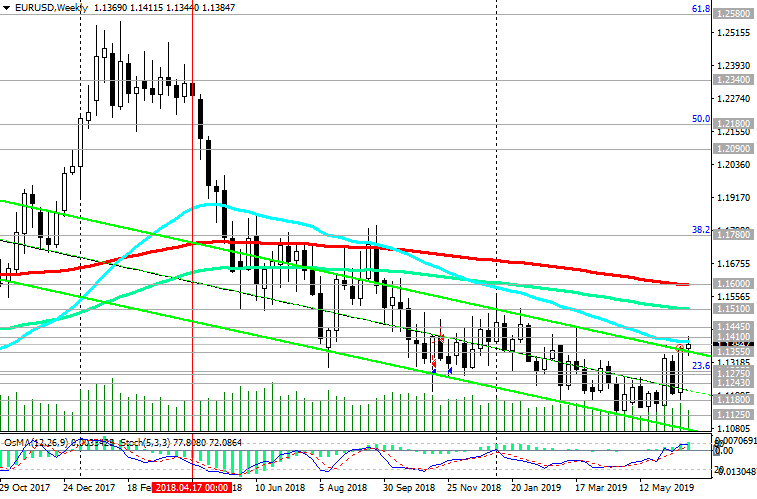
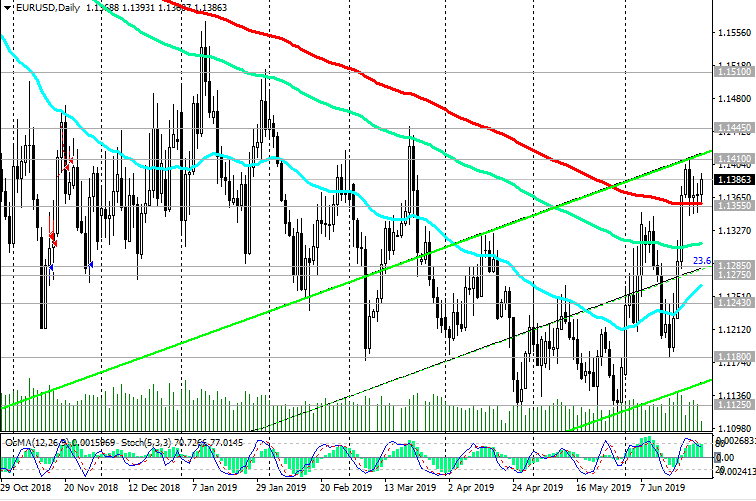
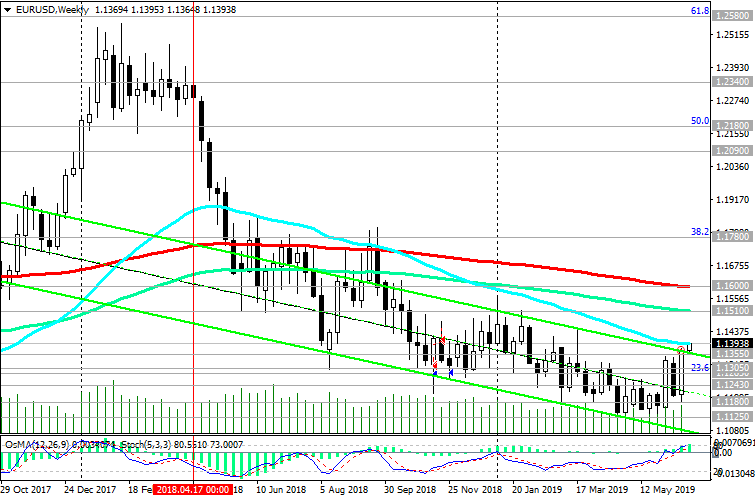
EUR / USD broke through on Friday the key resistance level of 1.1355 and continues to grow towards the 1.1400 mark. The long-term goal of growth is the resistance level of 1.1600 (ЕМА200 on the weekly chart).
However, near the level of 1.1400 possible rebound.
In the case of a return to the zone below the level of 1.1355, short positions will again become relevant.
The breakdown of support levels of 1.1305 (EMA144 on the daily chart), 1.1285 (Fibonacci level 23.6% of the correction to the fall from the level of 1.3900, which began in May 2014) will confirm the return of EUR / USD to the global bearish trend.
Support Levels: 1.1355, 1.1305, 1.1285, 1.1243, 1.1180, 1.1125
Resistance Levels: 1.1400, 1.1510, 1.1600

Trading recommendations

Sell Stop 1.1340. Stop-Loss 1.1415. Take-Profit 1.1305, 1.1285, 1.1243, 1.1180, 1.1125
Buy Stop 1.1415. Stop-Loss 1.1340. Take-Profit 1.1510, 1.1600
240619-DXY.png

240619-EU-W.png

240619-EU-D.png

*) For up-to-date and detailed analytics and news on the forex market visit Tifia Forex Broker website tifia.com
 
NZD/USD: Current Dynamics
06/25/2019

NZD / USD is trying to develop an upward trend caused by the weakening of the USD. On Monday, US President Donald Trump resumed criticism of the Fed’s monetary policy actions, tweeting that "they are like a stubborn child, while we need lower rates and a softer policy to compensate for other countries’ actions against us".
Combined with Trump’s criticism, the soft rhetoric of the Fed’s leadership, and amid weak macro statistics recently coming in from the US, the US dollar has dropped significantly in the foreign exchange market. The DXY dollar index fell 1.85% last week to 95.72. The weekly drop in the index was the strongest since February 2018.
Nevertheless, the current growth of NZD / USD is more like an upward correction, rather than replacing the global downtrend with an uptrend.
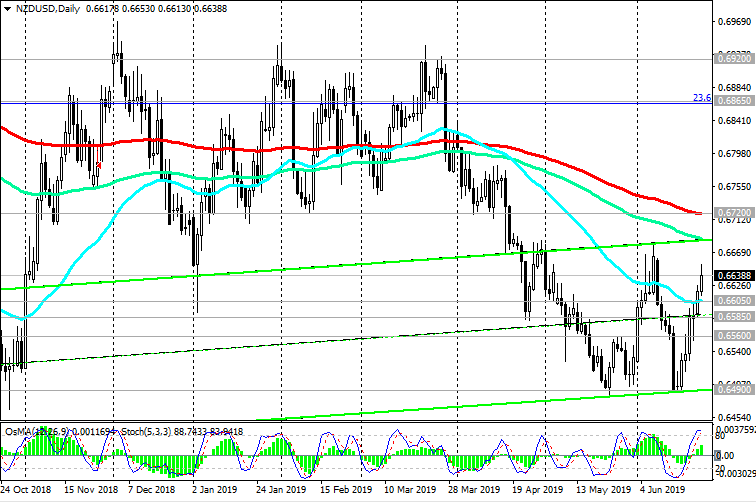
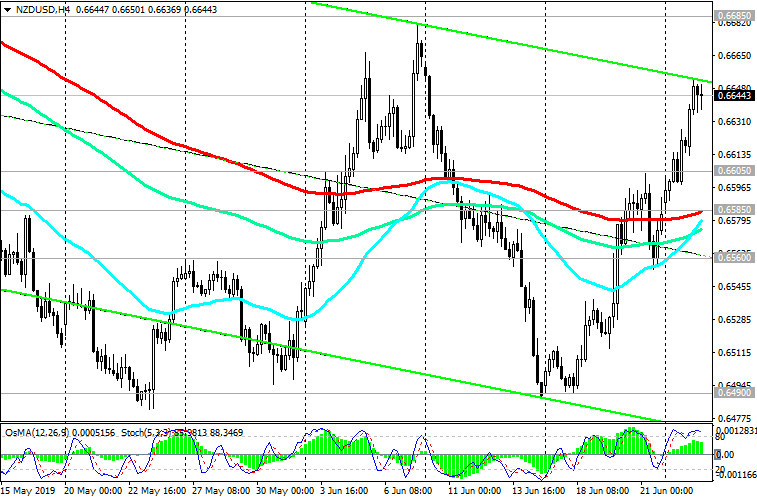
Below the key resistance level of 0.6720 (ЕМА200 on the daily chart) a long-term bearish trend prevails, starting at 0.8820 in July 2014. In view of this, a rebound is possible from the resistance levels of 0.6685, 0.6720.
The return of NZD / USD to the zone below support level 0.6605 (ЕМА50 on the daily chart) will be a signal to resume sales with targets at support levels 0.6430 (2018 lows), 0.6260 (Fibonacci level 0% and lows of the global decline wave from 0.8820, which started in July 2014).
Support Levels: 0.6605, 0.6585, 0.6560, 0.6490, 0.6430, 0.6400, 0.6300, 0.6260
Resistance Levels: 0.6685, 0.6720, 0.6800, 0.6865, 0.6920

250619-DXY.png

250619-NU-D.png

250619-NU-H4.png

*) For up-to-date and detailed analytics and news on the forex market visit Tifia Forex Broker website tifia.com
 
EUR/USD: Current Dynamics
06/26/2019

The market has lowered its expectations regarding the Fed’s soon monetary easing.
Speaking at the Council on Foreign Relations in New York on Tuesday, Fed Chairman Jerome Powell said that "the central bank should not react too sharply to any economic data or short-term changes in sentiment, as this will increase the uncertainty around the outlook for the economy".
From the news for today we are waiting for the publication at 12:30 (GMT) of a block of important macro statistics from the US, which should support the dollar.
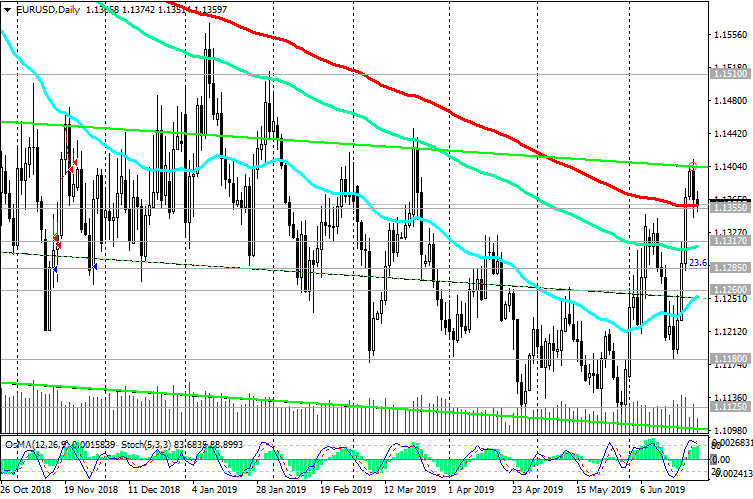
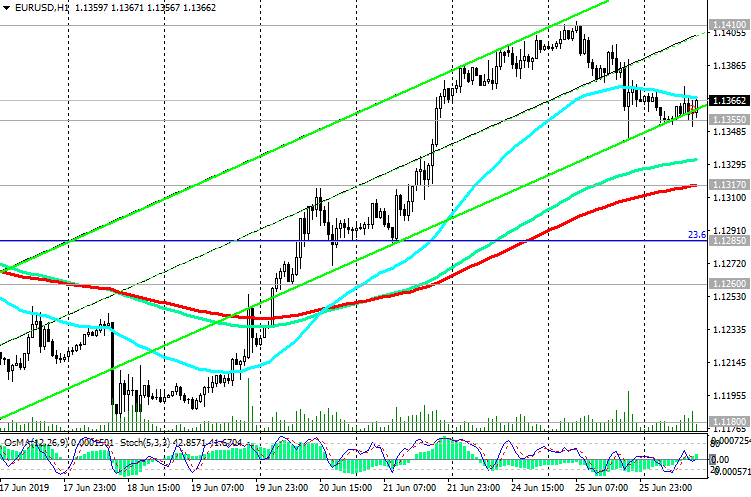
The dollar is gradually recovering previously lost positions, and the EUR / USD pair is attempting to return to the zone below 1.1355 (ЕМА200 on the daily chart) key level, which will mean the recovery of the long-term bearish trend of EUR / USD.
The breakthrough of the short-term support level of 1.1317 (EMA200 on the 1-hour chart) will be a signal for the resumption of sales with targets at the support levels of 1.1285 (Fibonacci 23.6% of the correction to a fall from the level of 1.3900, which began in May 2014), 1.1260 (ЕМА200 on the 4-hour chart), 1.1180 (minimum June), 1.1125 (minimum of a year).
An alternative scenario will be associated with the breakdown of the local resistance level of 1.1410 and further growth of EUR / USD, and the long-term growth target will be the resistance level of 1.1600 (ЕМА200 on the weekly chart).
Support Levels: 1.1355, 1.1317, 1.1285, 1.1260, 1.1180, 1.1125
Resistance Levels: 1.1410, 1.1510, 1.1600

Trading Recommendations

Sell Stop 1.1340. Stop-Loss 1.1415. Take-Profit 1.1317, 1.1285, 1.1260, 1.1180, 1.1125
Buy Stop 1.1415. Stop-Loss 1.1340. Take-Profit 1.1510, 1.1600
260619-EU-D.png

260619-EU-H1.png

*) For up-to-date and detailed analytics and news on the forex market visit Tifia Forex Broker website tifia.com
 
WTI: Current Dynamics
06/27/2019

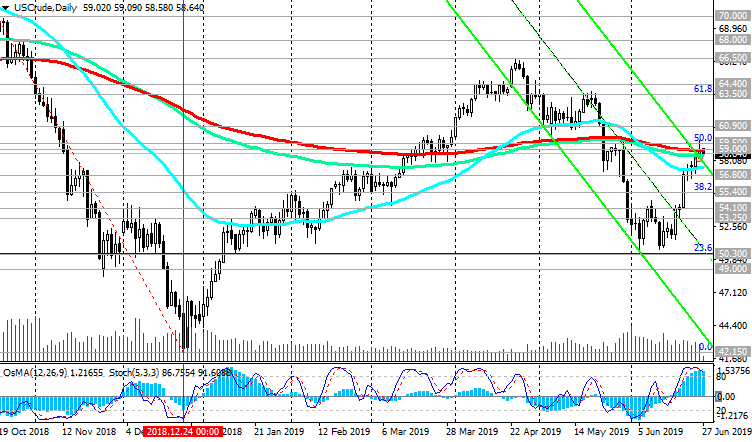
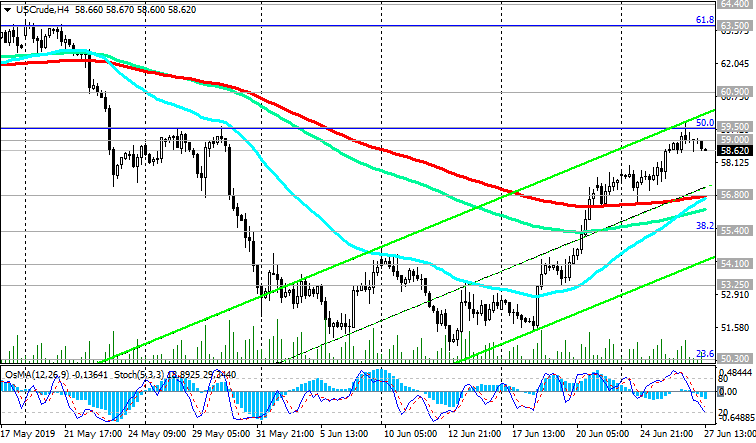
The oil market has a very controversial situation. The growth of geopolitical tensions associated with the situation in the Gulf of Oman, and the threat of interruptions in the supply of oil from this region are pushing prices up. The two-week rally, which began in the middle of the month from a level near the mark of 50.50 dollars per barrel of WTI oil, is happening against this background. On Wednesday, the US Department of Energy published regular weekly data indicating a significant decline in oil reserves in the country (-12.788 million barrels to 470 million barrels). This gave additional upward momentum to oil prices, which allowed them to grow to key levels of 59.50 (Fibonacci 50% of the upward correction to the fall from the highs of the past few years near 76.80 to support near 42.15), 59.00 (ЕМА200 on the daily chart).
At the same time, further growth is constrained by the risks of a slowdown in the global economy and oil consumption.
As expected, at the G20 summit this weekend will meet US President Trump and DPRK President Xi Jinping. Many experts believe that they will not be able to make progress in the negotiations to achieve a trade truce. Negative news from the G20 summit and
concerns about global economic growth may lead to a resumption of lower prices.
On Thursday, WTI crude oil traded near resistance levels of 59.50, 59.00. Below these levels short positions will become relevant again. Only a breakthrough to the zone above the local resistance level of 60.90 will confirm the revival of the bullish trend, and the price will head towards the annual highs near the 66.00 dollars mark. Long-term goals of decline are located at the support level of 42.15 (Fibonacci level of 0% and minimums of December 2018).
Support levels: 56.80, 55.40, 54.10, 53.25, 50.30, 49.00, 42.15
Resistance Levels: 59.00, 59.50, 60.90, 63.50, 64.40, 66.50

Trading Recommendations

Sell Stop 57.50. Stop Loss 60.10. Take-Profit 56.80, 55.40, 54.10, 53.25, 50.30, 49.00, 42.15
Buy Stop 60.10. Stop Loss 57.50. Take-Profit 60.90, 63.50, 64.40, 66.50
270619-WTI-D.png

270619-WTI-H4.png

*) For up-to-date and detailed analytics and news on the forex market visit Tifia Forex Broker website tifia.com
 
EUR/USD: pending new drivers
28/06/2019

Eurodollar rose at the beginning of the European session on Friday. According to the data presented, consumer price indices (CPI) in Italy and France rose in June and were better than forecast. The core consumer price index published at 09:00 (GMT) also showed an increase in consumer inflation in the Eurozone (+1.1% in annual terms, against the forecast of +1.0% and against +0.8% in May).
After the publication of data, EUR / USD rose by 30 points, to the level of 1.1392. The CPI is a key indicator of inflation and an indicator of changes in consumer trends. The high value, as well as the growth of the rate is a positive factor for EUR.
However, EUR / USD was not able to develop an upward trend above 1.1392. Inflation in the Eurozone is still at extremely low levels, well below the target level of the ECB, set at just below 2.0%. Eurozone's core consumer price index (CPI) rose 1.2% in June compared with the same period last year, after a 1.2% increase in May. This is a negative factor for the euro. It is possible that the ECB, at a meeting on July 25, will take additional measures to stimulate the economy.
On Friday, investor attention will be focused on the G-20 leaders meeting in Osaka. Investors are waiting for a shift in the trade confrontation between the United States and China towards a new trade agreement. Probably, trading in financial markets in anticipation of the outcome of the meeting will be held in the range.
If the meeting of Donald Trump and Xi Jinping, which is scheduled for Saturday, ends in nothing, then most likely the global stock indexes will react with a fall, and the demand for defensive assets will rise again. Then the Fed will be forced yet to begin easing monetary policy, which will cause a further weakening of the dollar.
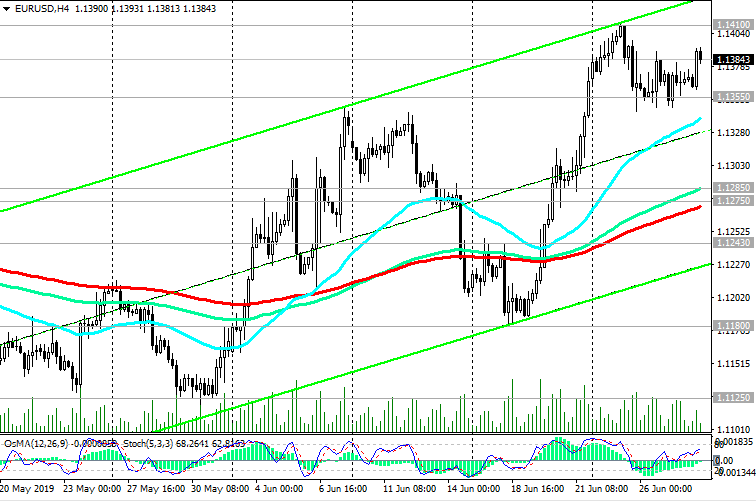
Meanwhile, EUR / USD spent the current week in the range between the local resistance level of 1.1410 and the support level of 1.1355 (ЕМА200 on the daily chart).
The signal for movement in one direction or another will be the breakdown of one of the range boundaries (levels 1.1410, 1.1355).
The reduction targets are located at support levels of 1.1285 (Fibonacci 23.6% of the correction to a fall from 1.3900, which began in May 2014), 1.1275 (EMA200 on the 4-hour chart), 1.1180 (June lows), 1.1125 (minimums of the year); growth targets - at the resistance level of 1.1600 (ЕМА200 on the weekly chart).
Support Levels: 1.1355, 1.1285, 1.1275, 1.1180, 1.1125
Resistance Levels: 1.1410, 1.1510, 1.1600

Trading Recommendations

Sell Stop 1.1340. Stop-Loss 1.1420. Take-Profit 1.1300, 1.1285, 1.1260, 1.1180, 1.1125
Buy Stop 1.1420. Stop-Loss 1.1340. Take-Profit 1.1445, 1.1510, 1.1600
280619-EU-W.png

280619-EU-D.png

280619-EU-H4.png

*) For up-to-date and detailed analytics and news on the forex market visit Tifia Forex Broker website tifia.com
 
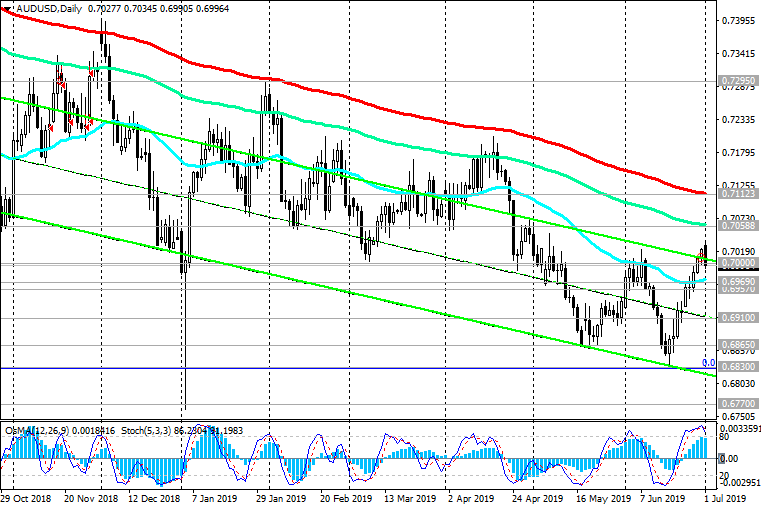
AUD/USD: Current Dynamics
01/07/2019

As part of the G20 summit held in Osaka last Sunday, US President Trump and Chinese President Xi Jinping agreed to suspend a trade war between these countries. The United States will indefinitely postpone the introduction of duties on Chinese goods worth about $ 300 billion, while China promised to start buying large amounts of agricultural products in the United States.
Investors are inspired by the outcome of the G20 summit in Osaka, which ended last weekend, and global stock indices once again rushed up.
The dollar also rose from the opening of today's trading day, and the AUD / USD pair has dropped sharply, despite the very successful start of the trading day.
According to Caixin, in June, the Purchasing Managers Index (PMI) for the manufacturing sector in China fell to 49.4 from 50.2 in May. The indicator for the first time in four months was below the threshold of 50.0, separating the growth of activity from its decline.
The official PMI for the manufacturing sector of China, published by the National Bureau of Statistics of China on Sunday, remained unchanged in June, reaching 49.4, which is also below the threshold of 50.0.
Negative macro statistics from China put pressure on New Zealand and Australian dollars.
On Tuesday, the RB of Australia will decide on the interest rate. Early last month, the Reserve Bank of Australia lowered its key interest rate by 25 bps. to 1.25%, for the first time since August 2016, and its head, Philip Lowe, said that "there is reason to expect a lower key rate".
As expected, on Tuesday, the RBA will again lower its interest rate by 0.25% to 1.00%. This is a strong negative fundamental factor for AUD.
Publication of the RBA decision on rates is scheduled for Tuesday (04:30 GMT), and at 09:30 GMT, the speech of the head of the RBA, Philip Lowe, will begin. A sharp increase in volatility is expected in the AUD / USD.
The different directions of the monetary policies of the RBA and the Fed is a strong fundamental factor for reducing AUD / USD.
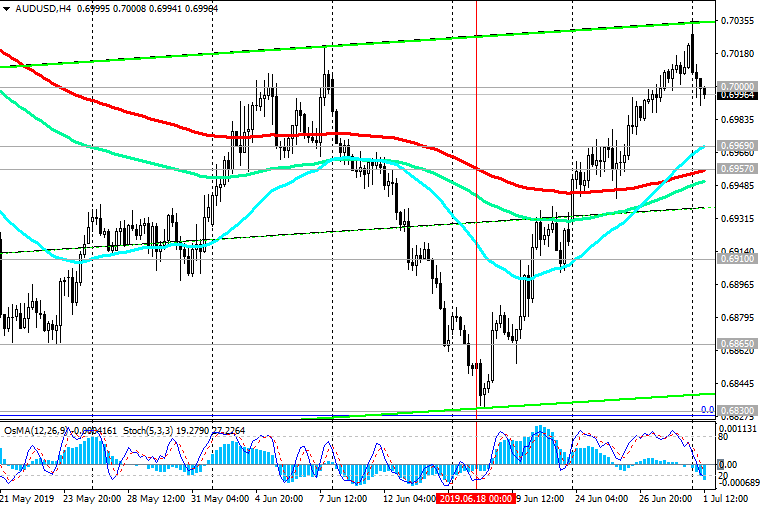
The medium-term goal of the decline is located at around 0.6770 (2019 lows). Below the key resistance levels of 0.7060 (EMA144 on the daily chart), 0.7110 (EMA200 on the daily chart) short positions remain preferable.
Support Levels: 0.6969, 0.6957, 0.6910, 0.6865, 0.6830, 0.6800, 0.6770
Resistance Levels: 0.7000, 0.7060, 0.7110

Trading Recommendations

Sell in the market. Stop Loss 0.7040. Take-Profit 0.6969, 0.6957, 0.6910, 0.6865, 0.6830, 0.6800, 0.6770
Buy Stop 0.7040. Stop Loss 0.6990. Take-Profit 0.7060, 0.7110
010719-DXY.png

010719-AU-D.png

010719-AU-H4.png

*) For up-to-date and detailed analytics and news on the forex market visit Tifia Forex Broker website tifia.com
 

Live Forex Chart

Currency
Rates
EUR / USD
1.13910
USD / JPY
157.285
GBP / USD
1.32525
USD / CHF
0.82827
USD / CAD
1.41455
EUR / JPY
179.163
AUD / USD
0.70328
Back
Top
Log in Register