BTC USD 83,909.4 Gold USD 4,285.46
Time now: Jun 1, 12:00 AM

Tifia Daily Market Analytics

AUD/USD: RBA may announce another 2 rate cuts
03/06/2019
Current dynamics

The Australian dollar and the AUD / USD pair are rising on Monday, despite the fact that on Tuesday a meeting of the RB of Australia will be held, at which the bank is expected to reduce the interest rate by 0.25% to 1.25%.
Moreover, many economists believe that the RBA may announce 2 more rate cuts this year, given the uncertain situation in the global economy and its potential impact on Australian GDP growth.
However, investors are selling the US dollar, which gives a positive impetus to dollar pairs.
Anxiety does not leave investors, and world stock indices continue to decline after last week, US President Donald Trump threatened Mexico with the introduction of import duties on its products, unless the authorities of this country take measures to prevent illegal immigration to the US.
“Mexico sent a large delegation for border talks. The problem is that they "say" 25 years. We need action, not talk. If they wanted to, they would solve the problem of the border in one day”, Trump tweeted on Sunday.
The RBA meeting will end with the publication of the interest rate decision on Tuesday (04:30 GMT).
As previously stated by the Governor of the Reserve Bank of Australia, Philip Lowe, "new incentives could help accelerate economic growth". Recent labor market data was weak, and “to accelerate inflation, an unemployment rate below 5% is needed”, Lowe added.
The perspective of reducing the RBA rate by 0.5% or more percent creates pressure on the Australian currency.
As soon as investors again pay attention to the American dollar, the AUD / USD pair will turn back "to the south". The US dollar looks preferable to other currencies due to the greater stability of the American economy.
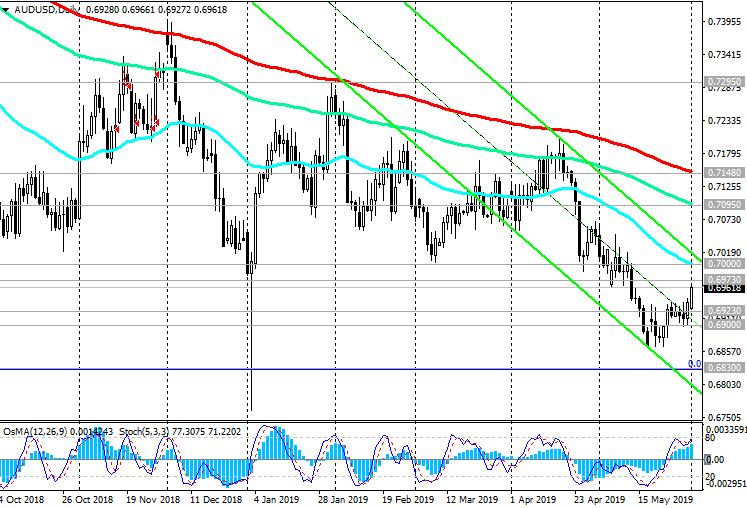
Despite the current correctional growth, AUD / USD remains in a long-term bearish trend.
Below the key resistance levels of 0.7095 (EMA144 on the daily chart), 0.7148 (EMA200 on the daily chart) short positions remain preferable.
When the price reaches the resistance level of 0.7000 (ЕМА50 and the upper line of the downward channel on the daily chart), it is recommended to resume or increase sales with stops 20-30 points higher than this mark.
The immediate goal of the decline is located at 0.6830 (2016 lows).
Support Levels: 0.6923, 0.6900, 0.6830, 0.6800
Resistance Levels: 0.6973, 0.7000, 0.7095, 0.7148

Trading Scenarios

Sell ​​in the market. Stop Loss 0.7020. Take-Profit 0.6923, 0.6900, 0.6830, 0.6800
Buy Stop 0.7020. Stop Loss 0.6960. Take-Profit 0.7095, 0.7148
030619-AU-D.png

*) For up-to-date and detailed analytics and news on the forex market visit Tifia Forex Broker website tifia.com
 
EUR/USD: Current Dynamics
04/06/2019

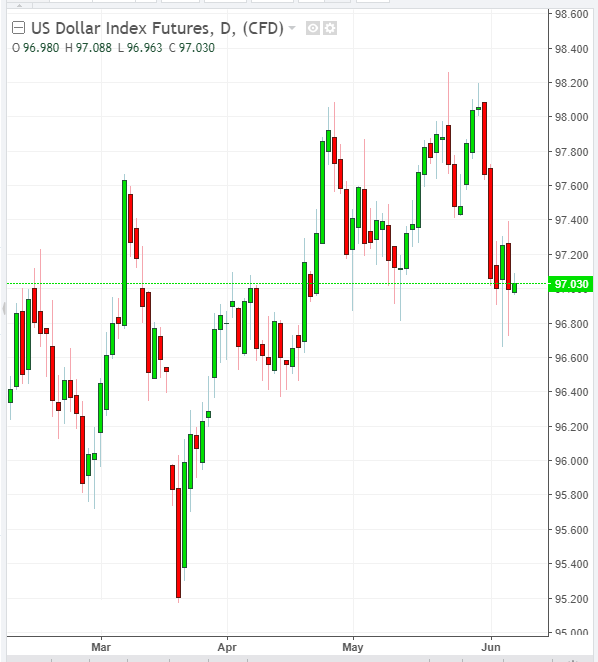
The US dollar continues to decline on Tuesday, under pressure from the heightened expectations of lower Fed interest rates. President of the Federal Reserve Bank of St. Louis and a member of the Federal Open Market Operations Committee James Bullard said Monday that "a reduction in rates may be appropriate soon" to support the economy and accelerate inflation. According to him, "the slowdown may be more dramatic than expected, due to the continuing uncertainty in the conditions of world trade".
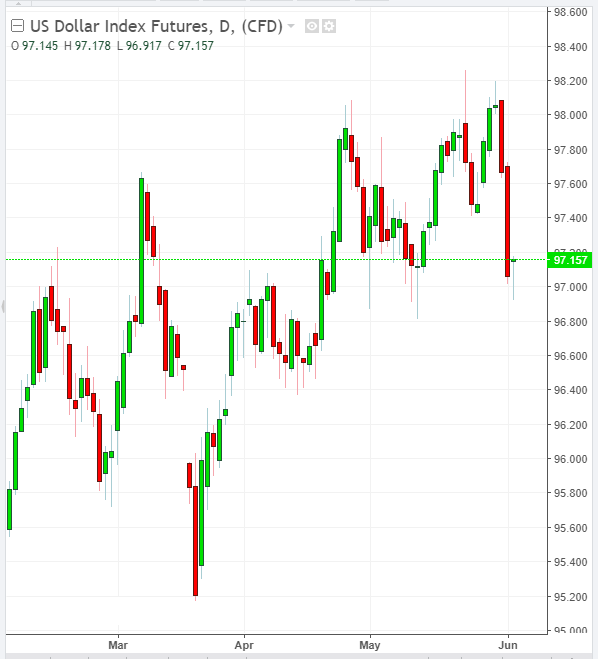
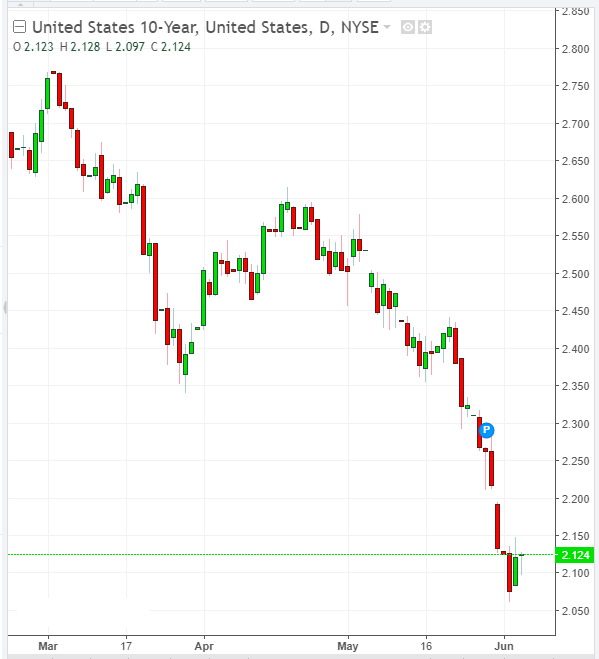
On Tuesday, DXY futures dropped to 97.00. Investors are moving away from the risks that have intensified due to the aggravation of the US-China and USA-Mexico trade confrontation, preferring gold, yen, and government bonds. Thus, the yield on 10-year US government bonds fell on Monday to 2.075%, to the marks of September 2017.
At the same time, investors assess the risks and prospects for the direction of further movement of both the dollar and the euro, on the eve of the ECB meeting on Thursday.
The uncertainty associated with Brexit, the situation in Italy, makes investors cautious about the likelihood of further strengthening of the euro.
If the rhetoric of the statements of the management of the ECB is soft in relation to its monetary policy, the euro may decline, including in relation to the dollar.
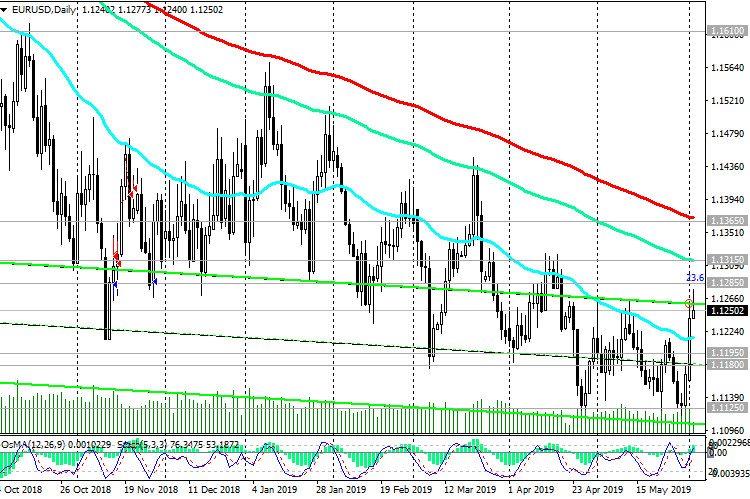
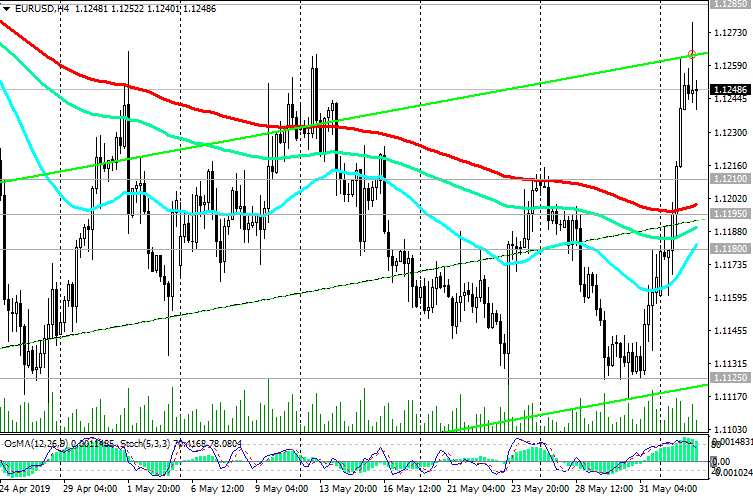
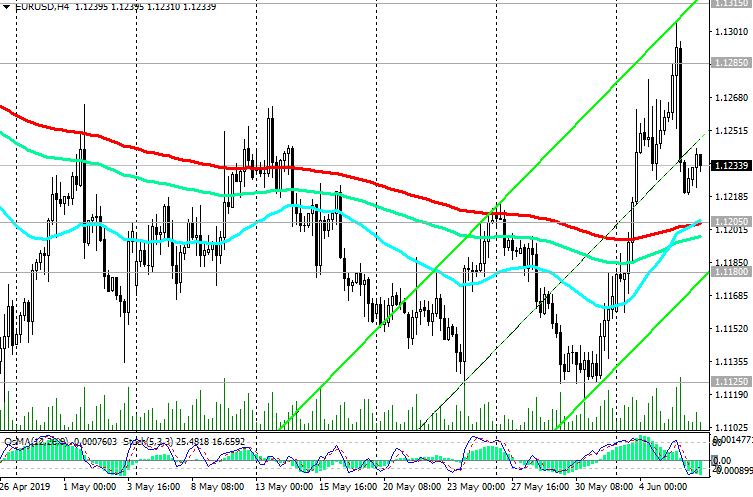
At the beginning of the European session on Tuesday, EUR / USD is trading near the 1.1250 mark, 10 points higher than the opening price of the trading day. The current growth of the Eurodollar is associated more with the weakening of the dollar and the correction, rather than with the strengthening of the euro.
EUR / USD is in a steady bearish trend.
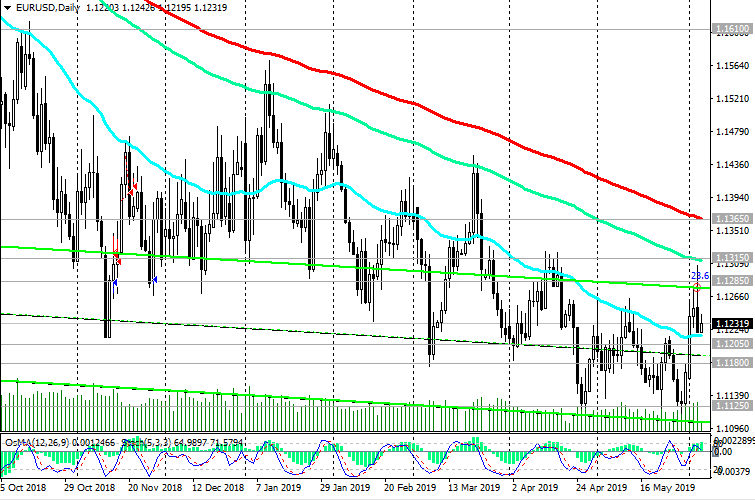
Below the resistance levels of 1.1285 (Fibonacci level 23.6% of the correction to the fall from the level of 1.3900, which began in May 2014), 1.1315 (EMA144), 1.1365 (EMA200 on the daily chart), long-term negative dynamics prevail.
The signal for the resumption of short positions will be the return of EUR / USD to the zone below the support level of 1.1210 (ЕМА50 on the daily chart) with the likelihood of further falling of EUR / USD with targets located at support levels of 1.1125, 1.1100, 1.1000.
Support Levels: 1.1210, 1.1195, 1.1180, 1.1125, 1.1100, 1.1000
Resistance Levels: 1.1285, 1.1315, 1.1365

Trading Recommendations

Sell Stop 1.1235. Stop Loss 1.1290. Take-Profit 1.1210, 1.1195, 1.1180, 1.1125, 1.1100, 1.1000
Buy Stop 1.1290. Stop Loss 1.1235. Take-Profit 1.1315, 1.1365
040619-DXY.png

040619-EU-D.png

040619-EU-H4.png

*) For up-to-date and detailed analytics and news on the forex market visit Tifia Forex Broker website tifia.com
 
XAU/USD: Current Dynamics
05/06/2019

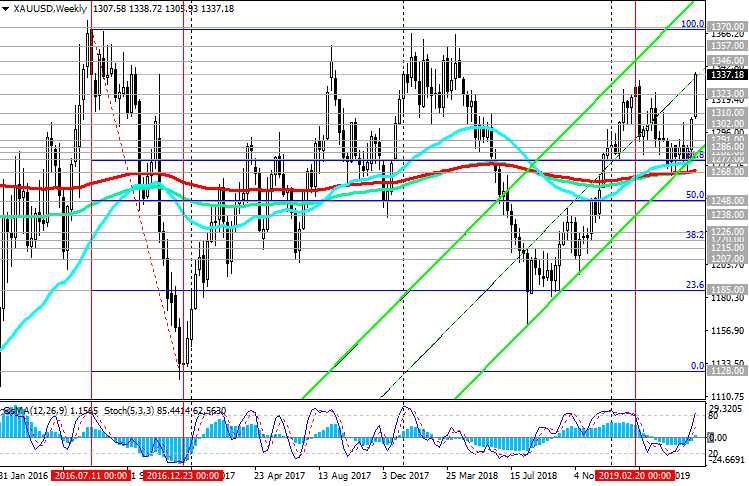
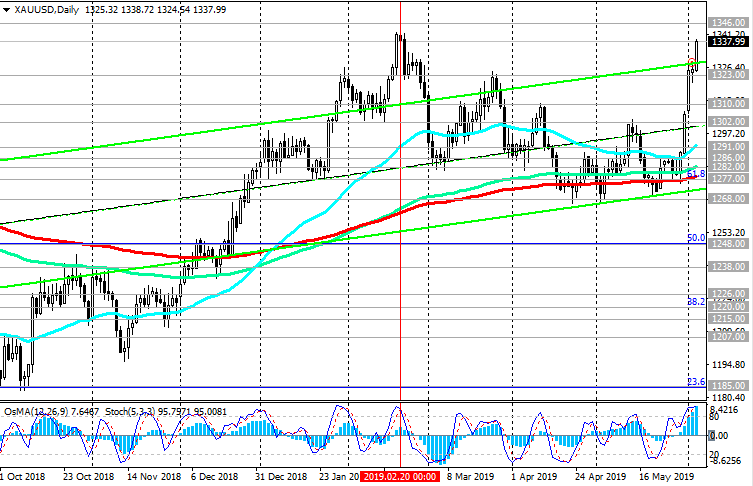
On Wednesday, gold rises in price for the 5th day in a row. The XAU / USD pair is trading at the beginning of the European session near the mark of 1336.00, 130 points above the support level of 1323.00 (January and March highs), but 80 points ($ 8) below the local resistance level of 1346.00 (multi-monthly and annual highs).
While XAU / USD is above the key support level of 1277.00 (Fibonacci level of 61.8% of the correction to the wave of decline since July 2016 and ЕМА200 on the daily chart), the bullish trend remains.
There is a strong positive impulse that supports XAU / USD and it emerged after a sharp weakening of the dollar, aggravating trade contradictions between the US and China, and Mexico, as well as after yesterday’s speech by Fed Chairman Jerome Powell. He said that the Fed, if necessary, will take "appropriate measures to support growth" of the economy.
Usually, when the Fed raises the interest rate, the price of gold decreases as the cost of its acquisition and storage increases. With the easing of the monetary policy of the Fed and the growing uncertainty in the financial markets, the demand for gold and its price increase.
An alternative scenario implies a resumption of dollar growth and a decline in XAU / USD to a key support level of 1277.00.
The signal for the development of this scenario will be the breakdown of the short-term support level of 1323.00 (ЕМА200 on the 15-minute chart and the highs of January, March). Farther targets for the decline are at support levels of 1197.00 (November lows), 1185.00 (Fibonacci level 23.6%), 1160.00 (2018 lows).
Support Levels: 1323.00, 1310.00, 1302.00, 1291.00, 1282.00, 1277.00, 1268.00, 1248.00
Resistance Levels: 1346.00, 1357.00, 1365.00, 1370.00

Trading Scenarios

Sell Stop 1322.00. Stop-Loss 1340.00. Take-Profit 1310.00, 1302.00, 1291.00, 1282.00, 1277.00, 1268.00, 1248.00
Buy Stop 1340.00. Stop Loss 1322.00. Take-Profit 1346.00, 1357.00, 1365.00, 1370.00
050619-10-Y.png

050619-XU-W.png

050619-XU-D.png

*) For up-to-date and detailed analytics and news on the forex market visit Tifia Forex Broker website tifia.com
 
EUR/USD: Current Dynamics
06/06/2019

As expected by many market participants, the European Central Bank on Thursday left interest rates unchanged. In a statement following the meeting on Thursday, the ECB confirmed its intention to leave the key rate at the current level of -0.40% at least until the end of the year and continue to reinvest the income from bonds into the debt portfolio.
The euro reacted quite restrained to this news, while the EUR / USD pair rose only by 38 points, to the level of 1.1272.
Now market participants will closely follow the speech of the ECB President Mario Draghi at the press conference, which will begin at 12:30 (GMT). Draghi will present new forecasts by ECB economists, which may reflect lower expectations for economic growth next year. He will also present the conditions of a new long-term lending program for banks.
With the escalation of risks to the global economy, the uncertainties associated with Brexit and the situation in Italy and after the recent elections to the European Parliament, Mario Draghi can still allow the ECB’s softer monetary policy to be possible in its speech.
If he gives a signal in this direction, the euro may sharply decline, despite its restrained reaction after the ECB published its decision on interest rates.
Also at this time (12:30 GMT) data on the balance of foreign trade, non-agricultural labor productivity and applications for unemployment benefits in the United States will be published. Positive statistics from the US can give a positive impetus to the dollar and negatively affect the dynamics of EUR / USD. And, conversely, weak macro data from the United States will put pressure on the dollar.
Meanwhile, after the publication of the ECB decision, the DXY dollar index dropped another 18 points to 97.00, while the EUR / USD pair is trading near the 1.1262 mark.
Below the resistance levels of 1.1285 (Fibonacci level 23.6% of the correction to the fall from the level of 1.3900, which began in May 2014), 1.1315 (EMA144), 1.1365 (EMA200 on the daily chart), long-term negative dynamics prevail.
After the breakdown of the local support level of 1.1200, a further weakening of EUR / USD with targets located at the support levels of 1.1125, 1.1100, 1.1000 is likely.
Support Levels: 1.1200, 1.1180, 1.1125, 1.1100, 1.1000
Resistance Levels: 1.1285, 1.1315, 1.1365

Trading recommendations

Sell Stop 1.1190. Stop Loss 1.1280. Take-Profit 1.1180, 1.1125, 1.1100, 1.1000
Buy Stop 1.1280. Stop-Loss 1.1190. Take-Profit 1.1315, 1.1365
060619-DXY.png

060619-EU-D.png

060619-EU-H4.png

*) For up-to-date and detailed analytics and news on the forex market visit Tifia Forex Broker website tifia.com
 
EUR/USD: Current Dynamics
06/07/2019

Last Thursday, the ECB, as is well known, kept its monetary policy unchanged, leaving key interest rates unchanged.
During the press conference, ECB President Mario Draghi said that the ECB is “ready to act and use all the tools at its disposal”, hinting that the bank is ready to lower rates or take other measures if necessary.
Nevertheless, the EUR / USD pair rose, and the euro peaked from April 17 after the ECB meeting.
Many economists believe that if the Fed starts to soften the policy, the ECB will probably do the same. Probably already in July, the ECB will announce a rate cut, if the Fed also softens the policy.
On Friday, the euro and the EUR / USD pair are falling, and the dollar strengthens on the eve of the publication (at 12:30 GMT) of data from the US labor market. According to the forecast, in May, 180,000 new jobs were created in the American economy, while unemployment remained at 3.6%. If the data turns out to be weaker than the predicted values, then the dollar may briefly, but drop sharply.
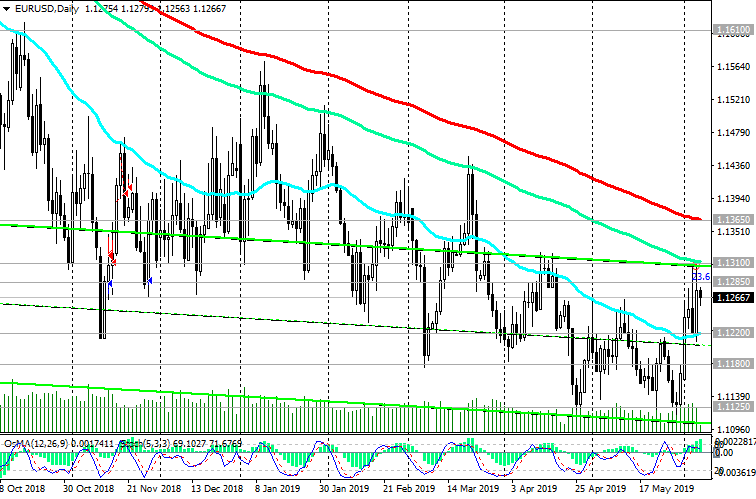
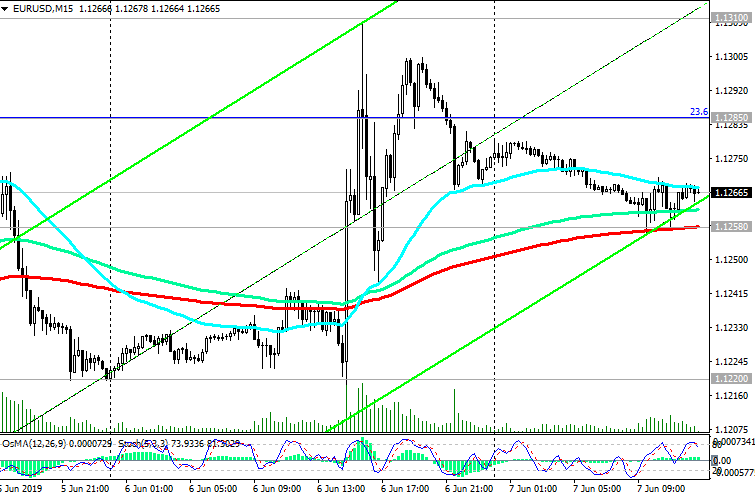
During this period, a surge in volatility is expected. In the event of a breakdown of the short-term support level of 1.1220 (EMA200 on the 1-hour chart), EUR / USD will return to a bearish trend. The first signal for this will be the breakdown of the short-term support level of 1.1258 (ЕМА200 on the 15-minute chart, ЕМА50 on the 1-hour chart) with targets located at the support levels of 1.1125, 1.1100, 1.1000.
Below the key resistance levels of 1.1285 (Fibonacci level 23.6% of the correction to the fall from the level of 1.3900, which began in May 2014), 1.1310 (EMA144), 1.1365 (EMA200 on the daily chart) the bearish EUR / USD trend prevails.

Support Levels: 1.1258, 1.1220, 1.1180, 1.1125, 1.1100, 1.1000
Resistance Levels: 1.1285, 1.1310, 1.1365

Trading Recommendations

Sell Stop 1.1250. Stop Loss 1.1290. Take-Profit 1.1220, 1.1180, 1.1125, 1.1100, 1.1000
Buy Stop 1.1290. Stop Loss 1.1250. Take-Profit 1.1310, 1.1365
070619-DXY.png

070619-EU-D.png

070619-EU-M15.png

*) For up-to-date and detailed analytics and news on the forex market visit Tifia Forex Broker website tifia.com
 
S&P500: Current Dynamics
10/06/2019

US stocks indices rose from the opening of today after last Friday they ended the week as one of the best weeks in the last 6 months. DJIA added 4.7%, S&P500 - 4.4%, and Nasdaq - 3.9%.
The heightened expectations of the Fed's policy easing led to an increase in US stock indices, which continued to recover from a sharp drop last month amid growing risks of escalating international trade wars.
Fed Chairman Jerome Powell said last Tuesday that the Fed "will act according to the need to maintain growth". The worsening economic outlook strengthens the pressure on the Fed leadership towards easing monetary policy, which leads to an increase in US stock indices.
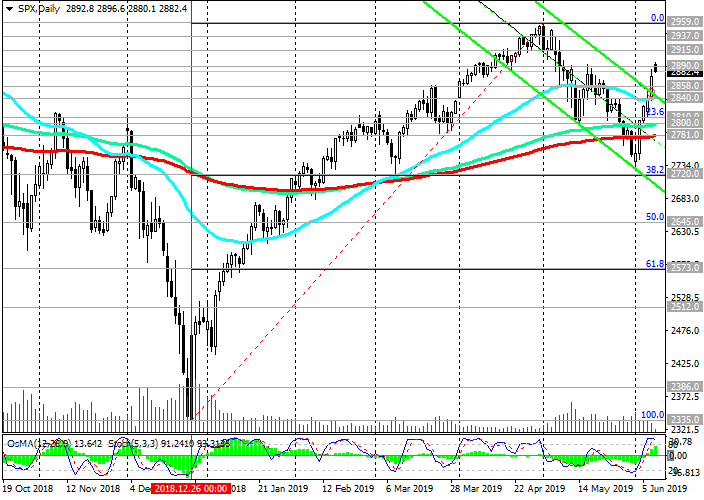
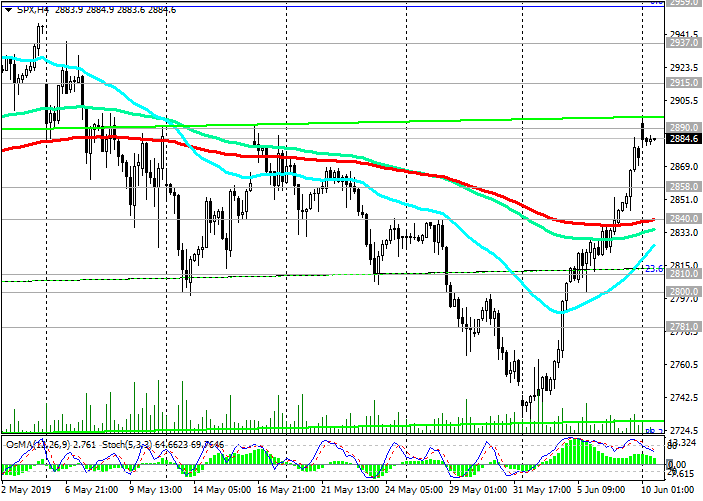
At the beginning of the European session, S&P500 futures traded near the 2884.0 mark, above the important short-term support level of 2840.0 (ЕМА50 on the daily chart, ЕМА200 on the 4-hour chart).
Above key support levels of 2810.0 (Fibonacci level 23.6% of the correction to the growth since December 2018 and the level of 2335.0), 2800.0 (EMA144), 2781.0 (EMA200 on the daily chart), the bullish trend prevails.
The signal for the resumption of sales will be the return of the S&P500 to the zone below the support level of 2840.0. After the breakdown of the key support level of 2781.0, the targets for further reduction of the S&P500 will be the support levels of 2720.0 (Fibonacci 38.2%), 2645.0 (Fibonacci 50%), 2510.0 (ЕМА200 on the weekly chart).
Support Levels: 2858.0, 2840.0, 2810.0, 2800.0, 2781.0, 2720.0, 2645.0, 2573.0, 2507.0
Resistance Levels: 2915.0, 2937.0, 2959.0

Trading recommendations

Sell Stop 2856.0. Stop Loss 2910.0. Objectives 2840.0, 2810.0, 2800.0, 2781.0, 2720.0, 2645.0, 2573.0, 2507.0
Buy Stop 2910.0. Stop Loss 2856.0. Objectives 2915.0, 2937.0, 2959.0
100619-s500-D.png

100619-s500-H4.png

*) For up-to-date and detailed analytics and news on the forex market visit Tifia Forex Broker website tifia.com
 
AUD/USD: Current Dynamics
11/06/2019

Last week, the Reserve Bank of Australia lowered its key interest rate by 0.25% to 1.25%. This is the first rate reduction since 2016.
Governor of the Reserve Bank of Australia, Philip Lowe, said that the key rate will be reduced to 1% by the end of this year. "The likelihood of lowering interest rates is still not excluded", said Lowe, hinting at the possibility of a further reduction in interest rates. This is a strong negative fundamental factor for the Australian dollar, which continues to decline in the foreign exchange market.
RBA leaders called increased uncertainty in world trade a risk to the Australian economy. By lowering the interest rate, the RBA is trying to accelerate GDP growth, reduce unemployment to 5%, and accelerate inflation.
Meanwhile, the situation in global financial markets is gradually calming down after last Friday Donald Trump tweeted that the imposition of duties on goods from Mexico has been canceled, so far.
Investors are gradually emerging from defensive assets, acquiring more profitable, but also more risky assets of the stock market. The demand for the dollar is also growing, despite expectations that the Fed will cut interest rates.
At the beginning of the European session, the DXY dollar index futures traded near the 96.72 mark, 14 points higher than the opening price of the current week, and the AUD / USD pair - near the 0.6955 mark.
Now investors will follow the publication on Thursday (01:30 GMT) data from the Australian labor market. If they turn out to be worse than the forecast or weaker than the previous values, then AUD will accelerate the decline. A positive report on the labor market will support AUD.
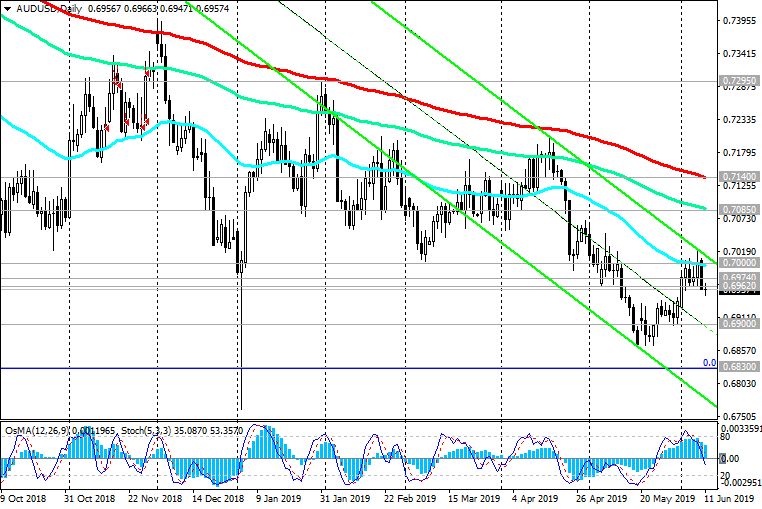
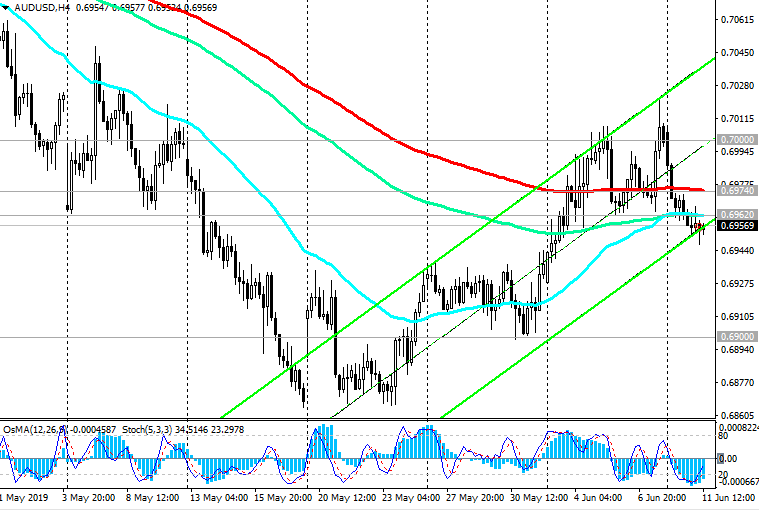
AUD / USD remains in a long-term bearish trend.
Below the key resistance levels of 0.7085 (EMA144 on the daily chart), 0.7140 (EMA200 on the daily chart) negative dynamics prevail.
Breakdown of short-term support levels of 0.6974 (ЕМА200 on 4-hour chart), 0.6962 (ЕМА200 on 1-hour chart) speaks in favor of further reducing AUD / USD with reduction targets located at support levels of 0.6900, 0.6830 (2016 lows), 0.6770.
Support Levels: 0.6900, 0.6830, 0.6800, 0.6770
Resistance Levels: 0.6962, 0.6974, 0.7000, 0.7085, 0.7140

Trading Scenarios

Sell in the market. Stop Loss 0.7025. Take-Profit 0.6900, 0.6830, 0.6800, 0.6770
Buy Stop 0.7025. Stop Loss 0.6940. Take-Profit 0.7085, 0.7140
110619-AU-D.png

110619-AU-H4.png

*) For up-to-date and detailed analytics and news on the forex market visit Tifia Forex Broker website tifia.com
 
EUR/USD: Current Dynamics
13/06/2019

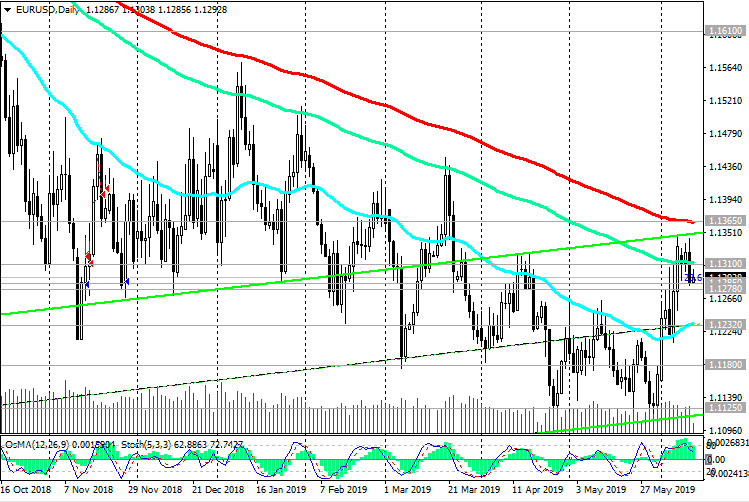
EUR / USD failed to develop an upward correction above the resistance level of 1.1310 (ЕМА144 on the daily chart).
On Wednesday, EUR / USD resumed its decline after the publication at the beginning of the American session of positive macro statistics from the United States, indicating a modest, but still rising inflation in the United States.
As the US Department of Labor reported on Wednesday, consumer prices in May increased compared to April, but less significantly than expected (in annual terms, +1.8% against the forecast of +1.9% and +2.0% in April). The base consumer price index, which does not take into account food and energy, rose by 2% compared with May 2018, compared with the expected growth of 2.1%.
Next week, the Fed decides on rates. Published statistics are unlikely to give the Fed a reason to lower rates, although it may signal a decrease in rates in the second half of this year.
Meanwhile, EUR / USD has remained in the global downtrend since May 2014.
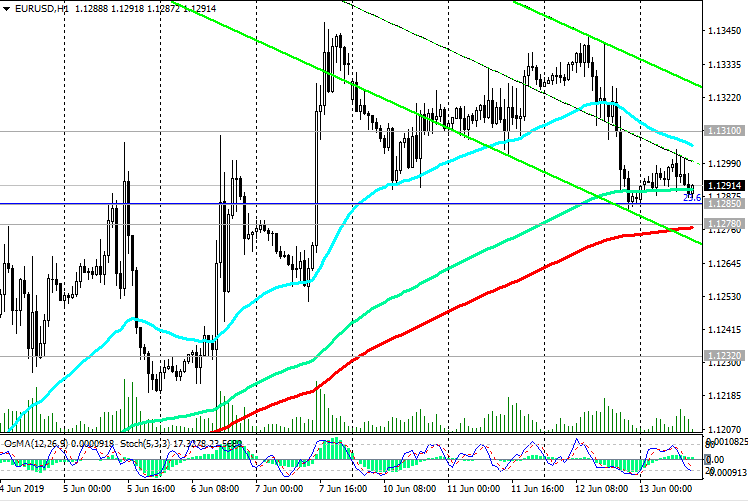
At the beginning of the European session on Thursday, EUR / USD is trading near support levels of 1.1285 (Fibonacci level 23.6% of the correction to the fall from 1.3900, which began in May 2014), 1.1278 (ЕМА200 on the 1-hour chart).
Breakdown of these support levels will accelerate the EUR / USD decline towards annual lows near the support level of 1.1125.
Negative dynamics prevails; short positions are preferred.
Support Levels: 1.1285, 1.1278, 1.1232, 1.1180, 1.1125, 1.1100, 1.1000
Resistance Levels: 1.1310, 1.1365

Trading recommendations

Sell Stop 1.1270. Stop-Loss 1.1320. Take-Profit 1.1232, 1.1180, 1.1125, 1.1100, 1.1000
Buy Stop 1.1320. Stop Loss 1.1270. Take-Profit 1.1365
130619-EU-D.png

130619-EU-H1.png

*) For up-to-date and detailed analytics and news on the forex market visit Tifia Forex Broker website tifia.com
 
WTI: Current Dynamics
14/06/2019

Despite the rise on Thursday, during the Asian session on Friday, oil prices again resumed their decline. Investors are concerned about weakening demand and increasing oversupply in the United States. Last Tuesday, in the monthly report, the Energy Information Administration (EIA) lowered its forecast for oil demand growth to 1.2 million barrels per day, or 15% from the previous month, due to concerns about a slowdown in global economic growth.
The trade conflict between the US and China, the threat to the growth of the world economy and oil demand, as well as the growth of US oil reserves (oil reserves in the country rose to 485 million barrels, the maximum since July 2017) contribute to the increase in the negative trend in the oil market.
Participants in the oil market also believe that the situation with the attack on tankers could be another geopolitical fear.
If a deal to reduce oil production by OPEC + (OPEC meeting is scheduled for the end of June) is not extended, the fall in oil prices may accelerate.
On Friday at 17:00 (GMT), the American oilfield services company Baker Hughes will present a weekly report on the number of active drilling rigs in the United States. At the moment, their number is 789 units.
If the report indicates an increase in the number of such installations, this may give an additional negative impetus to prices.
*)An advanced fundamental analysis is available on the Tifia Forex Broker website at tifia.com/analytics
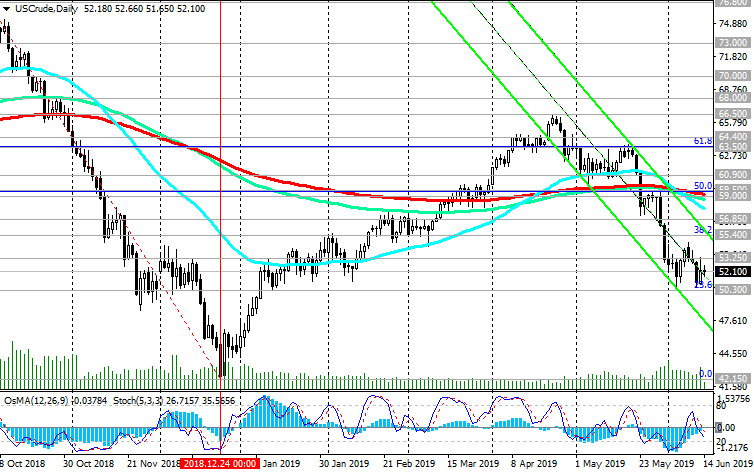
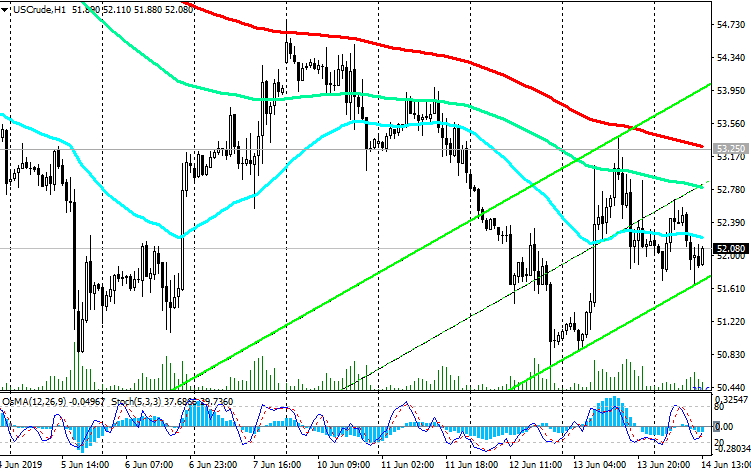
At the beginning of the European session, WTI crude oil is quoted at $52.00 per barrel, below the important resistance levels of 59.50 (50% Fibonacci level), 59.00 (EMA200 on the daily chart), 56.85 (EMA200 on the weekly chart), 55.40 (Fibonacci level 38.2% of the upward correction to a fall from the highs of the last few years near the 76.80 mark to the level of support near the 42.15 mark).
Mostly negative dynamics. Long-term targets are located near the 42.15 mark (lows of December 2018). Relevant short positions.
Support Levels: 50.30, 49.00, 42.15
Resistance Levels: 53.25, 55.40, 56.85, 59.00, 59.50

Trading Recommendations

Sell in the market. Stop Loss 53.50. Take-Profit 50.30, 49.00, 43.00
Buy Stop 53.50. Stop Loss 51.50. Take-Profit 55.40, 56.85, 59.00, 59.50
140619-WTI-D.png

140619-WTI-H1.png

*) For up-to-date and detailed analytics and news on the forex market visit Tifia Forex Broker website tifia.com
 
GBP/USD: Current Dynamics
17/06/2019

Negative momentum continues to dominate the pound. Domestic political risks are added to weak macro statistics after Theresa May’s resignation from the post of prime minister and against the background of increasing likelihood of a hard Brexit. On Tuesday, the second round of voting for the candidacy of the new head of the Conservatives will take place. A favorite among 6 candidates is Boris Johnson.
The pound will also be pressured by the risk of early elections in the UK, which may take place in December.
And this week, investors will follow the meeting of the Bank of England. On Thursday (11:00 GMT) the decision of the Bank of England on the rate will be published. Probably, the rate will remain unchanged, at the level of 0.75%. However, volatility may rise sharply in the foreign exchange market if unexpected statements are made by the management of the Bank of England. Signals in favor of tightening monetary policy, which, however, is unlikely in the current situation, will cause a sharp short-term strengthening of the pound.
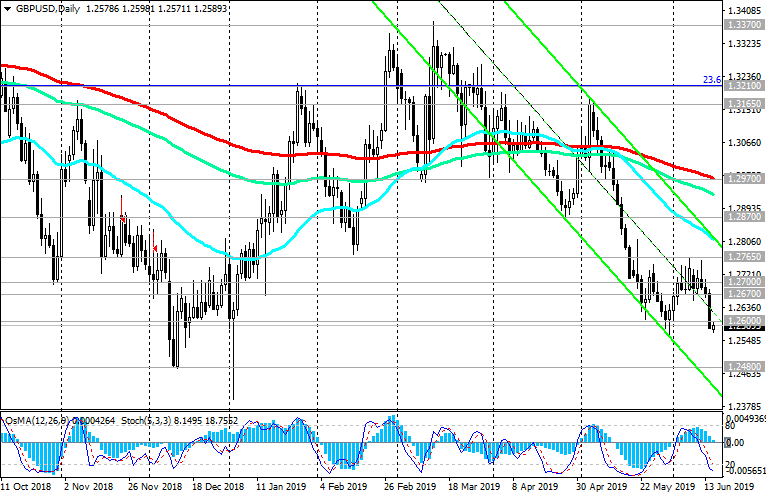
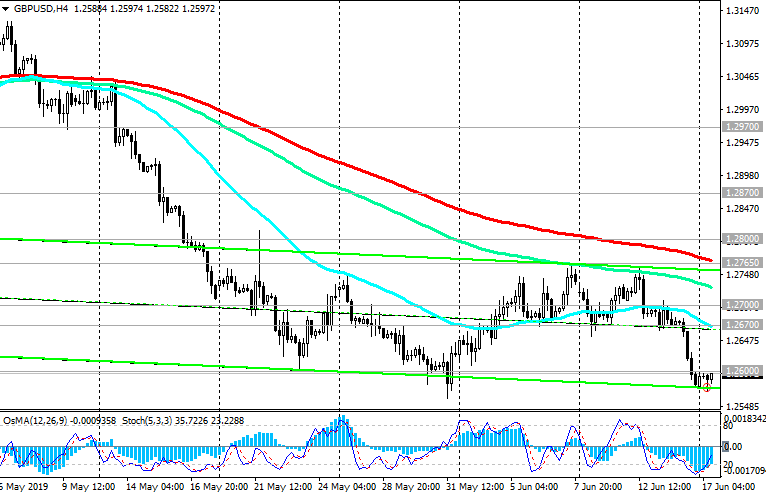
However, below the key resistance levels of 1.2970 (ЕМА200 on the daily chart), 1.3210 (Fibonacci level 23.6% of the correction to the decline of the GBP / USD pair in the wave that started in July 2014 near the level of 1.7200) long-term negative dynamics prevail.
Still, short positions are preferred.
Support Levels: 1.2480
Resistance Levels: 1.2600, 1.2670, 1.2700, 1.2765, 1.2800

Trading Recommendations

Sell in the market. Stop Loss 1.2620. Take-Profit 1.2480
Buy Stop 1.2620. Stop Loss 1.25800. Take-Profit 1.2670, 1.2700, 1.2765, 1.2800
170619-GU-D.png

170619-GU-H4.png

*) For up-to-date and detailed analytics and news on the forex market visit Tifia Forex Broker website tifia.com
 

Live Forex Chart

Currency
Rates
EUR / USD
1.13910
USD / JPY
157.285
GBP / USD
1.32525
USD / CHF
0.82827
USD / CAD
1.41455
EUR / JPY
179.163
AUD / USD
0.70328
Back
Top
Log in Register