BTC USD 83,580.3 Gold USD 4,253.26
Time now: Jun 1, 12:00 AM

Relative Strength Index (RSI)

Kita sambung perbincangan tentang RSI satu per satu point:


Ways to use Relative Strength Index for chart analysis:

Tops and bottoms


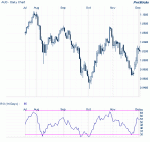
The Relative Strength Index usually tops above 70 and bottoms below 30. It usually forms these tops and bottoms before the underlying price chart;


Cara nak masukkan indi RSI

rsi14_19.gif


Cara nak fahamkan top dan bottom RSI ialah:

1) top = atas 70 ialah overbought (sedia untuk SELL)

2) bottom = bawah 30 bermaksud oversold (sedia untuk BUY)


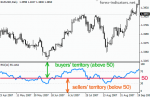
rsi14_20.gif


kemudian masukkan level 50 untuk kita kenal pasti permulaan trend:

1) uptrend = RSI atas 50

2) downtrend = RSI bawah 50

3) no trend atau neutral = RSI bermain-main di atas level 50

Saya cadangkan untuk lebih kepastian, biarkan RSI betul-betul melepasi level 50 sebelum nak Open Position


rasanya itu penjelasan tentang point pertama Tops and bottoms.

atau ada sapa nak tambah info silakan? :)

sapa nak tanya berkenaan point 1 ni pun silakan :)

kita sambung nanti untuk penjelsan point seterusnya

:)cgrock
 
Principles

Wilder posited that when price moves up very rapidly, at some point it is considered overbought. Likewise, when price falls very rapidly, at some point it is considered oversold. In either case, Wilder deemed a reaction or reversal imminent.

The level of the RSI is a measure of the stock's recent trading strength. The slope of the RSI is directly proportional to the velocity of a change in the trend. The distance traveled by the RSI is proportional to the magnitude of the move.

Wilder believed that tops and bottoms are indicated when RSI goes above 70 or drops below 30. Traditionally, RSI readings greater than the 70 level are considered to be in overbought territory, and RSI readings lower than the 30 level are considered to be in oversold territory. In between the 30 and 70 level is considered neutral, with the 50 level a sign of no trend.
 

Attachments

lagi penjelasan berkaitan level di dalam RSI

RSI moving above 50 level — uptrend is confirmed, below 50 — downtrend is confirmed.

RSI peaking above 70 level — market is overbought.

RSI staying above 70 level — uptrend is running strong.

RSI exiting 70 level — downtrend is underway, or at least a correction down is due. (Opposite for RSI falling below 30.)

RSI trend line breakout - early warning about chart trend line breakout.

RSI diverging from price on the chart — an early warning of a possible trend change.


Attachments

Kita sambung perbincangan untuk point No. 2

2) Chart Formations

The RSI often forms chart patterns such as head and shoulders or triangles that may or

may not be visible on the price chart;

Antara chart formations yang boleh jumpa pada RSI ialah:

- trendline

doubletopandbottom.jpg


- flags and pennants

flagspenants.gif


- head and shoulders

head-and-shoulders.jpg


- triangles

triangle.jpg

 
seterusnya untuk point No.3

Failure swing ( Support or Resistance penetrations or breakouts)

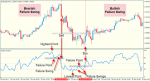
This is where the Relative Strength Index surpasses a previous high (peak) or falls below a recent low (trough);

The best way to learn about any indicators is to read original works of their creators.

Therefore, let's turn to the book where J. Welles Wilder tells about his research on RSI indicator:

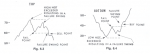
"(3) Failure Swings: Failure swings above 70 or below 30 are very strong indications of a market reversal. (See Fig. 6.3 and Fig. 6.4)"
 

Attachments

terbaik nie bro ahib..nak belajolah..huhu

saya pon ada pakai mcm bro jgk untuk entry.. :)cgrock
 
Saya berminat dkt tf15 dan TF1H, setting sesuai utk RSI utk tf tu agak2 apa ya masta?
 

Latest Posts

Live Forex Chart

Currency
Rates
EUR / USD
1.13736
USD / JPY
158.896
GBP / USD
1.32191
USD / CHF
0.82889
USD / CAD
1.41377
EUR / JPY
180.722
AUD / USD
0.70213
Back
Top
Log in Register