BTC USD 81,236.1 Gold USD 4,378.12
Time now: Jun 1, 12:00 AM

Mencari indikator daily range

budak_baru

Active Member
Messages
2,438
Joined
May 29, 2011
Messages
2,438
Reaction score
156
Points
33
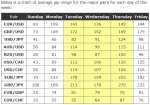
Salam semua.Ada x dr rakan2 trader yg ada indi yg menunjukkan purata pergerakan market utk setiap hari?Sbg cth purata pergerakan market utk 10 hari isnin yg lepas.Begitu juga selasa,rabu,kamis dan jumaat.Tujuan sy mencari indi ni adalah utk mengetahui purata pergerakan market setiap hari sbgi exit plan trading saya.Di bwh sy sertakan purata pergerakan market bagi setiap hari utk tahun 2010.

Kalo ada sesiapa yg bole coding indi ni bole share disini.tkasih
 

Attachments

  • 25 KB Views: 92
//+------------------------------------------------------------------+
//| (T_S_R)-Daily Range Calculator v1.3.mq4 |
//| Copyright © 2006, Ogeima |
//| [email protected]
//|Made for the TSR (Trend Slope Retracement) system by FXiGoR |
//|http://strategybuilderfx.com/showthread.php?t=17252 |
//+------------------------------------------------------------------+
// For basic explanations, see the notes at the end this script.
// For information regarding the T_S_R method, read the "FXiGoR-(T_S_R) very effective Trend Slope Retracement system" thread opened by iGoR at StrategyBuilderfx, Forex-tsd, MoneyTec, ForexFactory or Trade2Win.
#property copyright "Copyright © 2006, Ogeima"
#property link "[email protected]"

#property indicator_chart_window
#property indicator_buffers 2
#property indicator_color1 Green
#property indicator_color2 Red

//---- input parameters
extern double Risk_to_Reward_ratio = 3.0;

double aSL_Long[];
double aSL_Short[];
int nDigits;

//+------------------------------------------------------------------+
//| Custom indicator initialization function |
//+------------------------------------------------------------------+
int init()
{
IndicatorBuffers(2);
SetIndexStyle(0,DRAW_LINE,STYLE_SOLID,3);
SetIndexStyle(1,DRAW_LINE,STYLE_SOLID,3);

SetIndexBuffer(0,aSL_Long);
SetIndexBuffer(1,aSL_Short);

SetIndexEmptyValue(0,EMPTY_VALUE);
SetIndexEmptyValue(1,EMPTY_VALUE);

if(Symbol()=="GBPJPY" || Symbol()=="EURJPY" || Symbol()=="USDJPY" || Symbol()=="CHFJPY" || Symbol()=="GOLD" || Symbol()=="_SP500") nDigits = 2;
else nDigits = 4;
return(0);
**
//+------------------------------------------------------------------+
//| Custom indicator deinitialization function |
//+------------------------------------------------------------------+
int deinit()
{
Comment("");
return(0);
**
//+------------------------------------------------------------------+
//| Custom indicator iteration function |
//+------------------------------------------------------------------+
int start()
{
int R1=0,R5=0,R10=0,R20=0,RAvg=0;
int RoomUp=0,RoomDown=0,StopLoss_Long=0,StopLoss_Short=0;
double SL_Long=0,SL_Short=0;
double low0=0,high0=0;
string Text="";
int i=0;

R1 = (iHigh(NULL,PERIOD_D1,1)-iLow(NULL,PERIOD_D1,1))/Point;
for(i=1;i<=5;i++) R5 = R5 + (iHigh(NULL,PERIOD_D1,i)-iLow(NULL,PERIOD_D1,i))/Point;
for(i=1;i<=10;i++) R10 = R10 + (iHigh(NULL,PERIOD_D1,i)-iLow(NULL,PERIOD_D1,i))/Point;
for(i=1;i<=20;i++) R20 = R20 + (iHigh(NULL,PERIOD_D1,i)-iLow(NULL,PERIOD_D1,i))/Point;

R5 = R5/5;
R10 = R10/10;
R20 = R20/20;
RAvg = (R5+R10+R20)/3;

low0 = iLow(NULL,PERIOD_D1,0);
high0 = iHigh(NULL,PERIOD_D1,0);

RoomUp = RAvg - (Bid - low0)/Point;
RoomDown = RAvg - (high0 - Bid)/Point;
StopLoss_Long = RoomUp/Risk_to_Reward_ratio;
SL_Long = Bid - StopLoss_Long*Point;
StopLoss_Short = RoomDown/Risk_to_Reward_ratio;
SL_Short = Bid + StopLoss_Short*Point;

Text = "Average Day Range: " + RAvg + "\n" +
"Prev 01 Day Range: " + R1 + "\n" +
"Prev 05 Days Range: " + R5 + "\n" +
"Prev 10 Days Range: " + R10 + "\n" +
"Prev 20 Days Range: " + R20 + "\n";
Text = Text +
"Room Up: " + RoomUp + "\n" +
"Room Down: " + RoomDown + "\n" +
"Max. StopLosses should be :" + "\n" +
"Long: " + StopLoss_Long + " Pips at " + DoubleToStr(SL_Long,nDigits) + "\n" +
"Short: " + StopLoss_Short + " Pips at " + DoubleToStr(SL_Short,nDigits) + "\n";

Comment(Text);

//-- SL Lines
int limit;
int counted_bars=IndicatorCounted();
if(counted_bars<0) counted_bars=0;
if(counted_bars>0) counted_bars--;
limit = counted_bars;

for(i = 0 ;i <= limit ;i++)
{
if(i==0 || i==1 || i==2)
{
aSL_Long = SL_Long;
aSL_Short= SL_Short;
**
else
{
aSL_Long = EMPTY_VALUE;
aSL_Short= EMPTY_VALUE;
**
**
return(0);
**
//+------------------------------------------------------------------+
/*
Here's a little "indicator" that does some basic calculations for us.

Let's look at what it does:
It computes yesterday's range, the previous 5, 10 and 20 days ranges. And it calculates the "Average Day Range" of these four ranges (yesterday's+ Prev 5 Day Range + Prev 10 Day Range + Prev 20 Day Range)/4.
So, if yesterday's Day Range was 80, the Previous 5 Day Range was 110, the Previous 10 Day Range was 90 and the Previous 20 Day Range was 120, then the Average Day Range would be 100.

Then there's "Room Up" and "Room Down".
Let's imagine today's low is (so far) 1000 and today's high is (so far) 1050. At this moment the price is 1020.
So we're 1020-1000= 20 pips above the low, there is therefore 100-20=80 pips "left" up. For a risk-to-reward ratio of (say) 3, if a long trade was to be entered now, the stop loss should be no more than 80/3=26pips away, that is at 1020-26=994. So, if all conditions are met, we ll look for a "bottom" no lower than 994.
Same thing for a short trade: we are 1050-1020= 30 pips below the high, there is therefore 100-30=70 pips "left" down. For a risk-to-reward ratio of 3, if a short trade was to be entered now, the stop loss should be no more than 70/3=23pips away, that is at 1020+23=1043. So, if all conditions are met, we ll look for a "top" no higher than 1043.

As you can see, this indicator doesn't tell us whether or not we have a set up to trade. What it does is, considering some past day ranges, and for a given Risk to Reward ratio, it tells us how far away we can put a stop loss.

Hope this helps,

Ogeima.

P.S.: I used H-L (High-Low) to compute the Ranges. They are thus a bit different from mataf.net data, which computes what is known as the "True" Ranges (= Max(High for the period less the Low for the period,High for the period less the Close for the previous period,Close for the previous period and the Low for the current period)).

--------
PS1: occasionnally, as someone apparently pointed out in the chatroom, RoomUp/RoomDown (and the indicative stop losses) will have negative values. For example, let's imagine that the Average Day Range is 100, today's High is 1150, today's low is 1000 and the current price is 1040.
Price has traveled 1150-1040 = 110 pips down from the High, that's 10 pips more than the 100 pips of the Average Day Range, so the RoomDown will be -10 pips (and the stoploss will be -10/Risk_to_Reward_ratio).

(And price has traveled 1040-1000= 40 pips from the Low so the RoomUp will be positive (=100-40=60), nothing special here.)
--------

v1.3: added 2 horizontal lines at the level of the StopLosses: Green line for Long SL, Red line for Short SL.
*/
 
Ade rasenye..tapi skang away dr laptop..saye try check ble ade mase
 
//+------------------------------------------------------------------+
//| (T_S_R)-Daily Range Calculator v1.3.mq4 |
//| Copyright © 2006, Ogeima |
//| [email protected]
//|Made for the TSR (Trend Slope Retracement) system by FXiGoR |
//|http://strategybuilderfx.com/showthread.php?t=17252 |
//+------------------------------------------------------------------+
// For basic explanations, see the notes at the end this script.
// For information regarding the T_S_R method, read the "FXiGoR-(T_S_R) very effective Trend Slope Retracement system" thread opened by iGoR at StrategyBuilderfx, Forex-tsd, MoneyTec, ForexFactory or Trade2Win.
#property copyright "Copyright © 2006, Ogeima"
#property link "[email protected]"

#property indicator_chart_window
#property indicator_buffers 2
#property indicator_color1 Green
#property indicator_color2 Red

//---- input parameters
extern double Risk_to_Reward_ratio = 3.0;

double aSL_Long[];
double aSL_Short[];
int nDigits;

//+------------------------------------------------------------------+
//| Custom indicator initialization function |
//+------------------------------------------------------------------+
int init()
{
IndicatorBuffers(2);
SetIndexStyle(0,DRAW_LINE,STYLE_SOLID,3);
SetIndexStyle(1,DRAW_LINE,STYLE_SOLID,3);

SetIndexBuffer(0,aSL_Long);
SetIndexBuffer(1,aSL_Short);

SetIndexEmptyValue(0,EMPTY_VALUE);
SetIndexEmptyValue(1,EMPTY_VALUE);

if(Symbol()=="GBPJPY" || Symbol()=="EURJPY" || Symbol()=="USDJPY" || Symbol()=="CHFJPY" || Symbol()=="GOLD" || Symbol()=="_SP500") nDigits = 2;
else nDigits = 4;
return(0);
**
//+------------------------------------------------------------------+
//| Custom indicator deinitialization function |
//+------------------------------------------------------------------+
int deinit()
{
Comment("");
return(0);
**
//+------------------------------------------------------------------+
//| Custom indicator iteration function |
//+------------------------------------------------------------------+
int start()
{
int R1=0,R5=0,R10=0,R20=0,RAvg=0;
int RoomUp=0,RoomDown=0,StopLoss_Long=0,StopLoss_Short=0;
double SL_Long=0,SL_Short=0;
double low0=0,high0=0;
string Text="";
int i=0;

R1 = (iHigh(NULL,PERIOD_D1,1)-iLow(NULL,PERIOD_D1,1))/Point;
for(i=1;i<=5;i++) R5 = R5 + (iHigh(NULL,PERIOD_D1,i)-iLow(NULL,PERIOD_D1,i))/Point;
for(i=1;i<=10;i++) R10 = R10 + (iHigh(NULL,PERIOD_D1,i)-iLow(NULL,PERIOD_D1,i))/Point;
for(i=1;i<=20;i++) R20 = R20 + (iHigh(NULL,PERIOD_D1,i)-iLow(NULL,PERIOD_D1,i))/Point;

R5 = R5/5;
R10 = R10/10;
R20 = R20/20;
RAvg = (R5+R10+R20)/3;

low0 = iLow(NULL,PERIOD_D1,0);
high0 = iHigh(NULL,PERIOD_D1,0);

RoomUp = RAvg - (Bid - low0)/Point;
RoomDown = RAvg - (high0 - Bid)/Point;
StopLoss_Long = RoomUp/Risk_to_Reward_ratio;
SL_Long = Bid - StopLoss_Long*Point;
StopLoss_Short = RoomDown/Risk_to_Reward_ratio;
SL_Short = Bid + StopLoss_Short*Point;

Text = "Average Day Range: " + RAvg + "\n" +
"Prev 01 Day Range: " + R1 + "\n" +
"Prev 05 Days Range: " + R5 + "\n" +
"Prev 10 Days Range: " + R10 + "\n" +
"Prev 20 Days Range: " + R20 + "\n";
Text = Text +
"Room Up: " + RoomUp + "\n" +
"Room Down: " + RoomDown + "\n" +
"Max. StopLosses should be :" + "\n" +
"Long: " + StopLoss_Long + " Pips at " + DoubleToStr(SL_Long,nDigits) + "\n" +
"Short: " + StopLoss_Short + " Pips at " + DoubleToStr(SL_Short,nDigits) + "\n";

Comment(Text);

//-- SL Lines
int limit;
int counted_bars=IndicatorCounted();
if(counted_bars<0) counted_bars=0;
if(counted_bars>0) counted_bars--;
limit = counted_bars;

for(i = 0 ;i <= limit ;i++)
{
if(i==0 || i==1 || i==2)
{
aSL_Long = SL_Long;
aSL_Short= SL_Short;
**
else
{
aSL_Long = EMPTY_VALUE;
aSL_Short= EMPTY_VALUE;
**
**
return(0);
**
//+------------------------------------------------------------------+
/*
Here's a little "indicator" that does some basic calculations for us.

Let's look at what it does:
It computes yesterday's range, the previous 5, 10 and 20 days ranges. And it calculates the "Average Day Range" of these four ranges (yesterday's+ Prev 5 Day Range + Prev 10 Day Range + Prev 20 Day Range)/4.
So, if yesterday's Day Range was 80, the Previous 5 Day Range was 110, the Previous 10 Day Range was 90 and the Previous 20 Day Range was 120, then the Average Day Range would be 100.

Then there's "Room Up" and "Room Down".
Let's imagine today's low is (so far) 1000 and today's high is (so far) 1050. At this moment the price is 1020.
So we're 1020-1000= 20 pips above the low, there is therefore 100-20=80 pips "left" up. For a risk-to-reward ratio of (say) 3, if a long trade was to be entered now, the stop loss should be no more than 80/3=26pips away, that is at 1020-26=994. So, if all conditions are met, we ll look for a "bottom" no lower than 994.
Same thing for a short trade: we are 1050-1020= 30 pips below the high, there is therefore 100-30=70 pips "left" down. For a risk-to-reward ratio of 3, if a short trade was to be entered now, the stop loss should be no more than 70/3=23pips away, that is at 1020+23=1043. So, if all conditions are met, we ll look for a "top" no higher than 1043.

As you can see, this indicator doesn't tell us whether or not we have a set up to trade. What it does is, considering some past day ranges, and for a given Risk to Reward ratio, it tells us how far away we can put a stop loss.

Hope this helps,

Ogeima.

P.S.: I used H-L (High-Low) to compute the Ranges. They are thus a bit different from mataf.net data, which computes what is known as the "True" Ranges (= Max(High for the period less the Low for the period,High for the period less the Close for the previous period,Close for the previous period and the Low for the current period)).

--------
PS1: occasionnally, as someone apparently pointed out in the chatroom, RoomUp/RoomDown (and the indicative stop losses) will have negative values. For example, let's imagine that the Average Day Range is 100, today's High is 1150, today's low is 1000 and the current price is 1040.
Price has traveled 1150-1040 = 110 pips down from the High, that's 10 pips more than the 100 pips of the Average Day Range, so the RoomDown will be -10 pips (and the stoploss will be -10/Risk_to_Reward_ratio).

(And price has traveled 1040-1000= 40 pips from the Low so the RoomUp will be positive (=100-40=60), nothing special here.)
--------

v1.3: added 2 horizontal lines at the level of the StopLosses: Green line for Long SL, Red line for Short SL.
*/

tkasih tuan.saya ada indi ni.yg sy cri adalah yg menunjukkan purate pergerakan utk hari isnin,selasa,rabu,khamis dan jumaat utk 10 minggu bukan purata pergerakan 5,10 atau 20 hari.tk
 

Live Forex Chart

Currency
Rates
EUR / USD
1.14790
USD / JPY
156.877
GBP / USD
1.33950
USD / CHF
0.82250
USD / CAD
1.39985
EUR / JPY
180.080
AUD / USD
0.71320
Back
Top
Log in Register