Ichimoku indicator analysis of USDX for November 21, 2017
The Dollar index is making new short-term higher highs but price remains below the cloud. Trend remains bearish in the medium-term. There are still chances that the entire decline from 95 is not over and we could see a move towards 93-92.50.
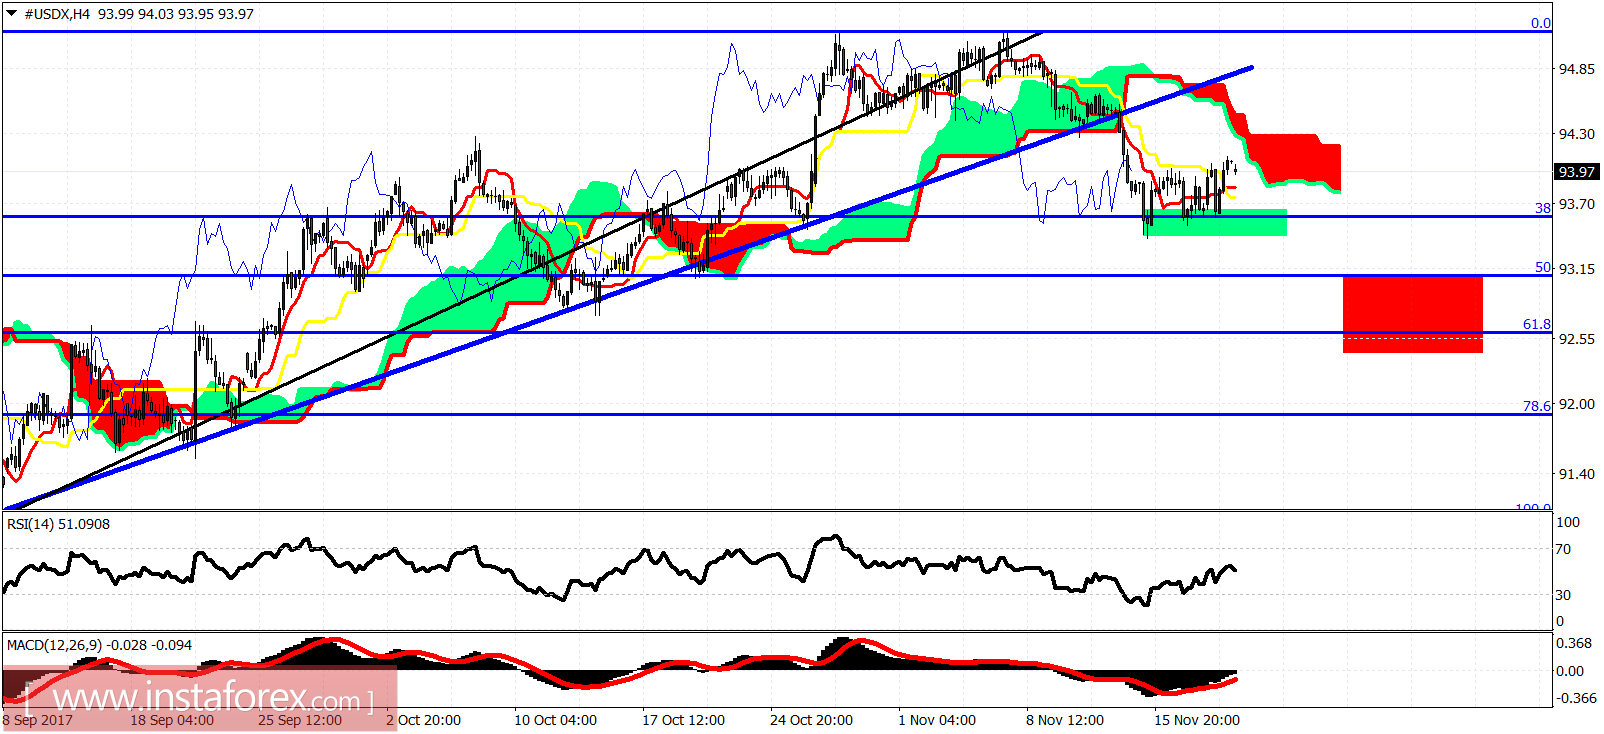
Blue line - trend line support (broken) Green rectangle - support Red rectangle - target if support fails The Dollar index stopped the decline at the 38% Fibonacci retracement. Price is below the 4-hour Kumo, so we consider short-term trend still bearish. Resistance is at 94.30-94.50. Breaking above it will open the way for a move towards 97 or higher. Support at 93.60-93.50 is also important. A break below it will open the way for a move towards the red rectangle area.
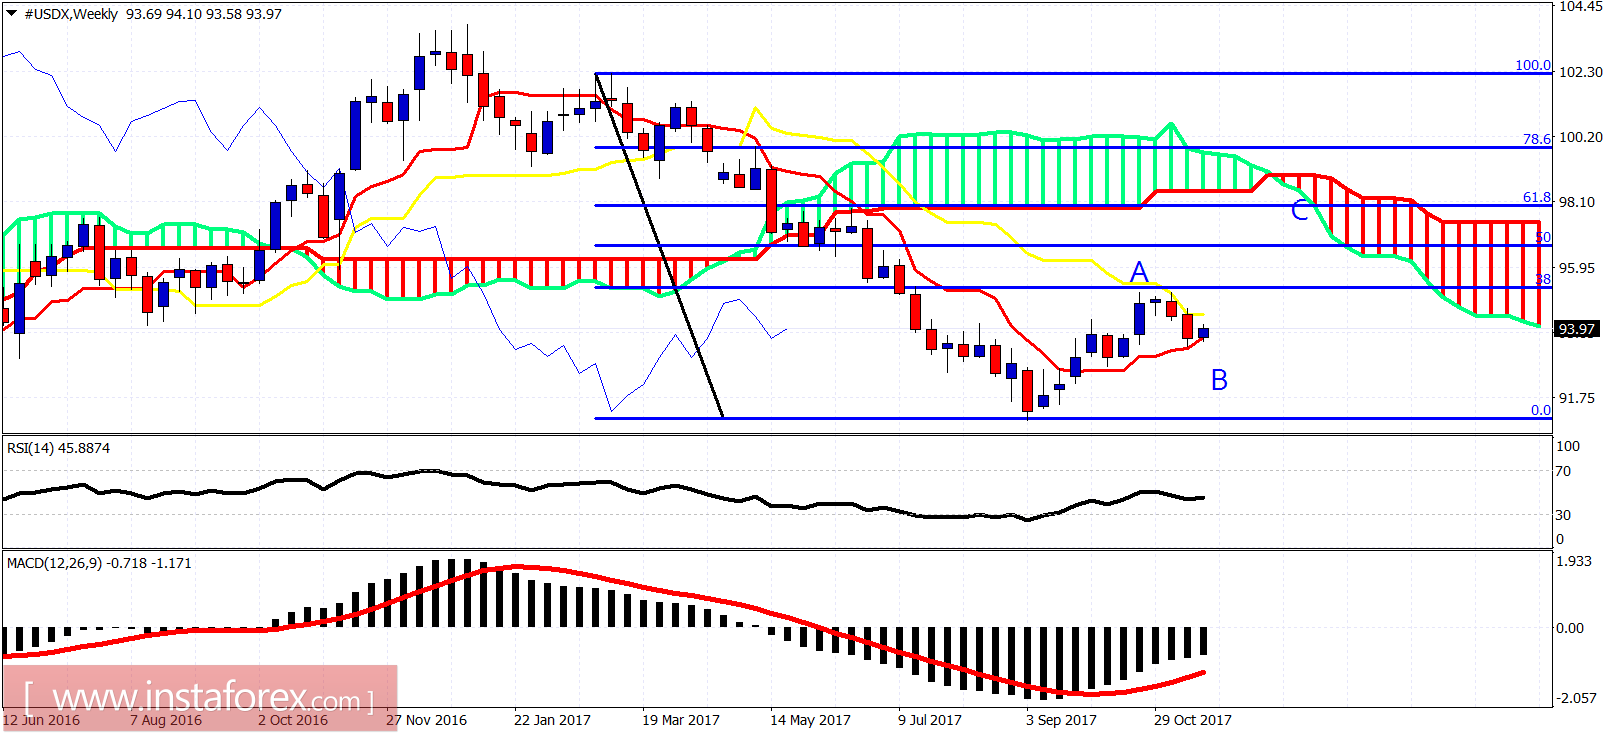
In the daily chart price holds above the daily tenkan-sen. The pull back from 95 could be over or we might need one more new low before moving towards the daily Kumo (cloud) near 97. I believe that it is more probable to see a new leg upwards than consider the entire bounce over.
Analisis Harian Indeks USDX untuk 22 November, 2017
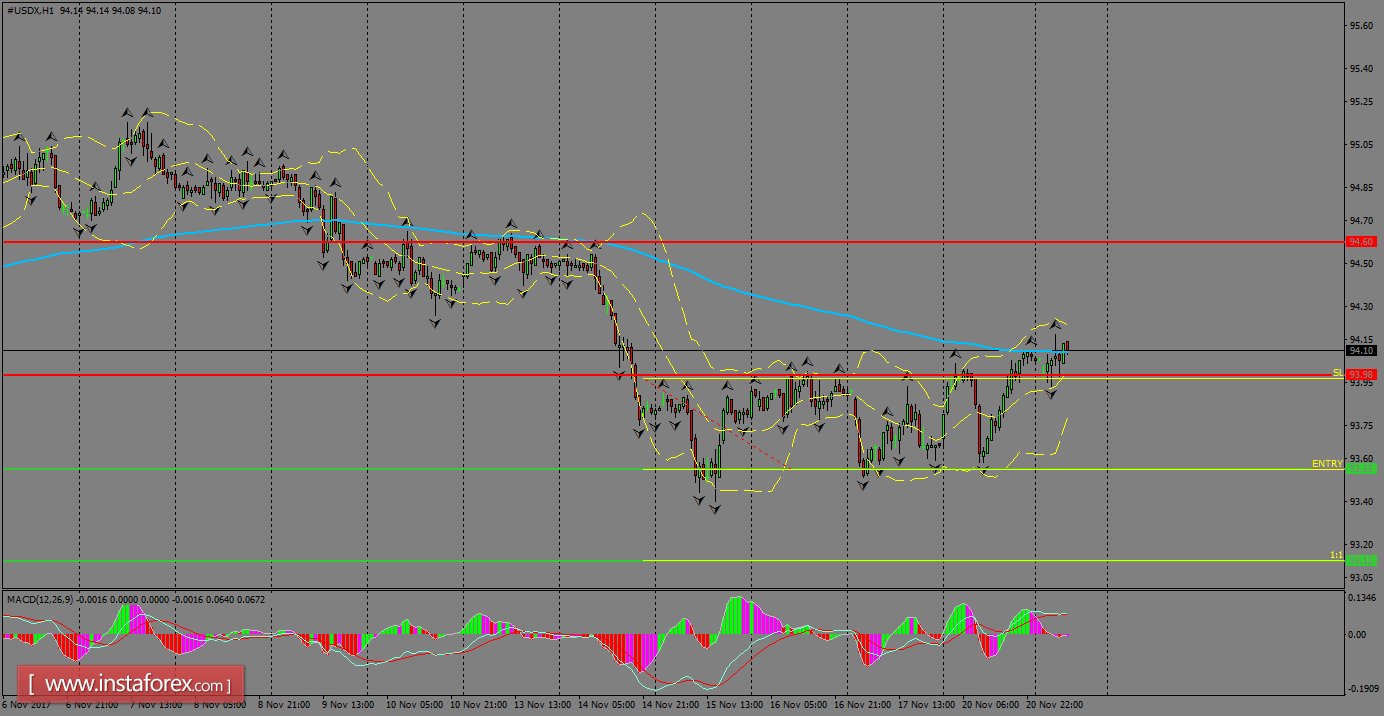
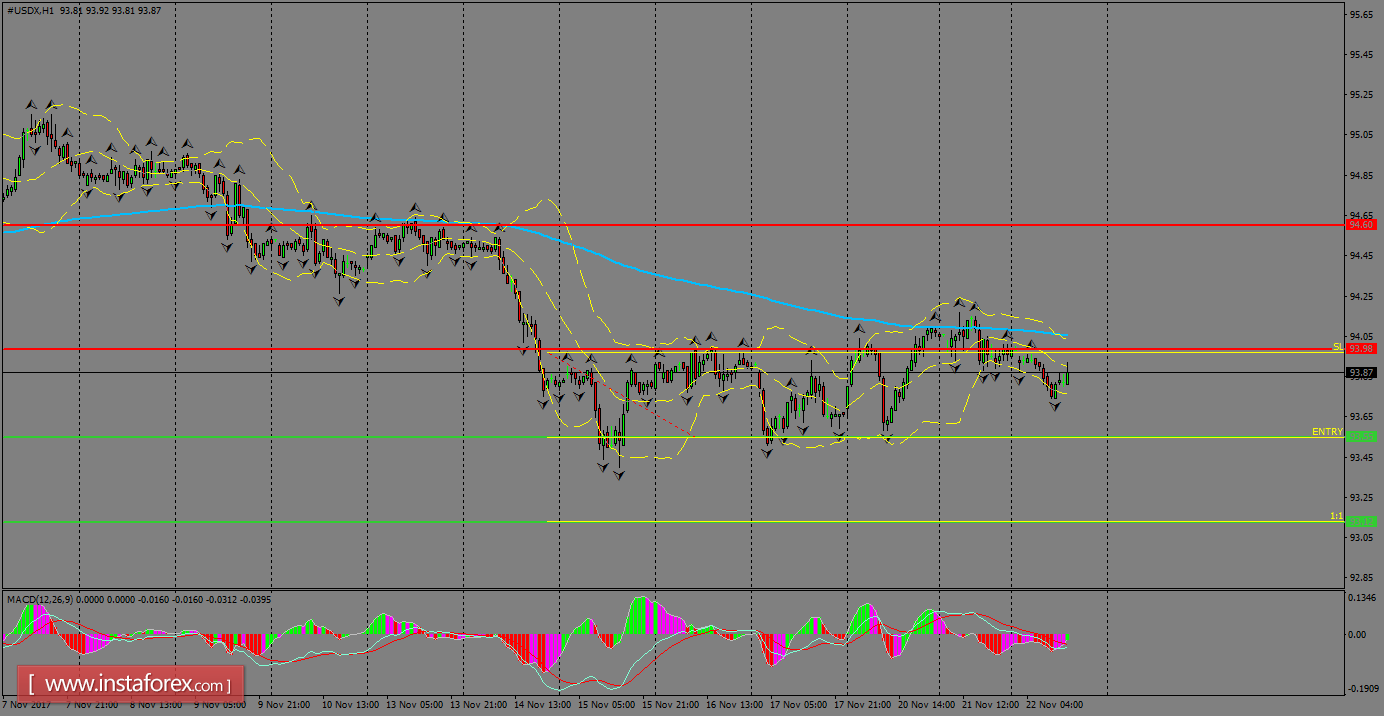
Indeks USDX sedang berusaha untuk meneruskan pemulihan yang dibuat daripada zon sokongan 93.55 dan harga menemui rintangan dinamik pada SMA 200 dalam carta 1H. Kawasan tersebut dijangkakan akan memberikan tawaran untuk Indeks USDX meneruskan penurunan harga dalam dagangan jangka pendek. Sekiranya sokongan yang disebutkan tadi berjaya ditembusi, maka rintangan yang seterusnya akan terletak pada tahap 93.12.
Tahap Rintangan Carta 1H: 93.98 / 94.60 Tahap Sokongan Carta 1H: 93.55 / 93.12 Cadangan Perdagangan untuk Hari Ini: Berdasarkan pada carta 1H, para pedagang disarankan untuk mengambil pesanan menjual (jual) hanya sekiranya Indeks USDX ini berjaya menembusi cartalilin penurunan harga; dengan menetapkan sokongan pada tahap 93.55, take profit pada tahap 93.12 dan stop loss pada tahap 93.97.
Ichimoku indicator analysis of USDX for November 22, 2017
The Dollar index made new higher highs yesterday but price got rejected at the cloud resistance. We could see a new lower low towards 92.50-93 before starting the next leg up towards 97.
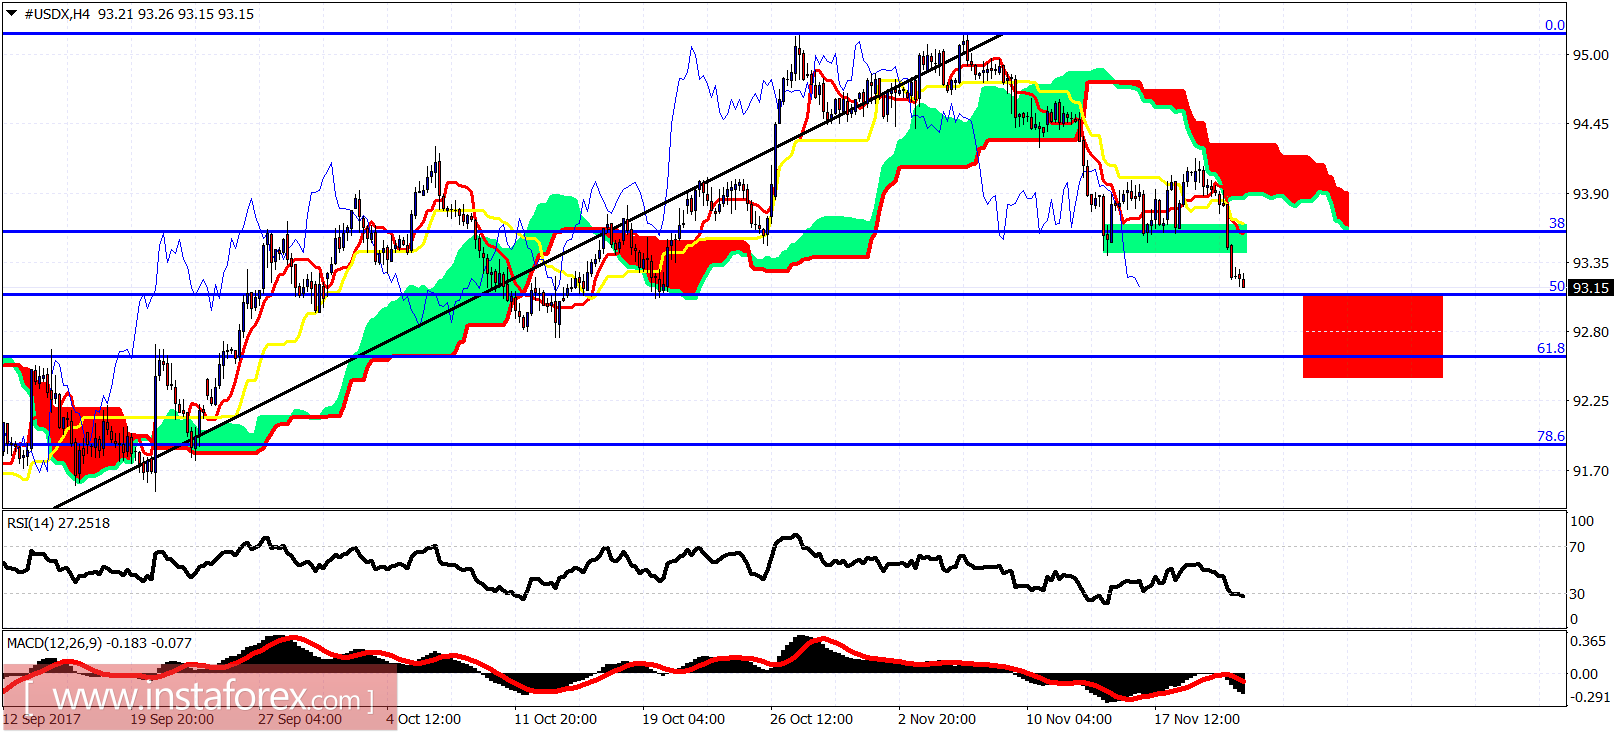
Green rectangle - support area Red rectangle - target if support area fails The Dollar index bounced off the 38% Fibonacci retracement towards cloud resistance and got rejected. Price remains below the 4-hour Kumo (cloud) something that strengthens the bearish short-term trend. Breaking below the green rectangle support area will be a bearish sign. Price will be next going towards the red rectangular area.
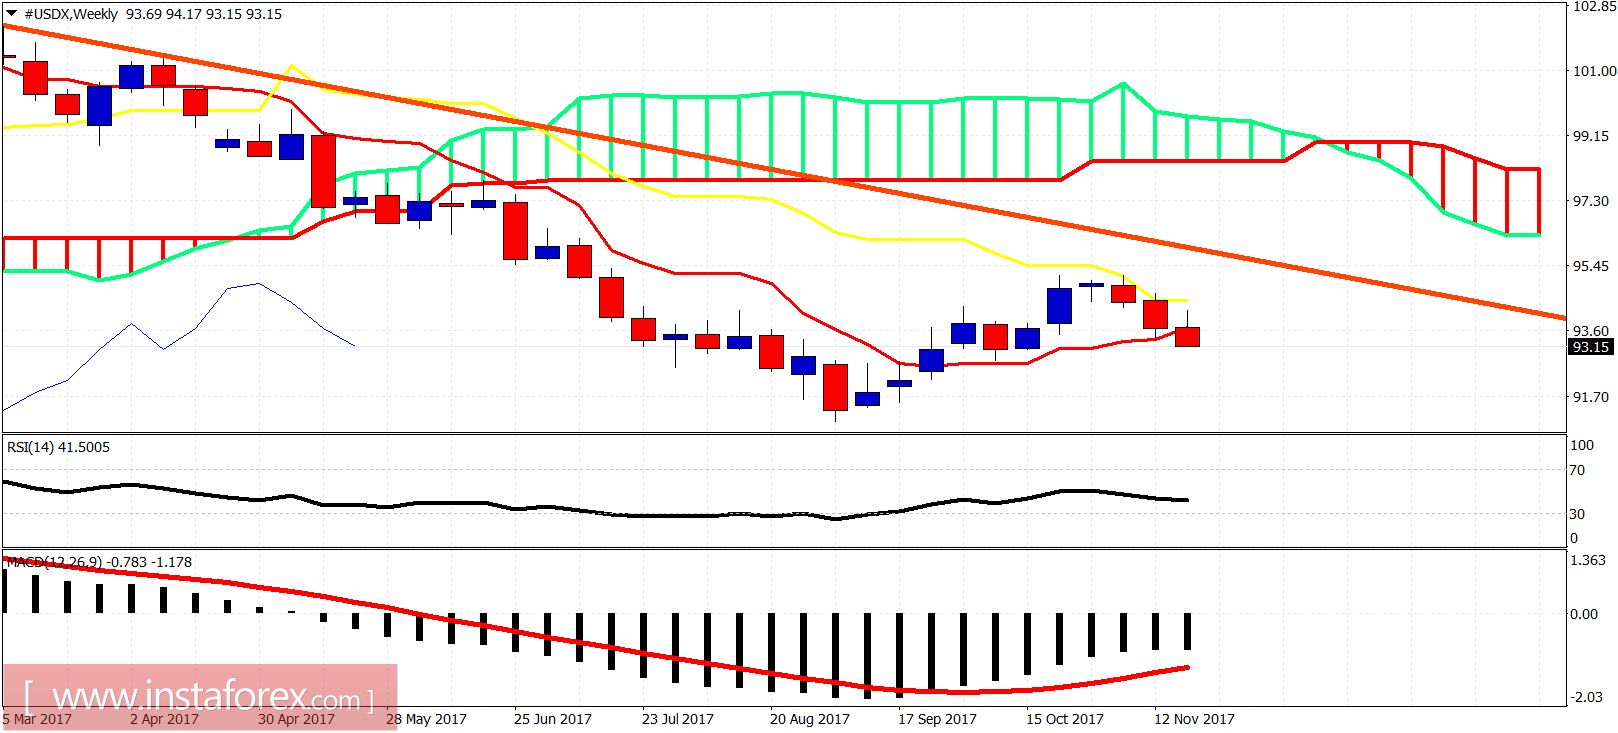
On a weekly basis, nothing has changed. Price is trapped between the kijun- and the tenkan-sen indicators. I believe the reversal from the 95 level when price got rejected at the kijun-sen, is only part of the upward bounce that started in September. I believe this upward corrective bounce is not over yet and we still have one more upward move towards 97 to finish the entire bounce.
Pasangan mata wang ini berada di atas 200 SMA dengan pergerakan secara mendatar pada keseluruhan carta, dengan sasaran harga masih berada di tahap 1.3309, di mana kenaikan harga dapat mengumpulkan kekuatan untuk mencapai sasaran seterusnya pada tahap 1.3360. Pergerakan harga ke arah bawah, jika pasangan mata wang GBP/USD berjaya menembusi di bawah moving average, maka ia dapat menemui tahap sokongan di tahap 1.3143.
Tahap rintangan carta H1: 1.3309 / 1.3360 Tahap sokongan carta H1: 1.3143 / 1.3037 Cadangan perdagangan untuk hari ini: Berdasarkan pada carta H1, pesanan beli (beli) hanya jika pasangan mata wang GBP/USD menembusi graf lilin kenaikan harga; tahap rintangan pada tahap 1.3309, mengambil keuntungan pada tahap 1.3360 dan stop loss pada tahap 1.3256.
Ichimoku indicator analysis of USDX for November 23, 2017
The Dollar index got rejected at the 4-hour Kumo and is making new lower lows below the short-term support area of 93.50-93.40. Trend remains bearish and we should expect price to bounce and make a lower low towards 92.50.
Green rectangle - support area (broken) Red rectangle - target area The Dollar index is now at the 50% Fibonacci retracement. We could see a bounce today but short-term trend is expected to remain bearish and price to move towards the red rectangular price range. Support is at 92.50 at the 61.8% Fibonacci retracement.
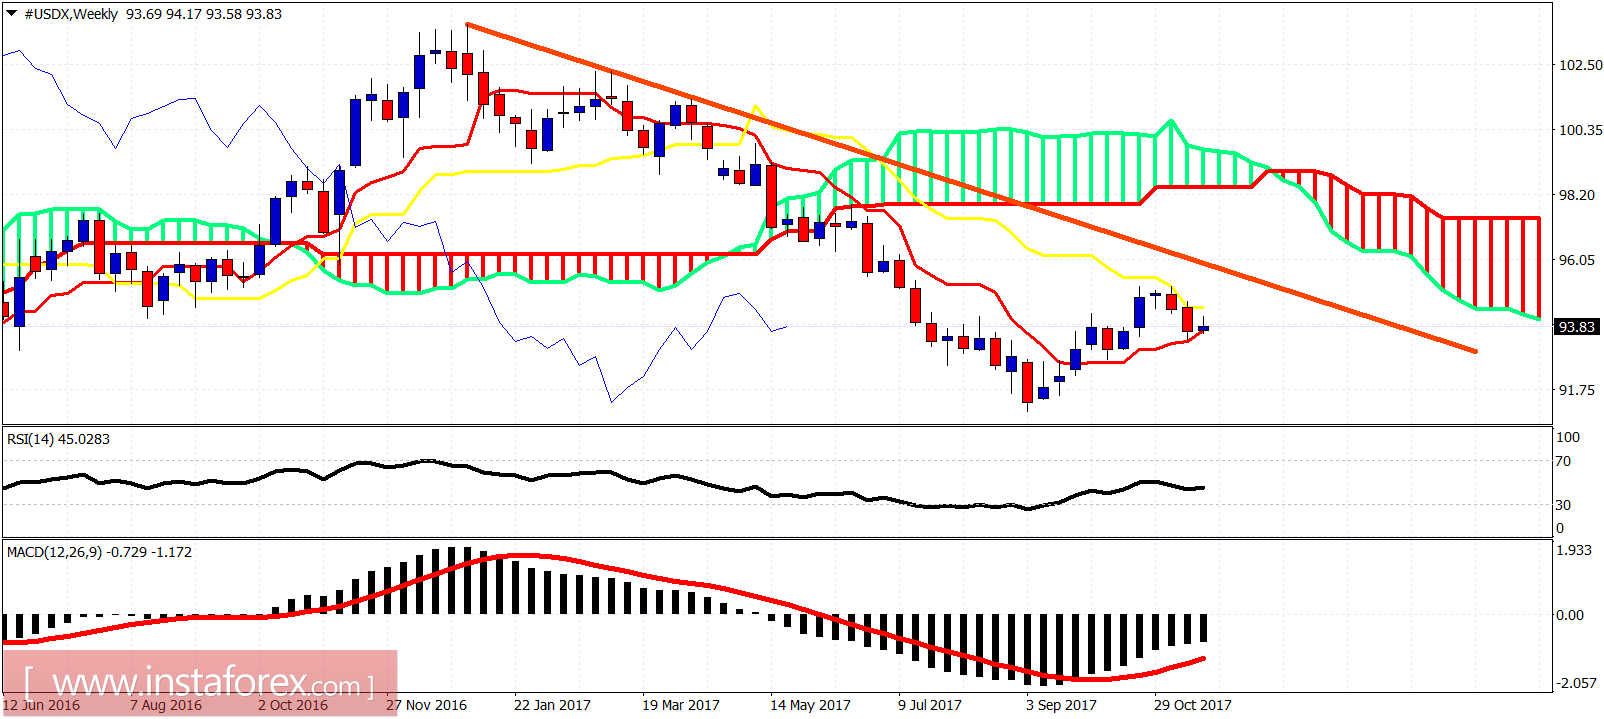
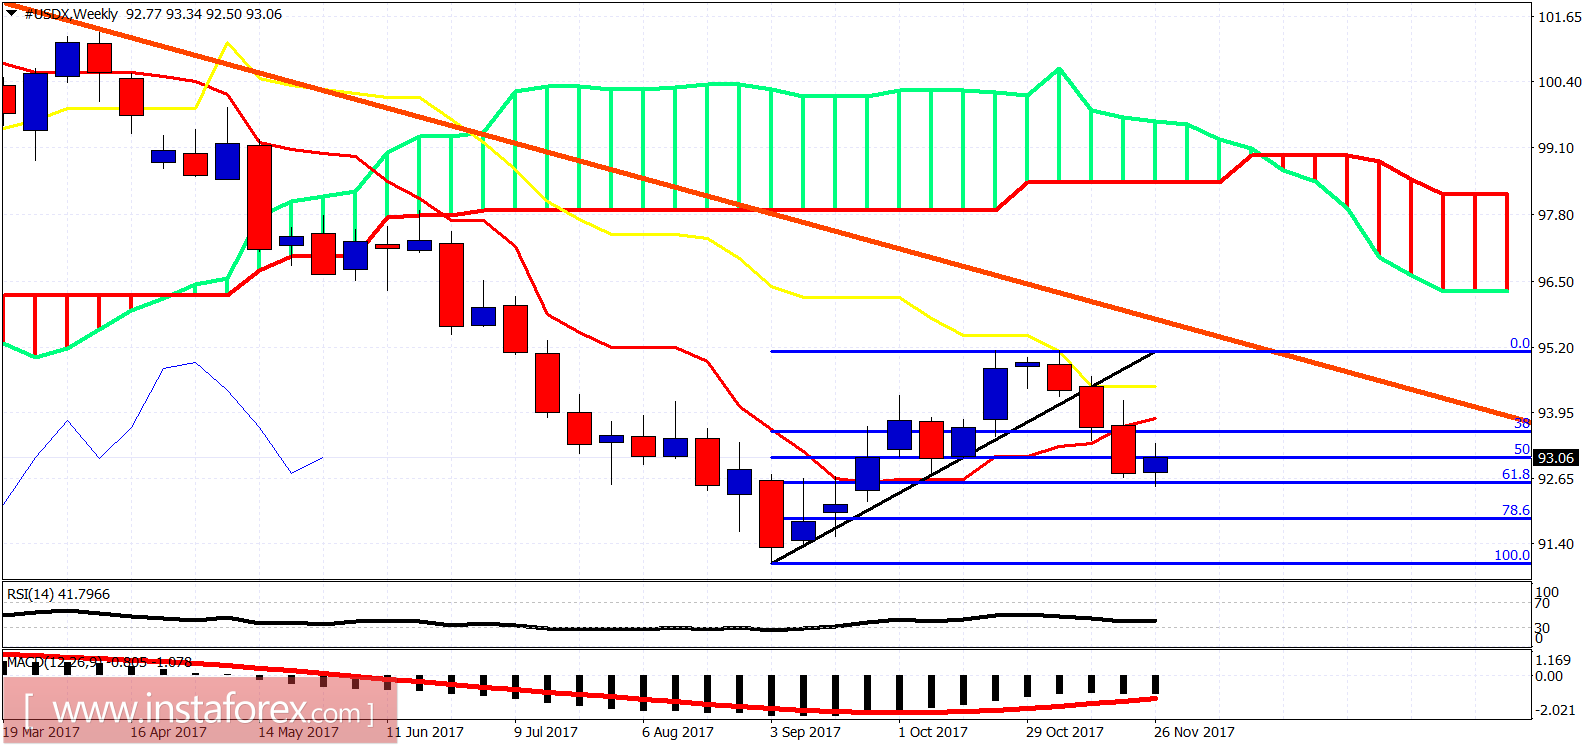
Red line - resistance The Dollar index in the weekly chart is breaking below the tenkan-sen. This is a bearish sign. A weekly close below the tenkan-sen will imply more downside next week. Trend remains bearish. Although I believe that we should expect a strong reversal next week, there is still no reversal sign or confirmation of a reversal yet.
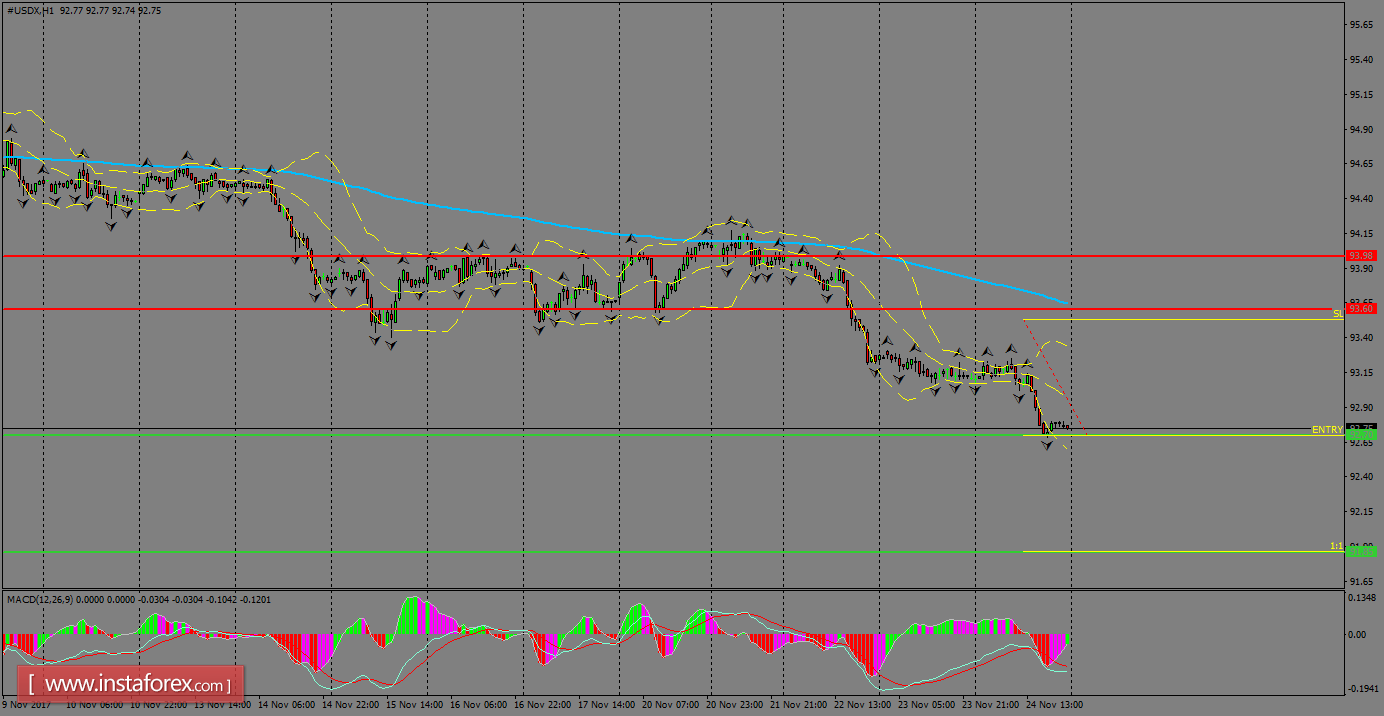
Analisis Harian Indeks USDX untuk 24 November, 2017
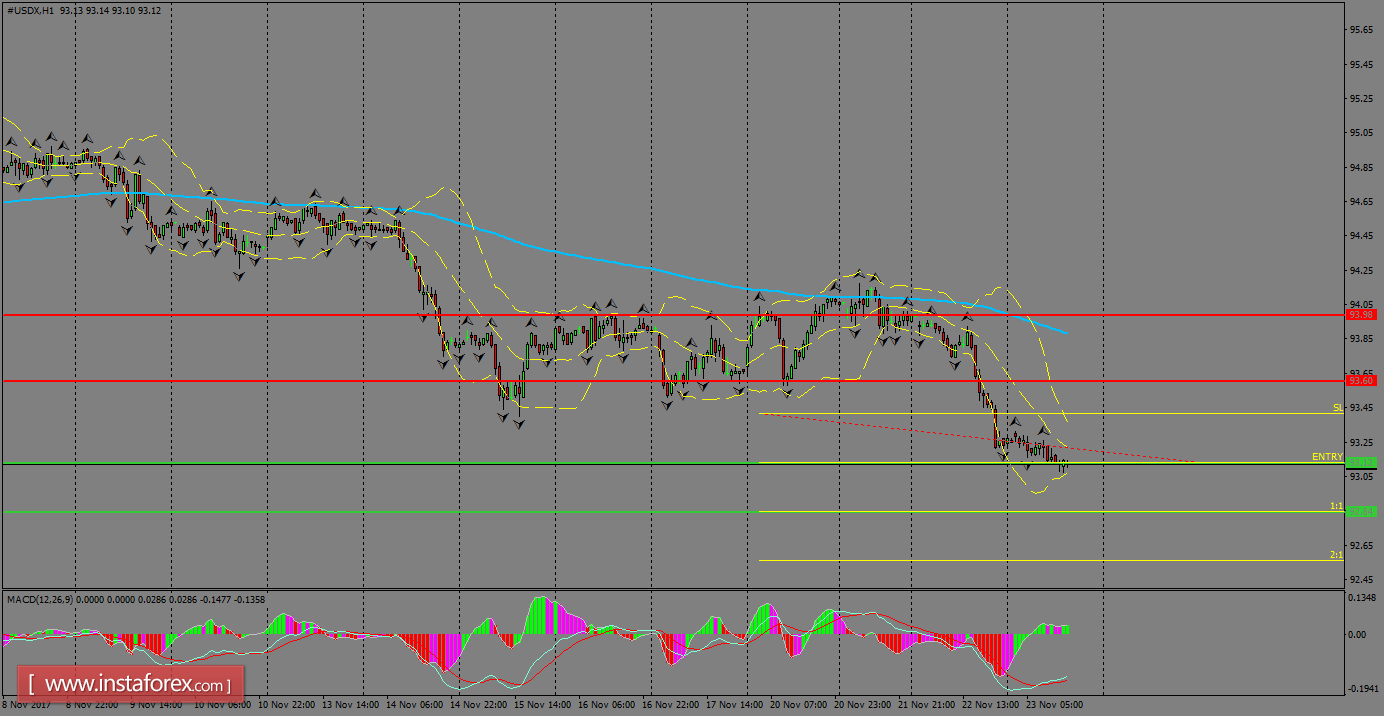
Indeks USDX meneruskan dagangan dalam aliran menurun ekoran pengumuman minit mesyuarat FOMC semasa sesi dagangan Rabu. Indeks USDX dilihat sedang menguji tahap rendah dan berpotensi untuk mencapai tahap sokongan 92.84, apabila harga berjaya menembusi di bawah taha[ 93.12. Sekiranya Indeks USDX ini menyaksikan lantunan semula harga pada tahap semasa, maka harga diramalkan akan mencapai SMA 200 pada carta 1H.
Tahap Rintangan Carta 1H: 93.60 / 93.98 Tahap Sokongan Carta 1H: 93.12 / 92.84 Cadangan Perdagangan untuk Hari Ini: Berdasarkan pada carta 1H, para pedagang disarankan untuk mengambil pesanan menjual (jual) hanya sekiranya Indeks USDX ini berjaya menembusi cartalilin penurunan harga; dengan menetapkan sokongan pada tahap 93.12, take profit pada tahap 92.84 dan stop loss pada tahap 93.41.
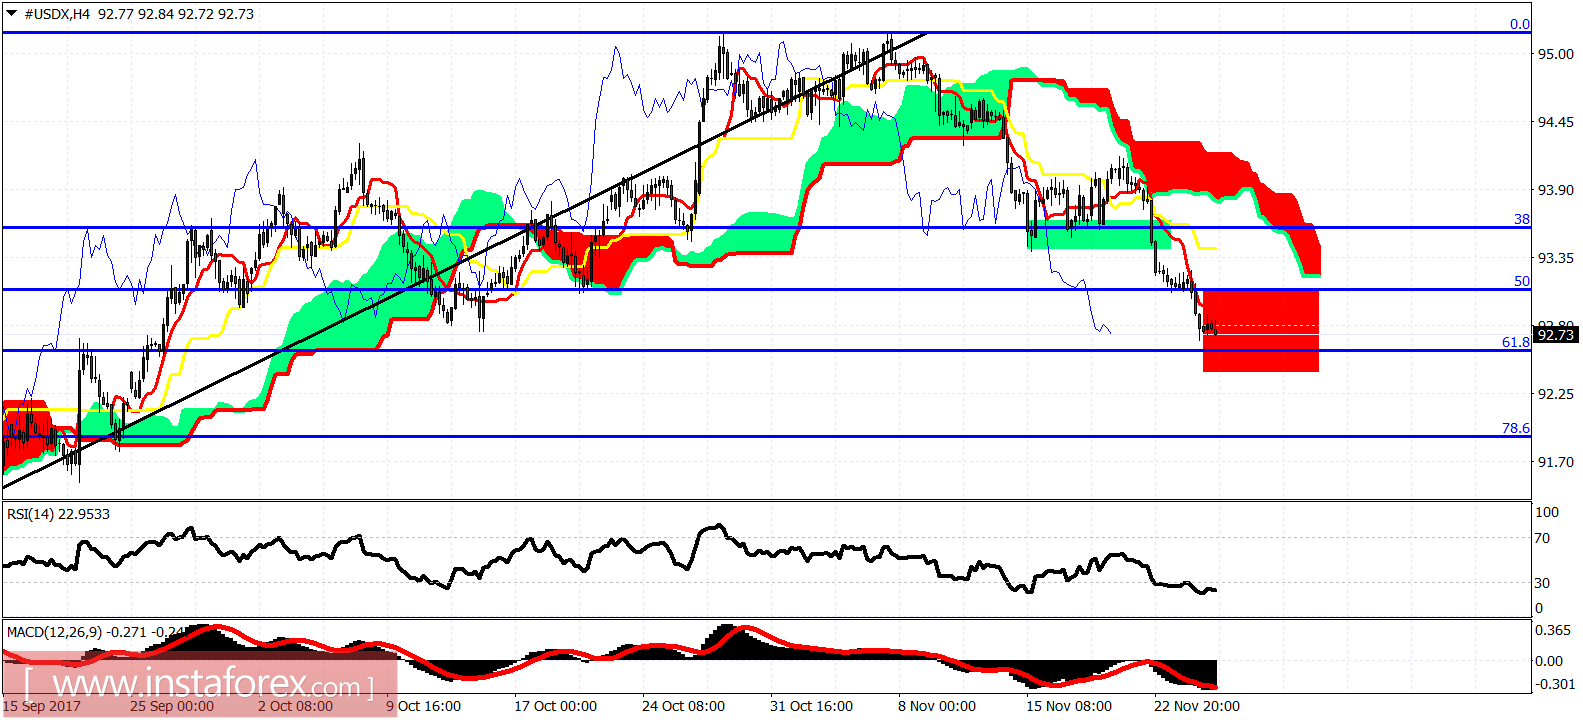
Ichimoku indicator analysis of USDX for November 24, 2017
The Dollar index is very close to our short-term bearish targets of 93.10-92.50. The trend remains bearish in the short-term. The Dollar index is could already have completed or is near completion of the downward move from 95. At least a short-term bounce will follow.
Green rectangle - support area (broken) now resistance Red rectangle - support area The Dollar index has broken below the 38% Fibonacci retracement support area shown by the green rectangle. The trend is bearish as the price is making lower lows and lower highs while below both the tenkan- and kijun-sen indicators. Resistance is at 93.40-93.60. Support is at 93-92.50.
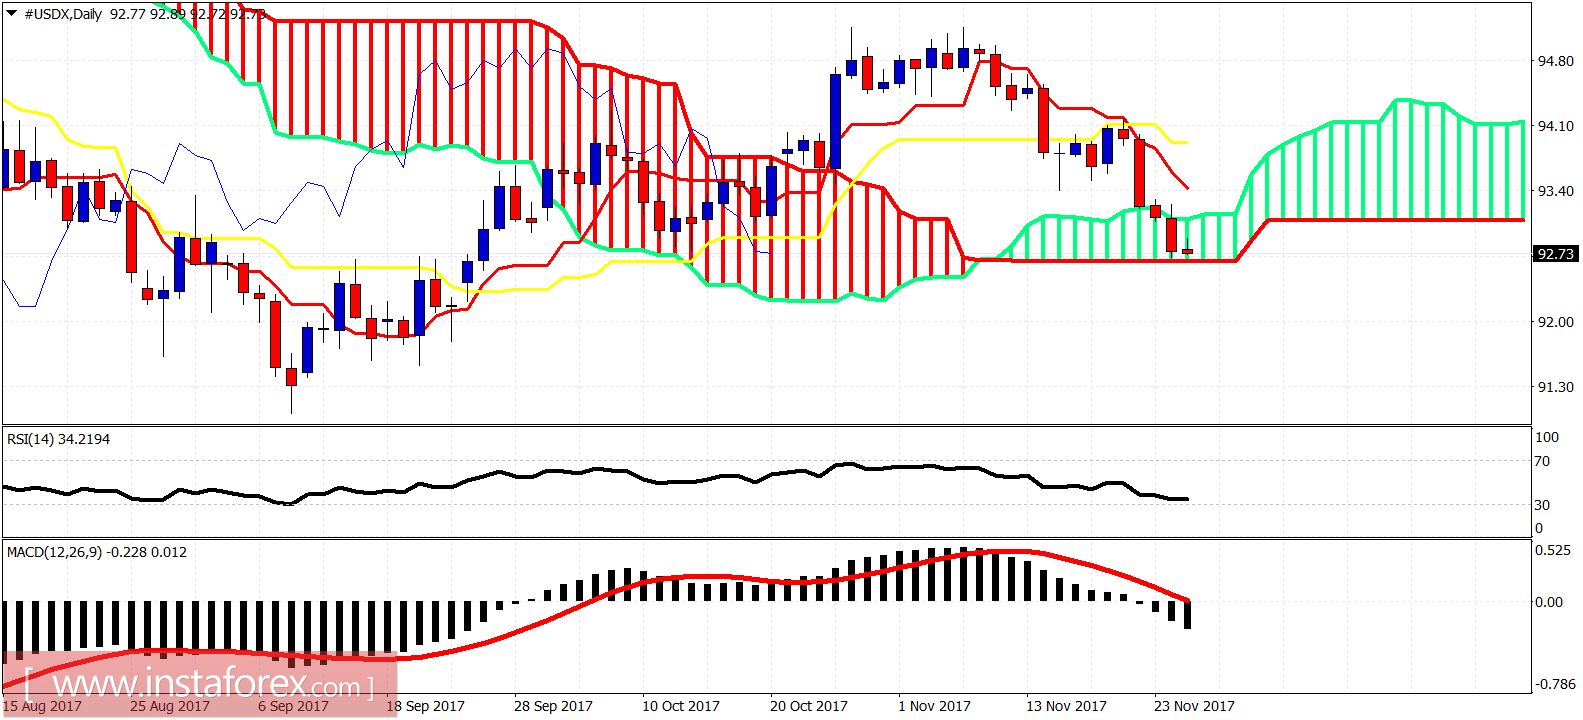
On a daily basis, the Dollar index is touching the Daily Kumo (cloud) support. Price is expected to bounce from current levels. Daily resistance is at 94.10. Support is at 92.70. I expect the Dollar index to start a new upward move from around these levels that will challenge November highs.
The index remains under pressure below the 200 SMA at H1 chart and the support level of 92.70 still holds across the board, favoring to a lower low pattern formation. If that level gives up, then the next leg lower should extend towards the 91.85 level. However, if USDX manages to rebound at the current stage, then the next target should be the 200 SMA, at which lies the resistance zone of 93.60.
H1 chart's resistance levels: 93.60 / 93.98 H1 chart's support levels: 92.70 / 91.85 Trading recommendations for today: Based on the H1 chart, place sell (short) orders only if the USD Index breaks with a bearish candlestick; the support level is at 92.70, take profit is at 91.85 and stop loss is at 93.53.
Ichimoku indicator analysis of USDX for November 27, 2017
The Dollar index has reached our short-term target area and the 61.8% Fibonacci retracement at 92.50. I expect a reversal from current levels to the upside. However we have still not seen any reversal sign.
Green rectangle - support area (broken) Red rectangle - target area (reached) The Dollar index has finally reached our short-term target. Trend is bearish as price remains below the 4 hour Kumo (cloud). Support is at the 61.8% Fibonacci retracement at 92.50 while resistance is at 93.40 and next at 93.90.
The Dollar index has entered the Ichimoku cloud area in the daily chart. A daily close below the cloud will be a bearish sign. Trend is neutral but very close to turning bearish again on a daily basis. I expect the Dollar index to bounce from the cloud support. Important Daily resistance at 94.10. Break above it and we could see more than just a bounce in the Dollar.
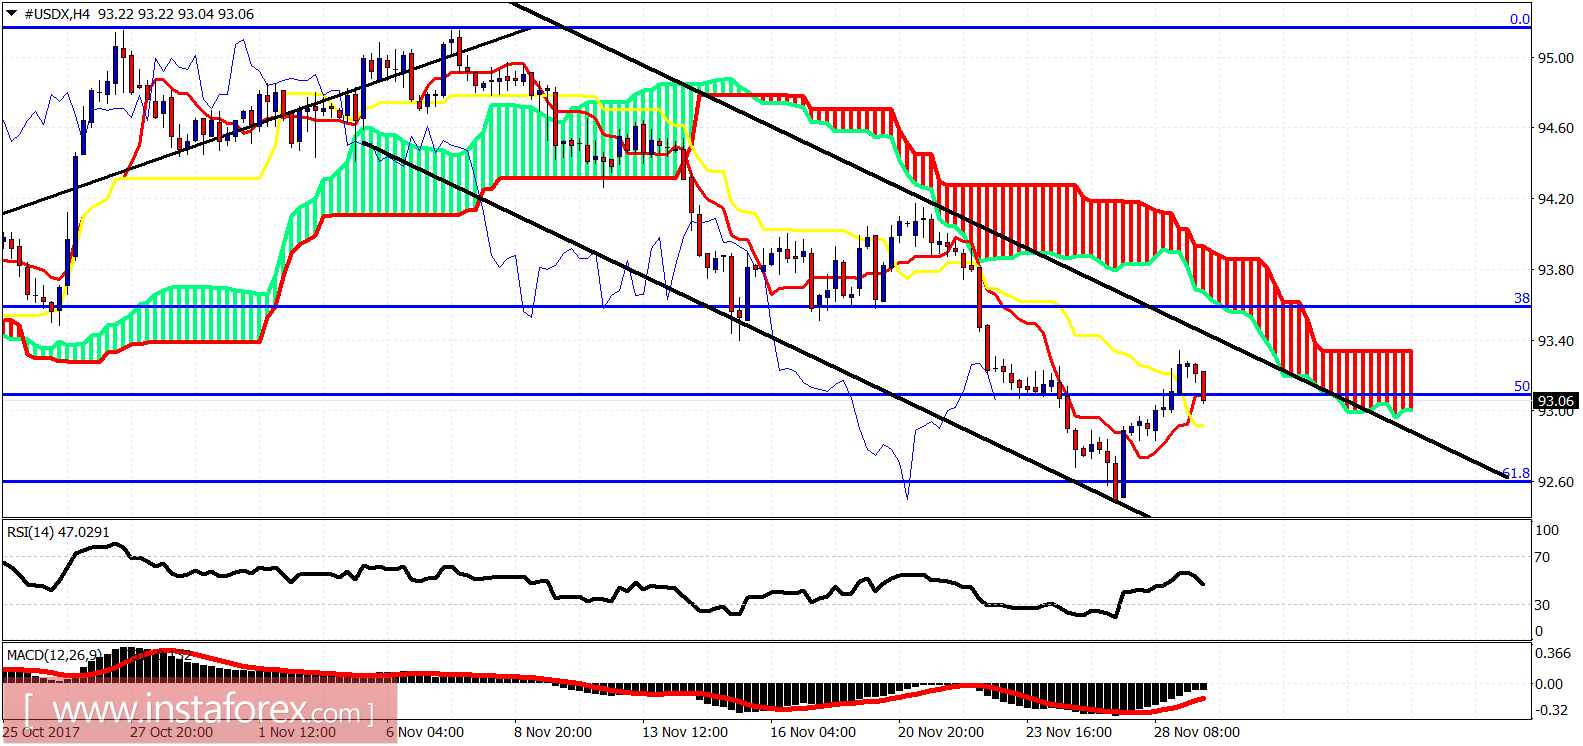
Ichimoku indicator analysis of USDX for November 29, 2017
The Dollar index remains inside the bearish channel and below the 4-hour Kumo (cloud). Trend remains bearish, however the bounce off the 61.8% Fibonacci retracement is an important sign that we should not ignore. Today's pullback is expected to be short lived.
Black lines - bearish channel The Dollar index bounced strongly yesterday and is now pulling back down. Support is at 92.93 and resistance at 93.40. I expect price to reverse to the upside and break above and out of the bearish channel and cloud resistance.
On a weekly basis, the Dollar index is showing reversal signs. A weekly close above 93.30 will be a very bullish sign. A weekly close below 92.80 will maintain the bearish trend for next week as well. Price is showing reversal signs off the 61.8% Fibo and over the next few weeks I believe it is more probable to see price move towards the weekly Kumo.