Ichimoku indicator analysis of USDX for June 15, 2017
Despite the Dollar weakness all day long yesterday, after the FOMC the Dollar showed reversal signs. There are important bullish divergence signs that imply the Dollar should bounce strongly from current levels.
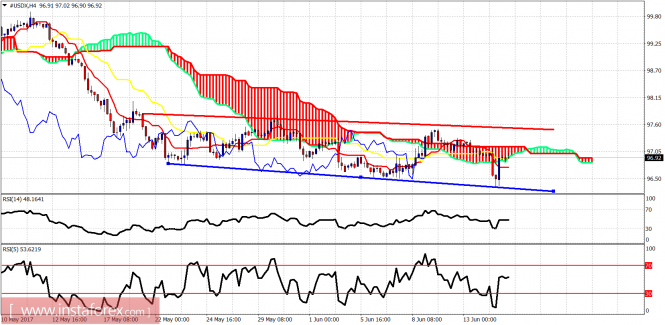
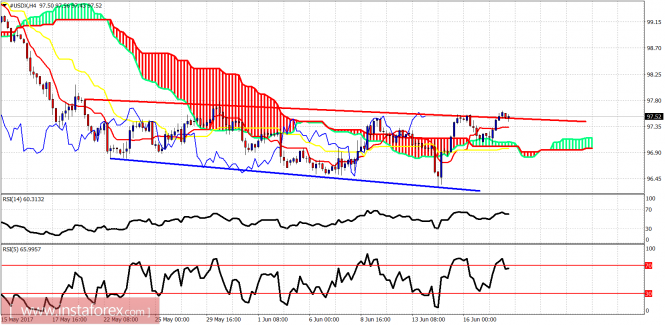
Red line - resistance Blue line - support Short-term resistance is at 97.50. Support at 96.50-96.30. Despite the new lower low yesterday, prices snapped back upwards. Price remains below the cloud and below the important red trend line resistance. Price is mainly moving sideways since late May.
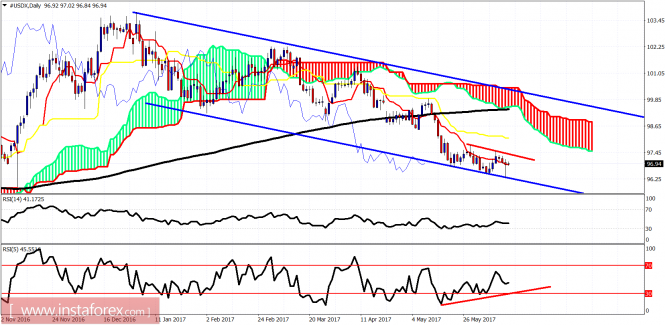
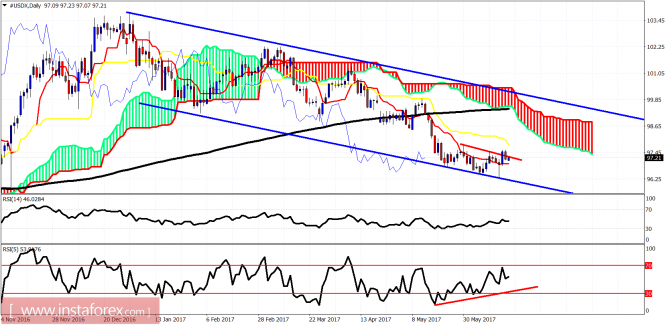
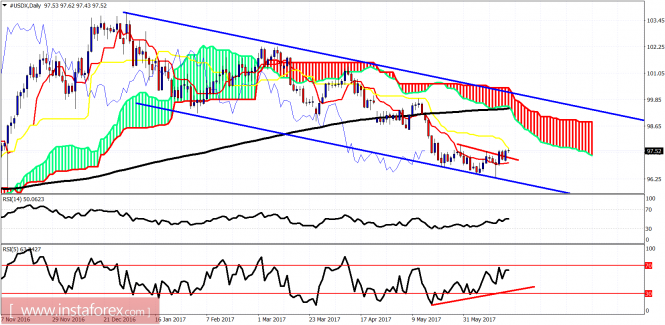
Red line - resistance Blue lines - bearish channel The Daily chart in the Dollar index shows clearly the divergence signs while trading on top of the lower channel boundary. Price behavior like this usually is followed by a sharp move higher. I expect price to reach the daily Kumo resistance area around 98.50-99 once the red trend line is broken.
Ichimoku indicator analysis of USDX for June 16, 2017
The Dollar index bounced strongly towards short-term resistance at 97.50. This is important resistance and price has stopped the rise. Bulls need to break above 97.50 in order for our bounce target of 99 to be achieved. 96.50 is now very critical support. If lost, we are most probably going near 94-95.
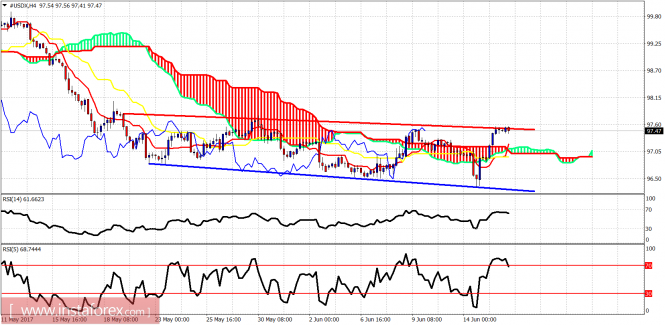
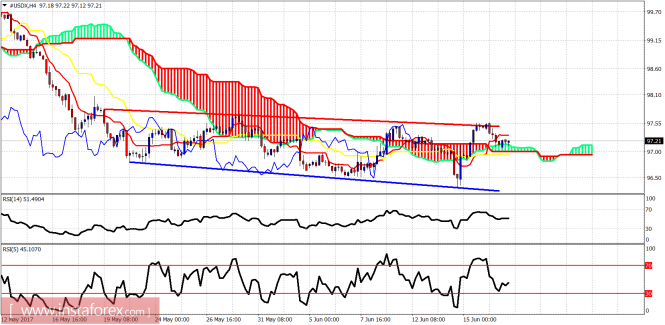
Red line - resistance Blue line - support The Dollar index is mainly moving sideways for the last few weeks. Price is at important short-term resistance. Price is above the Kumo (bullish) but the Kumo is very thin (bearish or weak support).
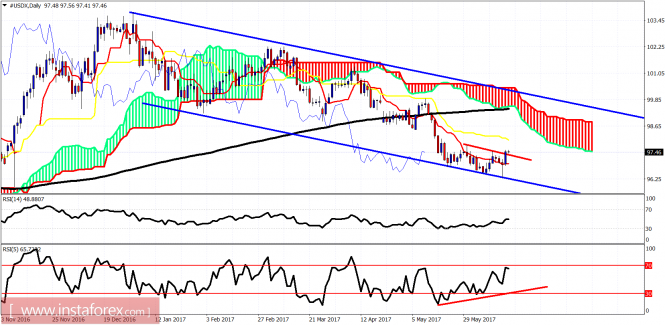
Blue lines - bearish channel Red line -short-term resistance The Dollar index is bouncing hard off the lower channel boundary. The 14th June daily candle is a reversal daily candle and as previously mentioned, I expect the Dollar index to move towards the Daily Kumo resistance at 98.50-99. This is not the time to be bearish the Dollar as long as price is above 96.50.
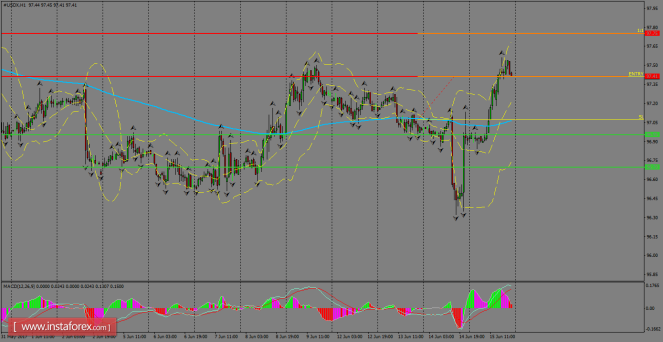
USDX posted strong gains during Thursday's session, consolidating its price action above the 200 SMA at H1 chart. The next hurdle to test is located around 97.75, which is a key supply area for sellers. To the downside, we can find some solid supports at the 96.95 and 96.70 levels; the last one is possible to generate some selling pressure once it's broken.
H1 chart's resistance levels: 97.41 / 97.75 H1 chart's support levels: 96.95 / 96.70 Trading recommendations for today: Based on the H1 chart, place buy (long) orders only if the USD Index breaks with a bullish candlestick; the resistance level is at 97.41, take profit is at 97.75 and stop loss is at 97.07.
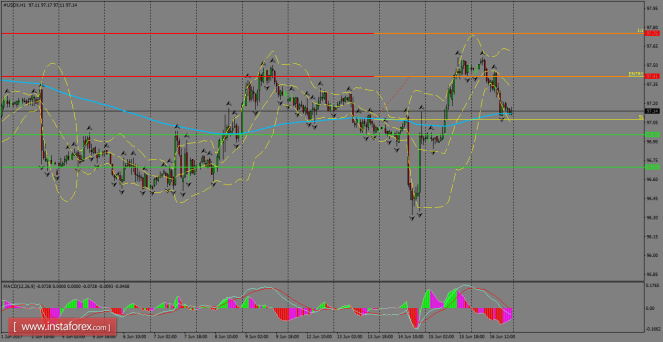
The index trimmed gains and it's being supported by the 200 SMA at H1 chart. So far, we're expecting the upside continuation in the greenback, but in case that we witness a breakout below 96.95, then further declines are expected to take place towards 96.70 in a first degree, while a consolidation above Friday's highs should take USDX to test the 97.75 level.
H1 chart's resistance levels: 97.41 / 97.75 H1 chart's support levels: 96.95 / 96.70 Trading recommendations for today: Based on the H1 chart, place buy (long) orders only if the USD Index breaks with a bullish candlestick; the resistance level is at 97.41, take profit is at 97.75 and stop loss is at 97.07.
Ichimoku indicator analysis of USDX for June 19, 2017
The Dollar index pulled back towards short-term cloud support and is bouncing. As I have been saying for the last few sessions while the index is around 96.50-97 I remain bullish for a bounce towards 98.50-99. After the bounce we will look to sell again.
Red line - resistance Blue line - support The Dollar index pulled back towards cloud support in the 4-hour chart. Only a break above 97.50 will confirm that the long-awaited bounce is starting. The Dollar index has been mainly moving sideways since mid-May. Trend is neutral.
Blue lines - bearish channel Red line - short-term resistance The Dollar index has most probably made a short-term low a couple of days ago. Price is showing reversal signs and I still expect the Dollar index to move towards the daily Kumo (cloud) at 98.50-99 area. I remain short-term bullish about the US dollar.
Ichimoku indicator analysis of USDX for June 20, 2017
The Dollar index bounced off support yesterday as we expected and is trying to break above the 97.50 short-term resistance. This will mean that the move towards 98.50 we were expecting has started.
Red line - resistance Blue line - support The Dollar index bounced off the short-term cloud support and is trying to break above resistance. Trend is neutral as the index has been trading in a range for several weeks. Short-term support is at 97. Resistance at 97.50-97.60.
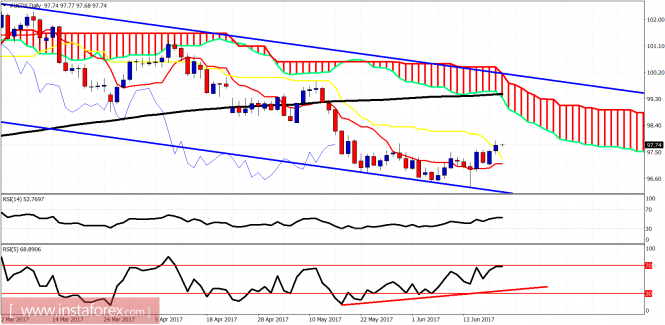
Blue lines - bearish channel Red line - resistance trend line The Dollar index is diverging in the daily chart and is bouncing off the lower channel boundary. I still expect price to move towards the daily Kumo at least near 98.30-98.50. It is also possible to reach the upper channel boundary. To sum up, I remain bullish about the US dollar at least for the short term.
Trading Plan for US Dollar Index for June 20, 2017
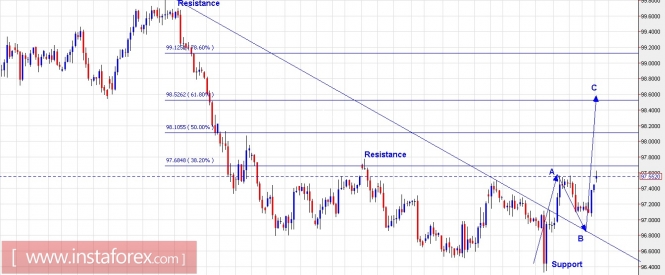
Technical outlook: The US Dollar Index is seen to be trading at 97.50 levels for now after breaking above the resistance line as seen here. Please note that the index might be unfolding into wave 4 corrective of a higher degree. It is expected to unfold into 3 waves A-B-C as depicted here. Ideally, prices should drop towards one more low and terminate into wave B, before turning higher towards wave C as depicted here. Looking into the wave structure, waves 3-3-5 could unfold before the medium-term drop could resume. Immediate resistance is seen at 97.80 levels while support is at 96.30 levels respectively. A safe strategy could be to remain flat for now and consider buy positions at a lower price near 97.00 levels. On the flip side, a continued push higher would indicate further higher targets around 99.00 levels. Trading plan: Please remain flat for now and consider buy positions around 97.00 levels, stop at 96.30, targeting 99.00 at least. Fundamental outlook: There is no major event lined up for the rest of the day. Good luck!
Ichimoku indicator analysis of USDX for June 21, 2017
The US dollar index is reversing higher. The short-term trend is bullish as price has broken above the 97.50 short-term resistance and is trying to break above a multi-week sideways consolidation.
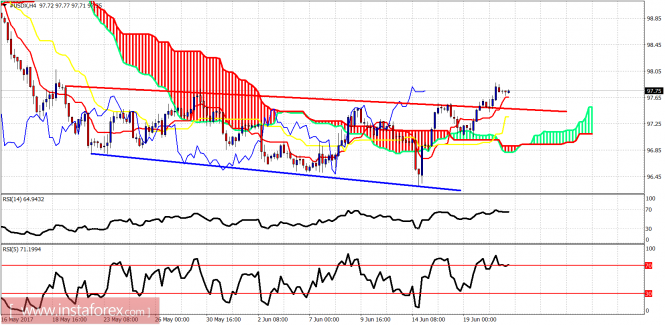
Red line - resistance (broken) Blue line - support USDX is making higher highs and higher lows. Price has broken above the red trend line resistance and is trading above both the tenkan- and kijun-sen indicators. The trend is bullish. Short-term support is found at the 4-hour Kumo at 97.
Blue lines - bearish channel Red line - bullish divergence The daily chart confirms our bullish expectations. The bullish divergence has warned us that a bounce was coming. Price has broken above the kijun-sen and is heading towards the Daily Kumo at 98.50 or even the upper channel boundary at 99. I warned dollar bears to protect their positions. This was not the time to be bearish in this market. Only after a bounce towards our target we will look to sell again.
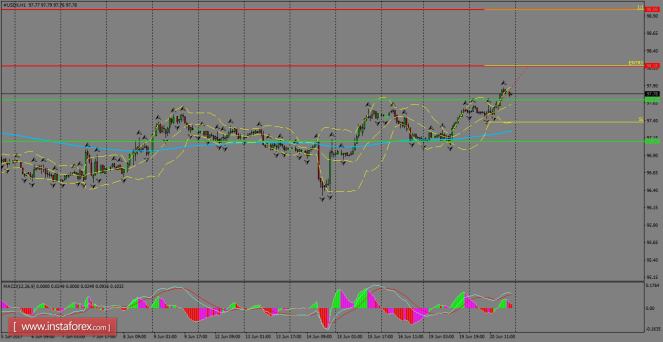
The index has been favored by a bullish bias above the 200 SMA at H1 chart and it's now heading to the first target around 98.18, where a selling's pressure might happen. Overall, the structure remains bullish and as long as USDX stays above the 200 SMA, further gains are expected to take place towards 98.98, which is our main target to the upside.
H1 chart's resistance levels: 98.18 / 98.98 H1 chart's support levels: 97.70 / 97.10 Trading recommendations for today: Based on the H1 chart, place buy (long) orders only if the USD Index breaks with a bullish candlestick; the resistance level is at 98.18, take profit is at 98.98 and stop loss is at 97.37.
Trading Plan for US Dollar Index for June 21, 2017
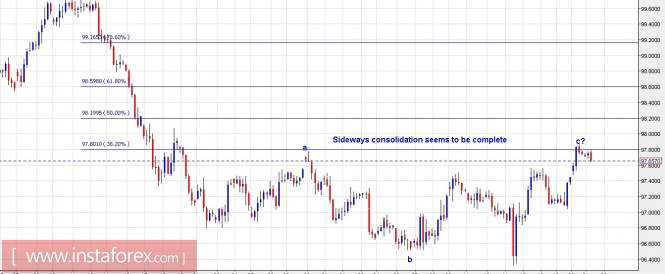
Technical outlook: The US Dollar Index also seems to have completed its sideways consolidation structure around 97.80 for now. Moreover, the complex corrective structure a-b-c looks to be taking resistance from the fibonacci 0.382 levels as well, which is a typical co-relation for a wave 4 termination. If this wave count is correct and it comes to be true, we should see prices dropping lower from here and continue to print below 96.30 to complete wave 3 of a larger degree before resuming its rally. On the flip side, it the index pushes beyond 98.00/10 levels from here it would mean that the flat corrective structure is not complete yet and should terminate around 99.00 levels. In either case, we shall be looking to remain short (on rallies) going forward. Trading plan: Please remain short, stop is at 98.20/30, targeting below 96.30. Fundamental outlook: There are no major events for the rest of the day. Good luck!