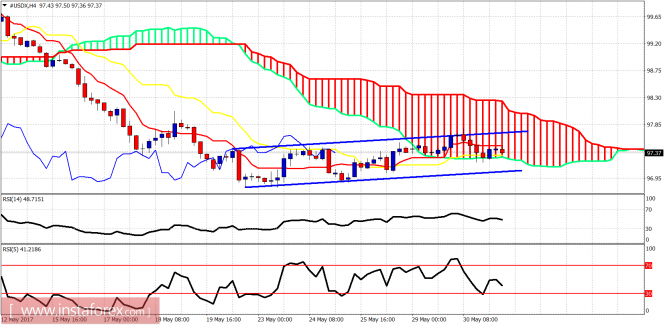
Ichimoku indicator analysis of USDX for May 31, 2017
The Dollar index strength was short lived as price fell back towards short-term support at 97.25 area. Price remains inside a sideways channel and trading range. We need a clear break above 97.75 or below 97 to see a clear trending move.
Blue lines - sideways channel The Dollar index is trading inside the 4-hour Kumo. Trend is neutral as we also mentioned yesterday. Unless the trading range boundaries are broken, we will remain in the range until Friday and the announcement of the NFP data.
Red line - resistance Green line - support (broken) The weekly candles are at important Kumo (cloud) support. I expect a bounce from the 97 area and the Friday NFP data could be the trigger behind the expected Dollar bounce. I would not be bearish at current levels.
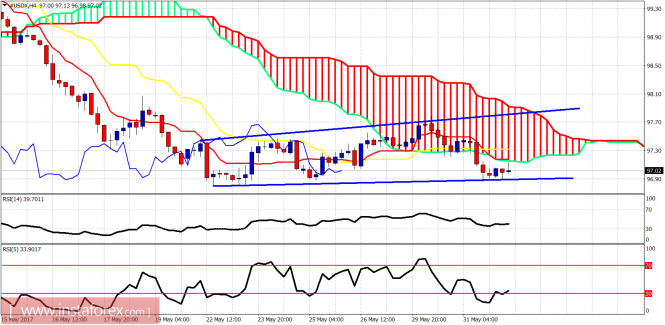
Ichimoku indicator analysis of USDX for June 1, 2017
The Dollar index remains above support at 97. I continue to favor at least a short-term bounce towards 99. I'm not bearish at current levels and at least I prefer to be neutral.
Blue lines - trading range The Dollar index is below the Kumo (cloud). Support is at 97. Resistance is at 97.30-97.40 and next at 97.70. I continue to expect a stronger bounce towards 99 but for that to happen we will need confirmation with a break above 97.70.
Red line - resistance Green line - broken long-term support The Dollar index is still trading on top of the weekly Kumo(cloud) support. This level should produce at least a short-term bounce before price moving lower. Maybe tomorrow's NFP report will be the trigger.
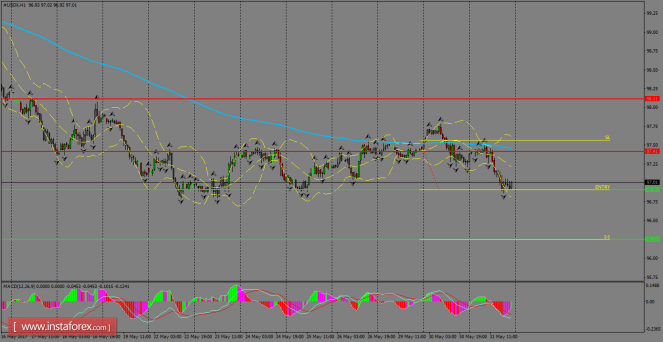
The index is finding support around 96.00, as the bears continue to keep pressure the greenback in the short-term. Once it manages to break below the 96.90 level, then we might see some declines to take place towards 96.25. However, if USDX does a consolidation above the 200 SMA at H1 chart, it can look for the 98.11 level.
H1 chart's resistance levels: 97.41 / 98.11 H1 chart's support levels: 96.90 / 96.25 Trading recommendations for today: Based on the H1 chart, place sell (short) orders only if the USD Index breaks with a bearish candlestick; the support level is at 96.90, take profit is at 96.25 and stop loss is at 97.56.
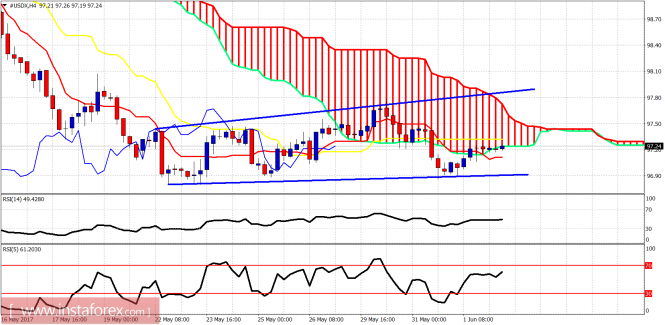
Ichimoku indicator analysis of USDX for June 2, 2017
The Dollar index remains above critical support at 97. Price held support yesterday and is bouncing towards short-term resistance. Trend remains bearish and there is still no confirmation of a trend change. We could see a trend reversal today after the NFP.
Blue lines - trading range The Dollar index is trying to get back inside the neutral trend zone of the Ichimoku cloud in the 4-hour chart. Resistance is here at 97.20-97.30. Next important resistance is at 97.50. A breakout and above the cloud could be a trend reversal signal.
Red line - resistance Green line - broken trend line support The Dollar index is at important weekly support. A bounce of this area is expected. The target is the broken green trend line or the downward sloping red trend line. I would not be bearish on the Dollar at current levels. I would prefer to short the Dollar after a strong bounce.
USDX managed to hold its structure above the support level of 96.90, as the bulls gained momentum across the board, but the gains are still limited. The 200 SMA at the H1 chart is still offering dynamic resistance in the short-term. The index might plummet below 96.90 to reach the support level of 96.25. MACD indicator remains at the positive territory.
H1 chart's resistance levels: 97.41 / 98.11 H1 chart's support levels: 96.90 / 96.25 Trading recommendations for today: Based on the H1 chart, place sell (short) orders only if the USD Index breaks with a bearish candlestick; the support level is at 96.90, take profit is at 96.25 and stop loss is at 97.56.
The index had a strong decline on Friday after the disappointing jobs data in the United States and it's now piercing the 96.90 level. The target is now placed to the downside around 96.25 and having in mind that USDX was trapped in a bearish consolidation, such scenario is feasible for the short-term. MACD indicator is turning negative and favoring the downside.
H1 chart's resistance levels: 97.41 / 98.11 H1 chart's support levels: 96.90 / 96.25 Trading recommendations for today: Based on the H1 chart, place sell (short) orders only if the USD Index breaks with a bearish candlestick; the support level is at 96.90, take profit is at 96.25 and stop loss is at 97.56.
Ichimoku indicator analysis of USDX for June 6, 2017
Remaining in a bearish trend and providing lower lows and lower highs, I continue to feel that the risk reward favors bulls rather than bears. As said in my previous posts, I prefer to be at least neutral if not bullish around 96-97 area.
Blue line - resistance The Dollar index broke out and below the trading range and has now 97 as resistance (once support). Trend remains bearish. Only a move above 97.30 will change short-term trend to bullish. I can see bullish divergence signals by the RSI and I continue to focus on a reversal signal.
Blue lines - bearish channel The weekly chart is ugly. Price has broken below the weekly Kumo (cloud) support and is inside a bearish channel. Channel support is at 96 and this is my next target and reversal area. I would then expect a reversal and back test towards cloud resistance at 97.85-98 at least.
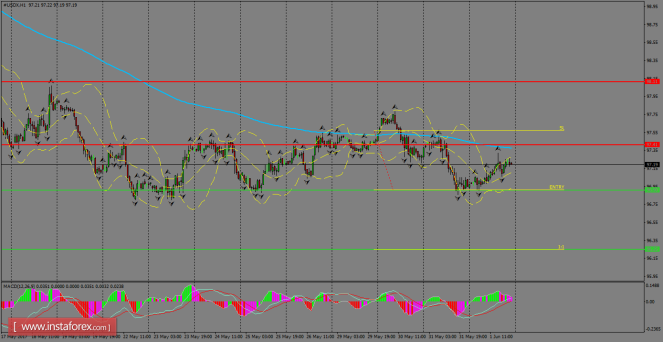
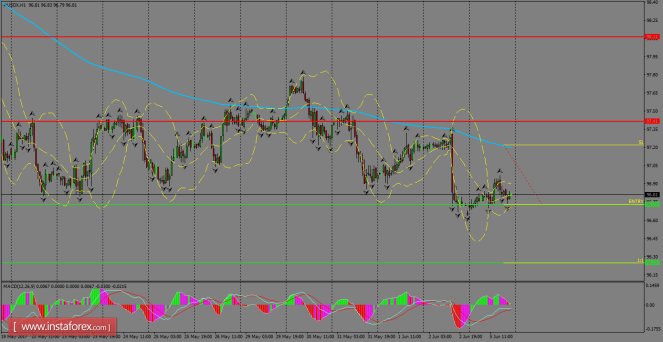
USDX remained supported on Monday, as the momentum wasn't enough to allow a breakout below the 96.73 level. That zone is the last hurdle before the 96.25 demand zone, while a rebound should produce another test of the 200 SMA at H1 chart. However, our immediate resistance is projected around 97.41. MACD indicator is turning flat, favoring a sideways market in a short-term basis.
H1 chart's resistance levels: 97.41 / 98.11 H1 chart's support levels: 96.73 / 96.25 Trading recommendations for today: Based on the H1 chart, place sell (short) orders only if the USD Index breaks with a bearish candlestick; the support level is at 96.73, take profit is at 96.25 and stop loss is at 97.22.
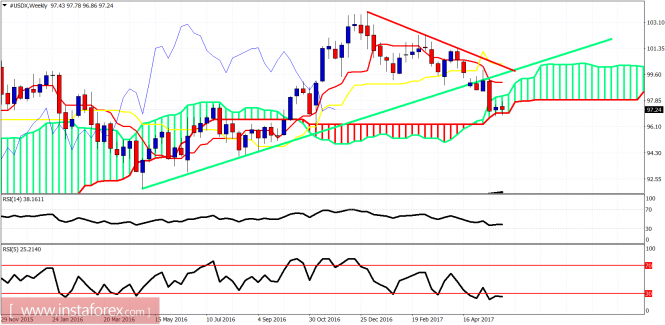
Ichimoku indicator analysis of USDX for June 7, 2017
The Dollar index remains in a bearish oversold trend diverging. As I have said in previous posts, I prefer to be at least neutral at current or lower levels if not bullish as I expect the Dollar index to make a strong bounce soon.
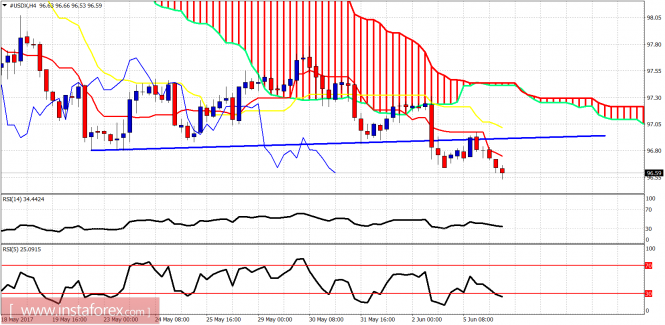
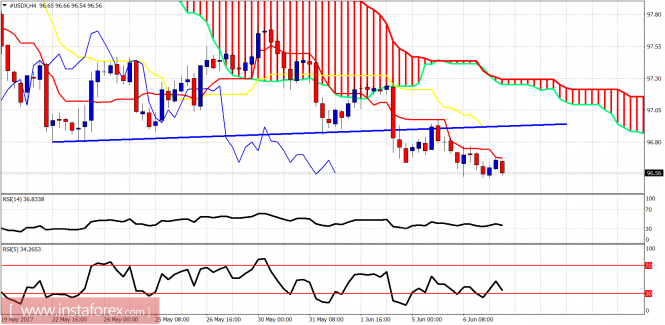
Blue line - resistance Price is making lower lows and lower highs in the 4-hour chart and trend is clearly bearish. Short-term resistance is at 96.70. A 4-hour close above it will open the way for a backtest of the broken support blue trend line at 96.95.
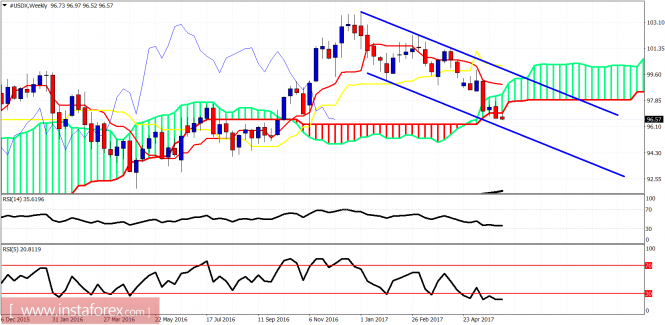
Blue lines - bearish channel The Dollar index weekly chart has broken below the weekly cloud. I expect price to reach the lower channel boundary around 96 and bounce towards 98 for a backtest of the broken weekly cloud. I prefer to look for short positions only after a bounce in the Dollar index.
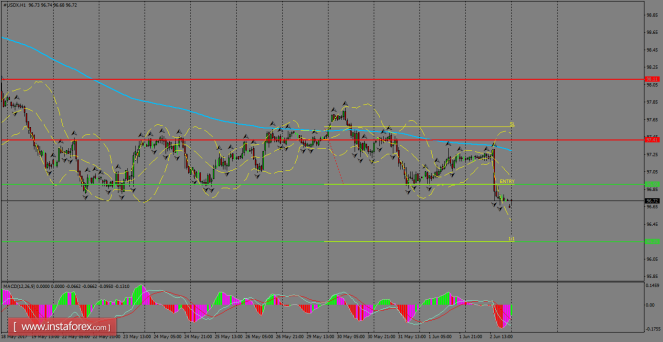
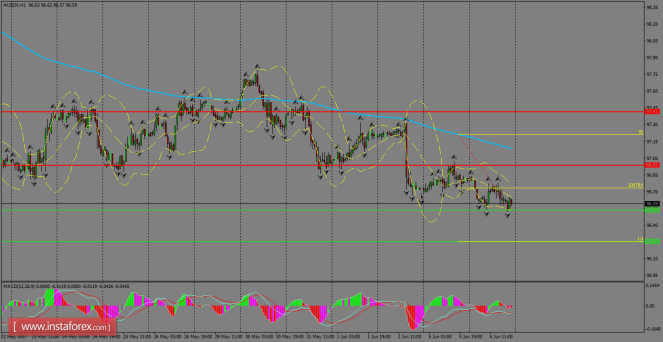
The index extended its losses across the markets, with a consolidation ongoing around the support level of 96.53, which is the last barrier before to reach the 96.25 zone. However, as long as USDX doesn't manage to break recent lows, it could be heading towards the 200 SMA at H1 chart around 97.00. MACD indicator remains flat, calling for more sideways.
H1 chart's resistance levels: 96.93 / 97.41 H1 chart's support levels: 96.53 / 96.25 Trading recommendations for today: Based on the H1 chart, place sell (short) orders only if the USD Index breaks with a bearish candlestick; the support level is at 96.53, take profit is at 96.25 and stop loss is at 97.21.