BTC USD 84,253.9 Gold USD 4,157.56
Time now: Jun 1, 12:00 AM

ForexTechnical Analysis(FxGlory.com)

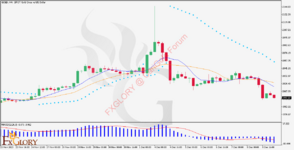
PLATINUM analysis for 08.12.2023


PlatinumH4.jpg


Time Zone: GMT +2
Time Frame: 4 Hours (H4)


Fundamental Analysis:


The Platinum vs. US Dollar (XPTUSD) pair reflects the dynamics between the precious metal platinum and the US currency. Factors influencing the price of platinum include industrial demand, particularly from the automotive sector for catalytic converters, and investment demand for platinum as a safe-haven asset. The US dollar's strength, influenced by Federal Reserve policies, inflation rates, and economic indicators, also plays a crucial role. With shifts in green technology potentially impacting platinum demand, alongside economic data releases from the US, the XPTUSD pair is sensitive to changes in both industrial outlook and currency strength.


Price Action:

The H4 timeframe shows that the XPTUSD has experienced volatility with an overall downward trend in the recent period. The price action has formed a series of lower highs and lower lows, indicating bearish sentiment. However, the most recent candles have shown a bullish reversal, with the price moving upwards sharply, suggesting a possible change in market sentiment or a retracement.


Key Technical Indicators:

Moving Averages:
The short-term moving average (MA) with a period of 9 has crossed above the longer-term MA with a period of 17, which may indicate a potential bullish trend reversal.

Parabolic SAR: The last dots of the Parabolic SAR are observed below the candles, supporting the recent bullish price movement.

MACD: The MACD histogram is below the baseline but shows diminishing bearish momentum, as the bars are becoming shorter, indicating a possible slowing of the downtrend.


Support and Resistance:

Resistance:
The recent peak before the downtrend can serve as a resistance level, which may be around the $950 mark.

Support: The lowest point in the current downtrend serves as a support level, potentially near the $880 level.


Conclusion and Consideration:

The XPTUSD pair on the H4 chart suggests a recent bullish reversal following a predominant downtrend. While the moving averages and Parabolic SAR indicate a potential change in trend, the MACD suggests caution as the downtrend may be slowing, not reversing. Traders should monitor the strength of the current bullish movement and consider the potential impact of upcoming fundamental factors. Setting stop-loss orders below the support level and taking profit near the resistance level may be prudent, keeping in mind the inherent risks associated with volatile markets.


Disclaimer: The provided analysis does not constitute investment advice. It is intended for informational purposes only, and traders should conduct their own research and risk assessment before making any trading decisions.


FXGlory
08.12.2023


FXGLORY.gif
 
GOLD analysis for 11.12.2023

1702268757750.png


Time Zone: GMT +2
Time Frame: 4 Hours (H4)


Fundamental Analysis:


Gold prices are influenced by a multitude of factors including global monetary policy, inflation expectations, and economic uncertainty. The precious metal is often viewed as a hedge against inflation and currency devaluation, making central bank actions such as interest rate changes particularly relevant. Additionally, geopolitical tensions and market volatility can drive investors towards gold as a safe-haven asset. It's important for traders to consider these fundamental aspects as they can significantly impact gold's price dynamics.


Price Action:

The H4 chart for GOLD indicates a downtrend, with the price action below both the short and long-term moving averages. Recent candles show a continuation of the bearish momentum, with the price making lower lows and lower highs. This suggests that sellers are currently in control of the market.


Key Technical Indicators:

Short MA (9 periods):
The short-term moving average has crossed below the long-term MA (17 periods), indicating a bearish trend.

Long MA (17 periods): The downtrend is further confirmed by the long MA, which is trending downwards and has been breached by the price.

MACD: The MACD histogram is in negative territory and the MACD line is below the signal line, reinforcing the bearish outlook.

Parabolic SAR: The dots are positioned above the candlesticks, which supports the continuation of the current downtrend.

Support and Resistance:

Resistance:
The most immediate resistance level appears to be near the recent swing high around the $2059 level, as indicated by the peak before the price drop. A secondary resistance level could be at the $2081 zone, where a significant price spike occurred, although it was not sustained.
Support: The nearest support level is identifiable at the $1932 level, where the price seems to have a consolidation or a slight rebound after a decline. If this level is breached, further support may be found around the $1910 level, aligning with previous price interactions.

Conclusion and Consideration:

The GOLD H4 chart suggests that the market is in a bearish phase, as evidenced by price action, moving average crossovers, and other technical indicators. Traders should remain cautious and consider the possibility of continued downward movement. It's important to monitor fundamental factors that could cause shifts in market sentiment, potentially leading to price reversals. As always, risk management strategies such as stop losses should be employed to protect against market volatility.


Disclaimer: This analysis is for informational purposes only and should not be taken as investment advice. Trading precious metals involves risk and should be approached with caution.


FXGlory
11.12.2023


1702268696480.gif
 

Attachments

GBPAUD analysis for 13.12.2023

1702443223711.jpeg


Time Zone: GMT +2
Time Frame: 4 Hours (H4)


Fundamental Analysis:


The GBP/AUD pair reflects the exchange rate between the British Pound (GBP) and the Australian Dollar (AUD). This pair is influenced by economic data releases, interest rate decisions from the Bank of England and the Reserve Bank of Australia, commodity prices (especially metals and minerals which Australia exports), and global risk sentiment. The GBP is affected by the UK's economic performance, Brexit-related news, and political stability, while the AUD is often swayed by Australia's trade balance, China's economic outlook, and trends in the commodity markets.


Price Action:

The chart exhibits a 4-hour time frame for the GBP/AUD pair. The candlesticks show alternating red and green bars, indicating a market experiencing fluctuations. The price seems to have been declining recently, suggesting a bearish sentiment.


Key Technical Indicators:

RSI (Relative Strength Index
The RSI indicator is near the mid-level, indicating neither overbought nor oversold conditions, signaling a neutral market momentum.

MA (15 Period Moving Average): In the context of the GBP/AUD H4 chart, if the MA line is trending downwards, it indicates a bearish trend over the last 15 periods. If prices are currently below the MA, this could reinforce the bearish signal. Conversely, if the MA is sloping upwards or prices are above the MA, it could suggest a bullish trend.


Support and Resistance:

Resistance:
The recent high points at around 1.92300 serve as potential resistance levels, where sellers might come in.

Support: The closest support around the price line lies at around 1.89700.

Conclusion and Consideration:

The GBP/AUD on the H4 timeframe may be showing a short-term downtrend. With a neutral RSI and a MACD that could indicate a weakening momentum, traders should be cautious, particularly around identified resistance levels where price reversals could occur. As economic conditions evolve, it's important to consider new data releases and geopolitical events that may affect the currency pair.


Disclaimer: We do not suggest any investment advice, and these analyses are just to increase the traders’ awareness but not a certain instruction for trading.

FXGlory
13.12.2023

1702443251803.gif
 
CHFJPY analysis for 14.12.2023

1702534652062.jpeg


Time Zone: GMT +2
Time Frame: 4 Hours (H4)


Fundamental Analysis:


The CHFJPY pair represents the exchange rate between the Swiss Franc and the Japanese Yen. Fundamental aspects that affect this currency pair include economic indicators from Switzerland and Japan, such as GDP growth rates, interest rate decisions by the Swiss National Bank and the Bank of Japan, and global risk sentiment. The Swiss Franc is often viewed as a safe-haven currency, which means it can appreciate during times of global economic uncertainty, while the Yen is influenced by Japan's economic policies and its role in global trade. Ongoing geopolitical events, trade relations, and market volatility are crucial elements to consider when analyzing CHFJPY.


Price Action:

Reviewing the H4 chart for CHFJPY, we observe a notable downtrend characterized by a series of lower highs and lower lows. The recent price action indicates a strong bearish momentum as the pair has moved sharply below previous support levels, turning them into resistance.


Key Technical Indicators:

Bollinger Bands:
The price is trading near the lower Bollinger Band, indicating that the market may be in an oversold state, suggesting a potential pause or bounce in the downtrend.

Parabolic SAR: The last three dots of the Parabolic SAR are above the candles, confirming the ongoing downtrend and suggesting that the bearish sentiment prevails.

MACD (Moving Average Convergence Divergence): The MACD histogram is below the baseline and decreasing, which indicates increasing bearish momentum. The separation between the MACD line and the signal line is widening, reinforcing the strength of the current bearish trend.


Support and Resistance:

Support:
The next significant support level is found at the previous low on the chart, which is around the 162.00 level.

Resistance: The recent pivot high now acts as resistance, around the 164.50 level.


Conclusion and Consideration:

The CHFJPY pair on the H4 timeframe is in a strong bearish trend, as indicated by the price action and confirmed by technical indicators such as the Bollinger Bands, Parabolic SAR, and MACD. Traders might look for potential short entries, keeping in mind the oversold conditions that could lead to a retracement. It is essential to monitor key economic releases from Switzerland and Japan, which could impact the currency pair. Risk management strategies should be employed, considering stop losses above recent resistance levels and taking profits near support zones.


Disclaimer: This analysis is for informational purposes only and should not be construed as investment advice. It's important to conduct your own research and consider your risk tolerance before trading.

FXGlory
14.12.2023

1702534683670.gif
 
GBPCAD analysis for 15.12.2023

1702622114806.jpeg


Time Zone: GMT +2
Time Frame: 4 Hours (H4)


Fundamental Analysis:


The GBPCAD pair reflects the exchange rate between the British Pound (GBP) and the Canadian Dollar (CAD). This currency pair is influenced by economic indicators from both the UK and Canada, including interest rate decisions by the Bank of England and the Bank of Canada, GDP growth rates, and trade balance data. Additionally, global oil prices significantly impact the CAD due to Canada's status as a major oil exporter. Traders should monitor economic releases and geopolitical events, as they can cause substantial volatility for this pair.

Price Action:

The H4 chart for GBPCAD suggests a period of consolidation within a defined range, following a recent downtrend. The price has been oscillating between the upper and lower bands of the Bollinger Bands, without a clear directional bias. The occurrence of several doji and spinning top candles indicates indecision among traders.

Key Technical Indicators:

Bollinger Bands:
The price is currently trading near the upper Bollinger Band, indicating a potential resistance level. The bands are moderately wide, suggesting medium volatility in the market.

R% (Williams Percent Range): The R% indicator is around -27.51, suggesting that the market is neither in overbought nor oversold territory, aligning with the current consolidation phase.

Volumes: The volume bars show fluctuations with some spikes, which could indicate potential interest at certain price levels. However, the overall volume does not show a clear trend.

Support and Resistance:

Support:
The lower Bollinger Band and recent lows around the 1.69335 level can be considered a support zone.

Resistance: The upper Bollinger Band and recent highs near the 1.72080 level act as short-term resistance.

Conclusion and Consideration:

The GBPCAD pair on the H4 timeframe is currently showing signs of consolidation with no strong directional movement. The Bollinger Bands indicate a medium-volatility environment, while the R% suggests a neutral market state. Traders should watch for a breakout from the Bollinger Bands for potential trading opportunities. With no clear overbought or oversold signals, maintaining a cautious approach with stop-loss orders around key support and resistance levels would be prudent. As always, staying updated with the latest economic news from both the UK and Canada is crucial for understanding the fundamental forces that could drive the next significant move in this pair.

Disclaimer: The provided analysis is for informational purposes only and should not be considered investment advice. Trading foreign exchange on margin carries a high level of risk and may not be suitable for all investors.

FXGlory
15.12.2023

1702622154849.gif
 
BCHUSD analysis for 18.12.2023


1702875639037.jpeg


Time Zone: GMT +2
Time Frame: 4 Hours (H4)

Fundamental Analysis:


Bitcoin Cash (BCHUSD) mirrors the market dynamics between Bitcoin Cash (BCH) and the US Dollar (USD). Fundamental influencers include network updates, adoption rates, and regulatory shifts within the crypto space, particularly policies affecting Bitcoin Cash. Additionally, the USD's strength, influenced by Federal Reserve policies and macroeconomic indicators such as inflation and employment data, can significantly impact BCHUSD's value. The crypto market sentiment, driven by investor reactions to global economic events and technological advancements in blockchain, is also a critical factor to watch.

Price Action:

The H4 chart for BCHUSD displays a short-term downtrend, with the price moving below both the short-term and long-term moving averages. After a substantial rise, the price action has been characterized by increased volatility, with the formation of several large bearish candles indicating a potential reversal or correction in the uptrend.

Key Technical Indicators:

Parabolic SAR:
The appearance of the last three dots above the candles suggests a bearish reversal, indicating a potential downtrend.

Moving Averages: The 9-period moving average crossing below the 17-period moving average while both lines trend downward is a bearish signal.

MACD: The MACD histogram is shortening towards the baseline, and the MACD line is close to crossing below the signal line, hinting at weakening bullish momentum.

Volumes: Trading volumes are showing fluctuation, with red bars indicating selling pressure which aligns with the bearish sentiment observed in the price action.


Support and Resistance:

Support:
The immediate support level is at the most recent swing low, which could be around the $212 mark.

Resistance: The recent swing high forms a resistance level, potentially near the $250 area.


Conclusion and Consideration:

In conclusion, BCHUSD on the H4 timeframe suggests a bearish bias in the short term, as indicated by the Parabolic SAR, bearish crossover of moving averages, and potential MACD crossover. The downward price action supports this view. Traders should watch for a potential continuation of the downtrend, but also be mindful of the key support level, which if held, could indicate a reversal or consolidation. It's essential to stay updated on fundamental developments that could affect investor sentiment and cause shifts in market dynamics. Risk management strategies such as stop-loss orders should be used to protect against unexpected market moves, particularly in the volatile cryptocurrency market.

Disclaimer: This analysis is for informational purposes only and does not constitute investment advice. Trading cryptocurrencies involves significant risk and can result in the loss of your invested capital. Always conduct your own research before making trading decisions.

FXGlory
18.12.2023


1702875676066.gif
 
Silver Market Analysis for 20.12.2023

1703045178477.jpeg


Time Zone: GMT +2
Time Frame: 4 Hours (H4)


Fundamental Analysis:


The silver market, much like its counterpart gold, is heavily influenced by a host of macroeconomic factors, including industrial demand, inflation rates, and the performance of major currencies. It's also sensitive to geopolitical tensions and economic policies that can sway investor sentiment towards safe-haven assets like precious metals.


Price Action:

The H4 chart for silver indicates a period of volatility with a recent uptick in prices, as evidenced by the green candlesticks surpassing the moving averages. However, the latest candles show a slight bearish retracement, which could signal a consolidation phase or a potential downturn in the market.


Key Technical Indicators:

Moving Averages:
A crossover is observed with the short-term moving average dipping below the longer-term moving average, typically a bearish signal, suggesting that the price may be entering a corrective phase.


MACD (Moving Average Convergence Divergence): The MACD line is above the signal line but showing signs of convergence, which could indicate slowing bullish momentum. The histogram reflects this with diminishing bullish bars.


Volume: There's been a noticeable decline in volume alongside the price retracement, which could imply a lack of conviction in the bearish movement, suggesting that the uptrend may still have some underlying strength.


Support and Resistance:

Support
: The nearest support level is located at around 23.40000.

Resistance: The previous peak forms a resistance level, placed at around 25.572970


Conclusion and Consideration:

While the silver market shows a potential short-term bearish signal through the MA crossover, the MACD and volume indicators suggest that the bullish trend may not be over. Traders should watch for whether the price can maintain above the support level or if it will break below, indicating a stronger bearish correction. Upcoming economic data and market news should be monitored to gauge potential shifts in sentiment. As always, employing prudent risk management strategies in this volatile market is advisable.


Disclaimer: This analysis is for informational purposes only and does not constitute investment advice. Trading in the silver market carries risks and may result in loss of capital. Investors should perform their own due diligence and consult with a financial advisor before engaging in any trading activities.

FXGlory
20.12.2023

1703045210715.gif
 
EURUSD Market Analysis for 21.12.2023

1703134005597.jpeg


Time Zone: GMT +2
Time Frame: 4 Hours (H4)


Fundamental Analysis:


Fundamental factors affecting this currency pair include economic indicators from the Eurozone and the United States, such as GDP growth rates, unemployment figures, interest rate decisions by the ECB and the Fed, and inflation data. Additionally, geopolitical events, trade relations, and political stability within both economies can lead to fluctuations in this pair. Amidst a global landscape marked by post-pandemic recovery challenges and shifting monetary policies, these fundamentals must be closely watched by investors.


Price Action:

The H4 chart for the EURUSD shows a period of recovery following a downward trend. The price action has formed a series of higher lows, which may indicate a reversal from the previous downtrend. This pattern suggests that buyers are gradually gaining ground. However, the price has not yet established a series of higher highs, which means that while there is buying interest, there is still some resistance to a full bullish reversal.


Key Technical Indicators:

Parabolic SAR:
The last ten dots of the Parabolic SAR are below the candles, signaling that the trend has shifted to bullish in the short term.

RSI: The RSI is hovering around 55, indicating neither overbought nor oversold conditions, suggesting a moderate momentum that is neither strongly bullish nor bearish.


Volume: The volume shows fluctuations with some spikes, suggesting that there are periods of higher trading activity which sometimes coincide with price movements.


Support and Resistance:

Support:
The recent swing low around 1.0780 serves as the current support level.

Resistance: The previous swing high near 1.0980 acts as the immediate resistance level.


Conclusion and Consideration:

The EURUSD pair on the H4 timeframe is showing signs of a potential reversal from its previous downtrend, as indicated by the bullish signals from the Parabolic SAR and the moderately positive RSI. The consistent volumes suggest a stable interest in the market. Traders should watch for a confirmed establishment of higher highs to validate a bullish trend. It is also important to stay updated on key economic releases and policy decisions that may affect the pair. As always, maintaining proper risk management strategies, including the use of stop losses and take profit orders around key support and resistance levels, is crucial for trading.


Disclaimer: This analysis is for informational purposes only and does not constitute investment advice. Trading in the silver market carries risks and may result in loss of capital. Investors should perform their own due diligence and consult with a financial advisor before engaging in any trading activities.

FXGlory
21.12.2023

1703134034143.gif
 
USDCHF analysis for 22.12.2023

1703218629849.jpeg


Time Zone: GMT +2
Time Frame: 4 Hours (H4)

Fundamental Analysis:


The USDCHF pair, representing the exchange rate between the U.S. Dollar and the Swiss Franc, is strongly influenced by both U.S. and Swiss economic indicators, monetary policies, and global risk sentiment. In particular, the U.S. Federal Reserve's interest rate decisions, economic data releases such as employment and inflation reports, and geopolitical tensions significantly affect the USD side of the pair. For the Swiss Franc, the Swiss National Bank's policies, Switzerland's economic health, and its role as a "safe haven" currency during times of market uncertainty are key considerations. Traders should monitor upcoming data releases and central bank communications for insights into the pair's movements.

Price Action:

On the H4 timeframe for USDCHF, the price action shows a downward trend, with a series of lower highs and lower lows. The recent candles are bearish, indicating selling pressure. The price is currently below the key moving averages, which act as dynamic resistance levels, confirming the bearish bias in the market.

Key Technical Indicators:

Parabolic SAR:
The placement of the last dots of the Parabolic SAR above the candles signals a bearish trend, suggesting that the downward momentum is currently strong.

RSI: The RSI is below the 50 level, indicating bearish momentum and no immediate signs of being oversold, which may provide room for further downside.

MACD: The MACD histogram is in the negative territory, and the signal line is above the MACD line, reinforcing the bearish market sentiment.

Bollinger Bands: The price is operating near the lower Bollinger Band, indicating that the price is in a potentially oversold region, which could lead to a temporary pullback.

Support and Resistance:

Support:
The next significant support level is found at the recent low around 0.88520.

Resistance: The immediate resistance level is the previous swing high, which can be observed near the 0.89300 level.

Conclusion and Consideration:

The technical analysis of the USDCHF on the H4 timeframe suggests a continued bearish trend, backed by the current price action and confirmed by the key technical indicators. However, with the price nearing the lower Bollinger Band, there could be potential for a retrace or consolidation in the near term. Traders should remain cautious, considering the possibility of sharp moves in reaction to high-impact news releases and central bank statements. It's advisable to use proper risk management strategies and to be prepared for volatility around economic data releases.

Disclaimer: This analysis is for informational purposes only and should not be construed as financial advice. Trading involves significant risk, and it is important to conduct your own research and consult with a financial advisor before making any trading decisions.

FXGlory
22.12.2023

1703218662347.gif
 
AUDCAD analysis for 27.12.2023

1703651891676.jpeg


Time Zone: GMT +2

Time Frame: 4 Hours (H4)


Fundamental Analysis:


The Australian Dollar (AUD) and Canadian Dollar (CAD) are both commodity currencies, and their exchange rate can be influenced by the prices of natural resources such as metals, oil, and gas. Australia's economic indicators, such as GDP growth, interest rate changes, employment rates, and commodity exports, play a significant role in the AUD's value. Similarly, Canada's economy is affected by its oil exports, making the CAD sensitive to oil price fluctuations. Traders should pay attention to these factors along with the overall global economic sentiment and risk appetite in the markets.


Price Action:

On the H4 chart, the price action is currently below the Ichimoku cloud, indicating a potential bearish sentiment or downward trend. The base line (Kijun-sen) and conversion line (Tenkan-sen) are positioned below the candlesticks, which typically signals a bearish trend but may also suggest a recent bullish price correction since they are below the price.


Key Technical Indicators:


Ichimoku Cloud:


The last cloud being red suggests the trend was recently bearish. If prices are moving above the base and conversion lines while they are below the candles, it may signal a potential trend reversal or correction.

MACD:

The MACD line above the signal bars and green histogram bars indicate bullish momentum in the short term. However, the overall bearish trend indicated by the Ichimoku cloud may not have fully reversed.

Support and Resistance:


Resistance:


Resistance might be found at the bottom edge of the Ichimoku cloud, where the price would need to break through to confirm a change in trend.

Support:

Support may be located at the recent swing lows or at a level where the base and conversion lines could provide dynamic support.

Conclusion and Consideration:

The technical indicators provide mixed signals; the Ichimoku cloud suggests a bearish trend, while the MACD indicates bullish momentum. Traders should watch for a potential bullish breakout if the price action moves above the cloud and the base and conversion lines cross above the candlesticks. Conversely, if prices fail to breach the cloud, it may resume the bearish trend. Economic releases relevant to both the Australian and Canadian economies should be monitored for their potential impact on this currency pair.


Disclaimer: This analysis is for educational purposes only and is not investment advice. Trading in the forex market involves risk, and you should conduct your own research or consult a financial advisor before making any trading decisions.

FXGlory
27.12.2023


1703651918618.gif
 

Live Forex Chart

Currency
Rates
EUR / USD
1.13407
USD / JPY
157.347
GBP / USD
1.32242
USD / CHF
0.83377
USD / CAD
1.41828
EUR / JPY
178.590
AUD / USD
0.69900
Back
Top
Log in Register