BTC USD 82,963.6 Gold USD 4,158.47
Time now: Jun 1, 12:00 AM

ForexTechnical Analysis(FxGlory.com)

EURNZD analysis for 08.11.2023
1699417350654.jpeg


Time Zone: GMT +2
Time Frame: 4 Hours (H4)

Fundamental Analysis:


The Euro to New Zealand Dollar (EURNZD) exchange rate is influenced by a variety of economic factors from both the Eurozone and New Zealand. The Eurozone’s performance is tracked through interest rate decisions by the European Central Bank, GDP growth rates, inflation, and the region's political stability and economic recovery. In New Zealand, an export-driven economy, commodity prices, especially for dairy and agricultural goods, play a pivotal role. Both currencies are also affected by global financial conditions, market risk sentiment, and international trade tensions.

Price Action:

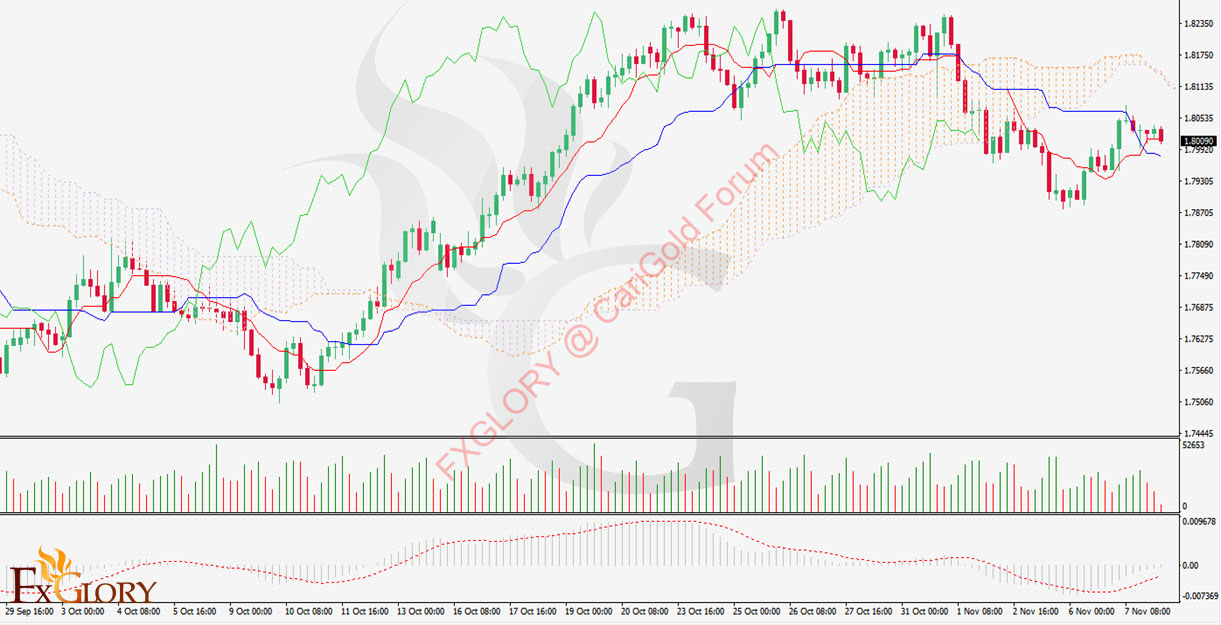
The H4 chart reveals a bullish trend for the EURNZD pair, with the price positioned above the Ichimoku Cloud, indicating a potential bullish momentum shift. The recent pattern of higher lows forms an ascending trend that suggests a recovery from previous lows and a current uptrend.


Key Technical Indicators:

Ichimoku Cloud:
A bullish signal is present, with the Tenkan-sen (blue line) crossing above the Kijun-sen (red line), pointing to an upward momentum.

Volumes: Trading volumes show a mix of activity with spikes that typically indicate significant price movements and active market participation.

MACD (Moving Average Convergence Divergence): The MACD line is above the signal line, signaling bullish momentum. However, a note of caution is due to the convergence that may signal a potential slowdown in the bullish pace.


Support and Resistance:

Resistance:
The upper border of the Ichimoku Cloud may act as immediate resistance, along with a previous local high near 1.8053 level.

Support: The Kijun-sen (part of the Ichimoku Cloud) may offer near-term support, with further support potentially at the latest swing low around the 1.7900 level.


Conclusion and Consideration:

The short-term technical outlook for the EURNZD pair is cautiously optimistic, supported by the price action above the Ichimoku Cloud and the bullish crossover signaled by the MACD. While the bullish trend is evident, traders should monitor for signs of weakening momentum as suggested by the MACD's convergence. It is vital to consider the impact of economic indicators and global market sentiment on the currency pair. Traders should implement risk management strategies, including setting stop-loss orders and taking profits at critical levels, and stay informed on economic developments that could influence the pair's movement.

Disclaimer: We do not suggest any investment advice, and these analyses are just to increase the traders’ awareness but not a certain instruction for trading.


FXGlory
08.11.2023


1699417391128.gif
 
GBPNZD analysis for 09.11.2023


GBPNZDH4.jpg


Time Zone: GMT +2
Time Frame: 4 Hours (H4)


Fundamental Analysis:

The GBPNZD currency pair reflects the exchange rate between the British Pound (GBP) and the New Zealand Dollar (NZD). Factors that may affect this pair include differences in the economic outlook and monetary policies of the Bank of England and the Reserve Bank of New Zealand, trade relations between the United Kingdom and New Zealand, and global commodity prices, particularly dairy products which are a significant export of New Zealand. Additionally, risk sentiment among investors, driven by geopolitical events and global economic performance, can cause fluctuations in this currency pair.


Price Action:
The H4 timeframe shows that the GBPNZD pair has been experiencing some volatility with a recent downtrend followed by a modest recovery. After a period of decline, the price has moved above the Alligator's jaws, suggesting a potential shift in momentum. The latest candles are forming above the moving averages, indicating that the bulls may be attempting to regain control of the market direction.


Key Technical Indicators:
RSI (Relative Strength Index):
The RSI is just above the midline at 57, suggesting that the momentum is slightly more in favor of the buyers but not yet indicating overbought conditions.

Volumes: The volume bars show some spikes, which correspond with large price movements, signaling active market participation and potential shifts in market sentiment at those times.

Alligator: The Alligator lines have started to intertwine, and the price is currently above these lines, hinting at a possible emerging bullish phase if the price continues to stay above the Alligator’s jaws.


Support and Resistance:
Resistance:
The previous high near the 2.0840 level may act as resistance in the short term.

Support: A support zone can be identified around the 2.0573 level, where the price has recently bounced, showing some buying interest.


Conclusion and Consideration:
The GBPNZD pair on the H4 chart suggests a market trying to find its footing after a period of bearish movement, with potential early signs of a bullish correction. The RSI and Alligator indicators provide mild bullish signals, while volume analysis indicates engagement by traders during significant moves. Traders should watch for the ability of the price to stay above the Alligator's jaws and the RSI to remain stable for further bullish confirmation. Keeping an eye on economic announcements from both the UK and New Zealand is crucial, as they could significantly impact the pair's movement. Caution should be maintained, and risk management strategies, including stop-loss orders, should be in place to protect against sudden reversals.


Disclaimer: We do not suggest any investment advice, and these analyses are just to increase the traders’ awareness but not a certain instruction for trading.


FXGlory
09.11.2023


FXGLORY.gif
 
LTCUSD analysis 10.11.2023


LTCUSDH4.jpg


Time Zone: GMT +2
Time Frame: 4 Hours (H4)


Fundamental Analysis:
The LTCUSD pairing is indicative of Litecoin's relative value to the US Dollar. Fundamental influences on Litecoin include technological advancements, adoption rates, and competitive positioning in the cryptocurrency market. Regulatory news and macroeconomic factors such as inflation rates and central bank policies that impact the US Dollar also have an indirect effect on LTCUSD. As Litecoin often follows Bitcoin's trend, it's important to consider the latter's performance for potential impact.


Price Action:
On the H4 timeframe, LTCUSD shows a bullish trend with the price having recently experienced a pullback. The uptrend is characterized by a sequence of higher highs and higher lows over the examined period, indicating a positive market sentiment toward Litecoin. The recent candles suggest a potential consolidation phase following the uptrend.


Key Technical Indicators:
Bollinger Bands:
The price has recently pulled back to the upper Bollinger Band, potentially signaling a period of consolidation or a minor retracement within the bullish trend.

Stochastic: The Stochastic indicator is descending towards the oversold territory, suggesting that the current retracement may continue before the upward trend resumes.

RSI (Relative Strength Index): The RSI is hovering just below the mid-point at around 48, indicating a slight loss of bullish momentum but not signaling a definitive downtrend.

Parabolic SAR: The last two dots have appeared above the price bars, indicating a potential shift to a downtrend or a more pronounced pullback within the broader bullish context.


Support and Resistance:
Support:
Immediate support is found near the $70.50 level, corresponding with the recent lows and the middle Bollinger Band.

Resistance: The recent high near $75.90 acts as the immediate resistance level and coincides with the upper Bollinger Band.


Conclusion and Consideration:
The LTCUSD pair has been in a bullish phase but is currently showing signs of a potential trend reversal or deeper pullback, as indicated by the Parabolic SAR and the descent of the Stochastic indicator. While the RSI suggests that the uptrend may not be completely over, traders should be cautious and consider the possibility of a short-term bearish movement. Monitoring upcoming fundamental news and market sentiment will be essential in determining if the bullish trend will resume or if a reversal is underway. Proper risk management and preparedness for volatility should be a priority for traders in this market.


Disclaimer: This technical analysis is for informational purposes only and should not be taken as investment advice. Trading cryptocurrencies carries a high level of risk and may not be suitable for all investors. It is recommended to consult a financial advisor and conduct thorough research before engaging in any trading activities.


FXGlory
10.11.2023


FXGLORY.gif
 
EURUSD analysis for 13.11.2023


11-13-2023.jpg


Time Zone: GMT +2
Time Frame: 4 Hours (H4)


Fundamental Analysis:


The EURUSD pair represents the exchange rate between the Euro (EUR) and the US Dollar (USD). Factors affecting this currency pair include key economic indicators from the Eurozone and the United States, such as interest rate decisions by the European Central Bank and the Federal Reserve, inflation rates, unemployment data, and manufacturing output. Additionally, geopolitical events, trade relations, and market sentiment toward global economic health significantly impact EURUSD. The pair is also influenced by the monetary policies of both central banks, which are currently navigating the post-pandemic economic recovery.


Price Action:

The H4 chart for EURUSD shows a series of higher lows along with higher highs, indicating an uptrend. The presence of a descending trendline that has been breached suggests a potential reversal of the previous bearish sentiment to a bullish outlook.


Key Technical Indicators:

RSI (Relative Strength Index):
The RSI is near the 50 level, indicating a balance between buying and selling pressures. It does not show an overbought or oversold market, which suggests that there is room for the trend to continue either way.

Volumes: The volume is not visible in the provided chart, so we cannot assess its impact on current price action.

MACD (Moving Average Convergence Divergence): The MACD indicator is not included in the provided chart, so its analysis is not applicable here.


Support and Resistance:

Resistance:
The recent swing high near the 1.07525 level may act as a resistance level.

Support: The Fibonacci retracement levels, particularly around the 38.2% level at 1.06259, could serve as support, as they often coincide with key levels of buying interest.


Conclusion and Consideration:

The EURUSD pair on the H4 timeframe suggests an uptrend as indicated by the pattern of higher highs and higher lows. The breach of the descending trendline may also signal a bullish momentum. However, traders should monitor key fundamental factors from both the Eurozone and the United States, as they could greatly affect the direction of the pair. The RSI suggests a neutral market, providing no clear overbought or oversold signals. Traders may consider opportunities to enter long positions on pullbacks to significant Fibonacci levels, with stop losses set below key support levels to manage risk. It is also prudent to watch for price action near the recent swing high, as it may serve as a short-term resistance level.


Disclaimer: We do not suggest any investment advice, and these analyses are just to increase the traders’ awareness but not a certain instruction for trading.


FXGlory
13.11.2023


FXGLORY.gif
 
AUDCAD analysis for 14.11.2023


AUDCAD.jpg


Time Zone: GMT +2
Time Frame: 4 Hours (H4)


Fundamental Analysis:


The AUDCAD pair represents the exchange rate between the Australian Dollar (AUD) and the Canadian Dollar (CAD). Factors influencing this currency pair often include economic indicators from Australia and Canada, such as GDP growth rates, interest rate decisions by the Reserve Bank of Australia and the Bank of Canada, commodity prices (especially as both economies are commodity-export-driven), and trade balance data. Additionally, global risk sentiment and geopolitical events can have a notable impact, as the AUD is often seen as a riskier asset, while the CAD is closely tied to oil prices.


Price Action:

The H4 chart for AUDCAD illustrates a price consolidation pattern, with the pair trading within a symmetrical triangle, indicating indecision in the market. The currency pair appears to be coiling for a breakout, which could dictate the next significant move.


Key Technical Indicators:

RSI (Relative Strength Index):
The RSI is hovering just below the midpoint at around 45, indicating a slight bearish momentum without being in the oversold territory, suggesting that there might be more room for downside movement.

Bollinger Bands: The price is currently near the middle Bollinger Band. A breakout from the Bollinger Bands could suggest a potential trend acceleration in the direction of the breakout.


Support and Resistance:

Resistance:
The recent swing high near the 0.88060 level may act as a resistance level.

Support: The closest support around the price line lies at around 0.87620.


Conclusion and Consideration:

The AUDCAD pair on the H4 timeframe is showing a period of consolidation, with the symmetrical triangle pattern suggesting a balance between buyers and sellers. Traders should keep an eye on a breakout from this pattern for directional cues. The RSI indicates neither overbought nor oversold conditions, allowing for a potential move in either direction. A breakout above the triangle and the upper Bollinger Band could signal a bullish move, while a drop below the triangle and the lower Bollinger Band might indicate bearish momentum. Monitoring upcoming economic data releases from both countries will be crucial, as these may trigger the breakout and set the pair's direction. Investors should also consider global economic trends and commodity prices when analyzing AUDCAD, given their influence on both currencies.


Disclaimer: We do not suggest any investment advice, and these analyses are just to increase the traders’ awareness but not a certain instruction for trading.


FXGlory
14.11.2023

FXGLORY-CRYPTO.gif
 
BCHUSD analysis for 16.11.2023

1700133215738.png


Time Zone: GMT +2
Time Frame: 4 Hours (H4)


Fundamental Analysis:


The BCHUSD pair denotes the exchange rate between Bitcoin Cash (BCH) and the US Dollar (USD). Fundamentals affecting this pair include Bitcoin Cash's adoption rate, technological updates, and scalability solutions. Additionally, investor sentiment towards Bitcoin Cash as an alternative to Bitcoin, regulatory announcements regarding cryptocurrency, and economic indicators from the US, such as interest rate decisions and inflation figures, could significantly impact this trading pair. As the cryptocurrency market remains sensitive to regulatory and technological changes, staying informed on these aspects is crucial for traders.

Price Action:

The BCHUSD H4 chart shows a period of consolidation followed by a bullish breakout. The recent candles indicate a surge in buying pressure, pushing the price above previous consolidation zones. This suggests an uptrend with potential for continuation if the bullish sentiment persists.


Key Technical Indicators:

Bollinger Bands:
The price has broken above the upper Bollinger Band, indicating a strong upward move that may be considered overextended in the short term.

RSI (Relative Strength Index): The RSI is trending upwards, currently above the 50 level, which indicates the momentum has shifted from neutral to bullish.

William's Percentage Range: The indicator is near the -20 level, which often signifies overbought conditions; however, in strong trends, the price can remain in this territory for an extended period.

Support and Resistance:

Support:
The previous consolidation range of around $225 acts as a support level.

Resistance: The next significant resistance level can be expected near the $250 mark, where the price has shown reactions in the past.

Conclusion and Consideration:

The BCHUSD chart on the H4 timeframe displays a bullish breakout from a consolidation phase, with indicators supporting the continuation of the uptrend. However, the proximity to overbought levels on both the Bollinger Bands and William's Percentage Range suggests caution for potential pullbacks. Traders should watch for sustained trading above the upper Bollinger Band and for the RSI to remain above 50 to confirm bullish momentum, while also being mindful of key support and resistance levels for risk management.


Disclaimer: This analysis is for informational purposes only and should not be construed as investment advice. Traders should conduct their own research and consider their risk tolerance before trading.


FXGlory
16.11.2023
1700133249177.gif
 
USDZAR analysis for 17.11.2023

1700194106925.png

Time Zone: GMT +2

Time Frame: 4 Hours (H4)


Fundamental Analysis:


The USDZAR pair, representing the exchange rate between the US Dollar and the South African Rand, is influenced by the economic policies and political stability of both nations. Factors such as the US's interest rate decisions, economic data, and global market sentiment play a vital role in the USD's strength. For the ZAR, commodity prices, particularly precious metals that South Africa exports, and domestic economic indicators significantly impact its performance. With emerging market currencies often sensitive to risk sentiment, global economic conditions and investor confidence can lead to heightened volatility for the pair.


Price Action:

On the H4 chart, USDZAR has recently shown a downward trend, indicated by a series of lower highs and lower lows. However, the latest price action suggests a potential reversal or pullback, with recent candles closing above the preceding ones and a break in the previous pattern of declines.


Key Technical Indicators:

Parabolic SAR:
The last three dots appearing below the candles suggest a potential trend reversal from bearish to bullish.

MACD: The MACD histogram is below the zero line, but the narrowing gap between the MACD and signal lines may indicate weakening bearish momentum.

Volumes: The presence of higher volumes during the recent price decline points to strong bearish sentiment, but any continued increase in volume could support a reversal if it accompanies price increases.

Bollinger Bands: The price touching the lower Bollinger Band could mean the market is oversold, which sometimes precedes a price correction or reversal.


Support and Resistance:

Resistance:
Immediate resistance might be found near the recent high around 18.5000.

Support: A significant level of support lies at the recent low near 18.0000, which could be a psychological threshold for the market.


Conclusion and Consideration:

The H4 chart of USDZAR suggests that while the previous trend was bearish, there are signs of a potential reversal, as indicated by the Parabolic SAR. However, the bearish MACD indicates that caution is warranted. Any trading strategy should be flexible enough to account for a reversal or continuation of the trend, with close attention paid to fundamental factors affecting both the USD and ZAR. Risk management, including the use of stop losses and take-profit orders near identified support and resistance levels, remains crucial.

Disclaimer: This analysis is for informational purposes only and does not constitute investment advice. Traders should always perform their own research and consider their risk tolerance before entering any trades.

FXGlory
17.11.2023


1700194134896.gif
 
LTCUSD analysis for 20.11.2023


LTCUSDH4.jpg


Time Zone: GMT +2
Time Frame: 4 Hours (H4)


Fundamental Analysis:


The LTCUSD pair signifies the value of Litecoin (LTC) in terms of US dollars. Fundamental factors influencing LTC include adoption trends, technological advancements such as the implementation of MimbleWimble for privacy and scalability, and overall market sentiment towards altcoins. External influences like regulatory news, economic indicators from the US, and Bitcoin's market movements can also greatly affect LTCUSD. Given the volatility of the crypto market, these factors can lead to significant price swings.


Price Action:

The LTCUSD chart on the H4 timeframe indicates a volatility contraction pattern, as evidenced by the Bollinger Bands narrowing, followed by a slight downturn in recent sessions. The price action is currently within the lower half of the Bollinger Band range, showing a short-term bearish bias.


Key Technical Indicators:

Bollinger Bands:
The price is testing the lower Bollinger Band, hinting at a potential short-term oversold condition or the beginning of a bearish trend.

Parabolic SAR: The dots are above the price, which suggests a downtrend is currently in place.

Volumes: There is a visible increase in volume during the downward price bars, indicating a stronger bearish sentiment.

MACD: The MACD line is below the signal line and approaching negative territory, which supports the bearish momentum seen in the price action.


Support and Resistance:

Support:
The nearest support level is at the $58 area where previous price action showed consolidation.

Resistance: The resistance is likely to be at the upper Bollinger Band, around the $74 mark, where the price previously peaked.


Conclusion and Consideration:

The technical analysis of LTCUSD on the H4 chart suggests a bearish outlook in the short term, with indicators like the Bollinger Bands and Parabolic SAR supporting this view. The increase in volume on down bars and the MACD's position below the signal line reinforce the strength of the current downtrend. Traders should look for potential reversal signals near the support level or a continuation of the trend if the price fails to rally. It's important to monitor for any fundamental changes that could affect market sentiment and lead to a shift in price direction.


Disclaimer: This analysis is for informational purposes only and should not be construed as investment advice. Traders should conduct their own research and consider their risk tolerance before trading.


FXGlory
20.11.2023


FXGLORY.gif
 
Last edited:
BTCUSD analysis for 21.11.2023


BTCUSDH4.jpg


Time Zone: GMT +2
Time Frame: 4 Hours (H4)


Fundamental Analysis:


The BTCUSD pair represents the exchange rate between Bitcoin (BTC) and the US Dollar (USD). Factors influencing this cryptocurrency often include global economic sentiment, regulatory news concerning cryptocurrency, technological advancements within the blockchain space, and shifts in investor sentiment towards riskier assets. In particular, Bitcoin's price is sensitive to changes in regulatory environments, updates or forks in the blockchain technology, and the level of adoption by consumers and businesses.


Price Action:

The chart provided appears to represent an H4 (4-hour) time frame for BTCUSD. The price action shows a series of green and red candles, indicating a volatile market with frequent price changes. The recent price trend shows an upward trajectory, which suggests a bullish outlook in the short term.


Key Technical Indicators:

RSI (Relative Strength Index):
The RSI is indicating a value above the midpoint but below the overbought threshold, which points to bullish momentum that is not yet exhausted.

MACD (Moving Average Convergence Divergence): The MACD line is above the signal line and increasing, which typically suggests that the bullish momentum is strengthening.

Stochastic Oscillator: The Stochastics are in the upper region but not in overbought territory, which aligns with a strong but not overextended uptrend.


Support and Resistance:

Resistance:
The recent high points at around 37950.00 serve as potential resistance levels, where sellers might come in.

Support: The closest support around the price line lies at around 36500.00


Conclusion and Consideration:

The BTCUSD pair on the H4 timeframe shows a bullish price action with an ascending trend. The RSI suggests that there is still room for upward movement before the asset becomes overbought. The positive divergence in the MACD indicates strengthening momentum. However, traders should be cautious of potential resistance levels where the price may face sell-offs. As Bitcoin is a highly volatile asset influenced by numerous unpredictable factors, traders should also keep abreast of news related to cryptocurrency regulation and market sentiment, which can cause sudden price movements. Investors should consider diversification and risk management strategies when trading in cryptocurrencies due to their inherent volatility.


Disclaimer: We do not suggest any investment advice, and these analyses are just to increase the traders’ awareness but not a certain instruction for trading.


FXGlory
21.11.2023


FXGLORY.gif
 
EURUSD analysis 22.11.2023

1700625933509.png

Time Zone: GMT +2

Time Frame: 4 Hours (H4)


Fundamental Analysis:

In the EUR/USD currency pair, a technical analysis reveals some interesting insights. The Ichimoku cloud indicator shows that the candles are currently trading above the cloud, suggesting a potential bullish bias. However, it's worth noting that both the base and conversion lines are positioned below the candles, indicating that while there might be some short-term bullish momentum, the longer-term trend may still have a bearish undertone. The Relative Strength Index (RSI) stands at 57, indicating a relatively neutral position. It suggests that the market is not significantly overbought or oversold at this point, which could signify a period of consolidation or indecision among traders. In the Moving Average Convergence Divergence (MACD) indicator, the MACD line is observed moving closer to the histogram bar. This convergence could signal a potential shift in momentum. Traders often look for crossovers or divergences between the MACD line and the signal line to identify potential trend changes. In this case, the proximity of the MACD line to the histogram may indicate that the market is approaching a point of decision.
It's advisable to consider fundamental factors that may impact the EUR/USD pair to make well-informed trading decisions.


Price Action:

In the EUR/USD currency pair, the price action analysis reveals several noteworthy observations. Over the provided timeframe, the price has displayed a series of price movements and patterns. It is essential to examine these patterns to gain insights into potential market direction.


Key Technical Indicators:

Various technical indicators can provide valuable information about the EUR/USD pair's current status. Analyzing these indicators can help traders make informed decisions and gauge the market's underlying dynamics.


Support and Resistance:

Resistance:
The area around 1.09500 has been a strong resistance point..

Support: Around the 1.05500 mark is where the price has found consistent support, acting as a base on several instances.


Volume Analysis:

Analyzing trading volume can provide important clues about market sentiment. Volume spikes or patterns can indicate increased interest or activity in the market, which may lead to significant price movements. Understanding volume dynamics is essential for assessing the strength of trends and potential reversals.


Conclusion and Consideration:

In conclusion, a comprehensive analysis of the EUR/USD currency pair incorporates various factors, including price action, key technical indicators, support and resistance levels, and volume analysis. By considering all these aspects, traders can make well-informed decisions and better navigate the complexities of the forex market. It's important to monitor these elements continually and adapt strategies accordingly to stay ahead in the ever-changing forex landscape.

Disclaimer: We do not suggest any investment advice, and these analyses are just to increase the traders’ awareness but not a certain instruction for trading.

FXGlory
22.11.2023


1700625959098.gif
 

Latest Posts

Live Forex Chart

Currency
Rates
EUR / USD
1.13355
USD / JPY
157.579
GBP / USD
1.32105
USD / CHF
0.83415
USD / CAD
1.41934
EUR / JPY
178.538
AUD / USD
0.69786
Back
Top
Log in Register