BTC USD 83,958.0 Gold USD 4,141.07
Time now: Jun 1, 12:00 AM

Forex daily News FBS

5 important events this week will bring us!

More at: http://bit.ly/2WVIrCI

24.06.2019

Speech by the Fed chair Jerome Powell (Tue, 20:00 MT (17:00 GMT time)) – After the dovish Federal Reserve, it would be interesting to hear the fresh comments by Jerome Powell.

RBNZ rate statement (Wed, 5:00 MT (2:00 GMT time)) – The Reserve bank of New Zealand will keep its interest rate on hold this time, but we will pay attention to the hints on the future changes to its monetary policy.

US final GDP growth (Thu, 15:30 MT (12:30 GMT time)) – According to the forecasts, the level of final GDP growth for the United States will advance by 3.1%. Higher figures will be supportive for the USD.

G20 meetings (Friday-Saturday) – The event is highly important as US president Donald Trump and Chinese President Xi Jinping are expected to meet there to discuss trade issues. The positive outcome of the meeting will set the risk mood in the market.

Canadian GDP growth (Fri, 15:30 MT (12:30 GMT) – The indicator is expected to increase by 0.2%. If the actual figures are higher, the Canadian dollar will rise.

Hot news:

As the market patiently anticipates the meeting between the US and Chinese presidents during the G20 Summit, the risk sentiment in the market has got softer on the comments by the Chinese Commerce Ministry. According to his words, both countries should be willing to make compromises.

After the victory of the opposition party in Istanbul mayor election, the Turkish lira has strengthened. This is a big hit to Erdogan’s ruling party.

The price for Bitcoin has tested the levels above $11,000 during the weekend.

US Secretary of State Mike Pompeo promised significant sanctions on Iran soon. It pushed the oil prices higher.

hJKxh_CBLjNFe5G6_640x320_q80v3.jpg
 
The GDP growth may push the USD up

More at: http://bit.ly/31YRvKC

25.06.2019

The United States will release the level of final GDP growth on June 27, at 15:30 MT.

This indicator is the broadest measure of economic activity, that is why traders pay high attention to it. Last time it came out lower than the expectations (2.2% vs. 2.4%). The negative data raised concerns over the slowdown of the US economy and was one of the reasons behind the projections of the rate cut by the Fed. As a result, the USD weakened. However, this time the figures may lead to a different outcome.

• If the actual level of GDP growth is higher than the forecasts, the USD will go up;

• If the actual level of GDP growth is lower than the forecasts, the USD will go down

1561461054-b3f858e319ff2d2131d5b3be11a39197_1200x1200_q90v3.png
 
Weekly Cryptonews

More at: http://bit.ly/2RM4RWe

28.06.2019

Joe Kerner, CNBC journalist:

"Fiat currency is the currency for government, Libra is for corporations and the only Bitcoin was the asset for the people. I feel like a Bitcoin evangelist right now and stand by it. First of all, who made Facebook in charge to give out currency as and when they please. Who even anointed them, especially with their history?"

The week has been emotionally unstable for BTC traders. After the surge during the first part of the week, when the price for Bitcoin tested the levels above $13,800, the digital asset fell below $11,000 on Thursday. At the moment of writing, the digital currency has been trying to recover. It has already tested the resistance at $12,020. If bulls manage to break this level, the next resistance will be placed at $12,927. From the downside, the first support is placed at $10,563. After the break of this level, the further fall will be limited by the $9,168 level.
Regulations:

· The Chinese authorities unexpectedly named Bitcoin as a safe haven for investors.

· US CFTC allowed the trading of Bitcoin futures on the LedgerX crypto exchange platform.

· The authorities of Malta wants to obligate the registration on the blockchain of all the transactions with the real estate.
Crypto announces:

· During the dump of BTC, Coinbase and BitMEX crypto exchange platform failed stress test and were functioning with glitches.

· The Singapore exchange platform Bitrue was hacked on Thursday. Hackers withdrew around $4.2 million in XRP and ADA.

· JPMorgan prepares to test its token with some of its corporate clients.
New developments:

· The Brave blockchain browser’s developers are working on the integration of the Ethereum, Ledger and Trezor crypto wallets.

· SWIFT will offer the usage of instant payments through the GPI platform to blockchain companies.

Current prices (last update 17:19 MT time)

Bitcoin $11,790

DASH $165.11

Ethereum $306.24

Litecoin: $119.19
 
Charts in MT4

In this video, we’ll talk about the key part of the trading terminal – price charts.

In the previous video, we saw that there are several ways to open a new chart in MT4.

You can either click “File” – “New chart” or the “New Chart Icon” in the standard toolbar.

Let’s know more about to use our account!

http://bit.ly/2NjR7Dd
--------------------------------------------------------------------------

GVqA5rd.jpg
 
Market updates on July 2

Check the graphs: http://bit.ly/2XhMJVl

02.07.2019

During the early trading hours, the Australian central bank cut its interest rate to 1% with the dovish outlook. As the decision was already priced in, the Australian dollar tested the ground below 50-period SMA ahead of the meeting but bounced back on the H4 chart. At the moment it is moving towards the resistance at 0.6994. The next resistance is placed at 0.7007. After the breakout of this level, keep an eye on the resistance at 0.7022. From the downside, bears need to pull the pair towards the 0.6963-0.6956 zone. After the breakout, the fall towards the support at 0.6947 is possible.

·Yesterday, the US threatened to raise tariffs on $4 billion of additional EU goods due to the dispute over aircraft subsidies. Combined with the comments on the further easing by the ECB policymakers, the news pulled the euro below the 50-period and 100-period SMAs on H4. Bears need to break the support at 1.1280 to pull EUR/USD lower. The next support levels will be placed at 1.1269 and 1.1257. On the other hand, if bulls try to push the pair up, they will, at first, reach the resistance at 1.1306 (100-period SMA). After that, they face resistance at 1.3190. If this level is broken, the next one will lie at 1.1348 (50-period SMA). RSI oscillator is about to leave the oversold zone, which may provide a buying opportunity. Pay attention to the speech by the FOMC member Williams, which may affect the EUR/USD pair.

·The uncertainties for the British pound remain, as one of the leading candidates on the post of the UK Prime Minister plans to leave the EU without a deal on October 31. The cable has been trying to stick below the 1.2623 on H4. The next support levels will be placed at 1.2612 and 1.2603. From the upside, buyers will pay attention to the 1.2648 level. After the breakout, the pair will rise as far as the 1.2670 level (100-period SMA) is reached.

·The greenback has risen significantly against the Chinese yuan. The USD/CNH has been testing the resistance at 6.8855 on the H4. The next significant level is placed at 6.8917. The PBOC set USD/CNY reference rate for today at 6.8513, that is why we may anticipate the fall of the pair. Keep an eye on the support levels at 6.8636, 6.8578 and 6.8486.

· Gold has been trading in a narrow range between $1,383 and $1,393 levels on H4. If the $1,393 level is broken, the next resistance lies at $1,404. After the breakout, the bullish strength may be limited by the resistance at $1,411. Bears need to pay attention to the $1,383 and $1,364 levels.

yRebgX4KQja9J_nx_640x320_q80v3.jpg
 
Positive news from the US-China trade front is moving the aussie

More at: http://bit.ly/2LzABwI

03.07.2019

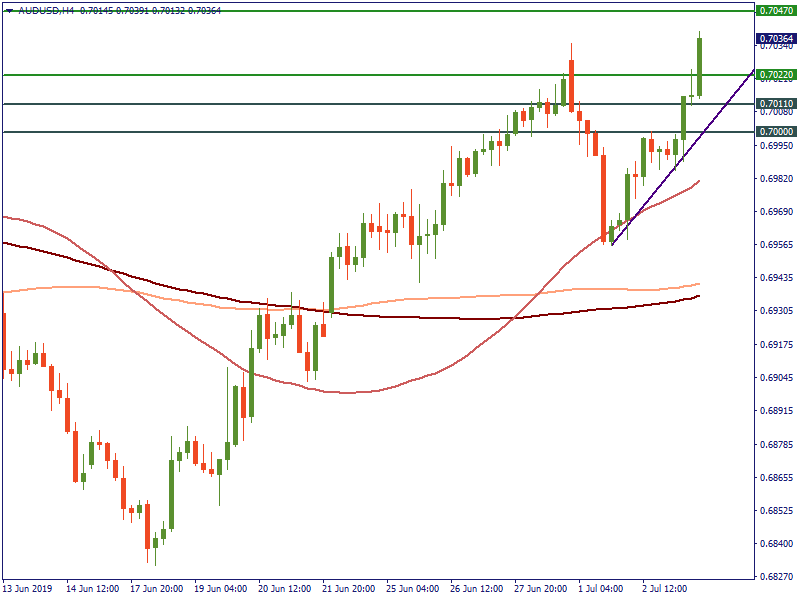
The Australian dollar gained on the news that China considers buying more agricultural goods from the US. On H4, AUD/USD has risen higher above the 0.7022 level and is currently targeting the resistance at 0.7047. The next key level for bulls will lie at 0.7061. If the rise is limited, the pair will fall to the 0.7011 level. The next support will lie at 0.7.

1562165936-77792247dfb92d8a1910c0d72fd89ccb_1200x1200_q90v3.png
 
Market updates on July 4

More at: http://bit.ly/2Yz129a

04.07.2019

What currency pairs to watch today?

After the test of the 61.8% Fibo near the 1.1270 level on H4, the EUR/USD pair has been ranging between this level and resistance at 1.1294 (50% Fibo level). The bullish strength will be confirmed if the pair manages to break the current resistance and stick above the 100-period SMA. In that case, the rise may be limited by the next resistance at 1.1343 (50-period SMA). From the downside, the break of the 1.1270 level will increase the risks of the further fall towards the 1.1252 level (200-period SMA). This is also the border of the ascending trading channel.

Yesterday, GBP/USD slid towards the 1.2556 level. On H4, the pair is currently consolidating between 1.2556 and 1.2589-1.2597 levels. The weakness of the GBP will put additional pressure to the pair. As a result, if the 1.2556 level is broken, the next support will lie at 1.2510. On the other hand, the inability of bears to break the 1.2556 level will help bulls to retest the upper border of the consolidation range between 1.2589 and 1.2597. If these levels are broken, the pair will rise to the next resistance at 1.2632.

AUD/USD was unable to stick near the strong resistance at 0.7047 and fell below the 0.7022 level at the beginning of the day. Bulls need to break this level to restore the upward moving channel. However, MACD formed a bearish divergence with the price that is why we may expect further fall. From the downside, the 0.7011 and 0.7 levels are important for bears.

The kiwi has fallen below the 0.6693 level towards the 0.6674 level, which lies close to the 23.6% Fibo and 50-period SMA. The strength of bears will be confirmed if the pair manages to fall below this level and target the next support at 0.6656. The next key level for sellers will lie at 0.6629. If buyers take back control over the market, the kiwi will retest the resistance at 0.6693. The break of this level make it possible to retest the 0.6717 level.

xLw789xMKnM_YcOh_640x320_q80v3.jpg
 
Non-farm payrolls: what pairs to watch?

Check the charts: http://bit.ly/2XLvWOJ

05.07.2019

Analysts anticipate the level of non-farm payrolls to increase by 162K jobs (vs. 75K previously). At the same time, the level of average hourly earnings is forecast to advance by 0.3% (vs. 0.2% previously) and the unemployment rate is expected to stay stable at 3.6%. If the NFP and average hourly earnings are higher and the unemployment rate is lower than the forecasts, the USD will go up. Be careful with your trades as the USD gets super volatile after the release.

CHECK THE STRATEGY OF TRADING THE NFP HERE

AND JOIN THE LIVE SESSION OF TRADING THE NFP WITH FBS ANALYST ON OUR FACEBOOK PAGE!

The USD has got stronger ahead of the release, but will the situation change after 15:30 MT?

· On H4, EUR/USD has crossed the 1.1270 level (61.8% Fibo) and is currently moving downwards to the 1.1257 level, which lies close to the 200-period SMA and the lower border of the ascending channel. If the employment data is positive, the pair will fall below the 1.1257 level towards the next support at 1.1223. There is the possibility for EUR/USD to reach the next support at 1.1219 and test the next level at 1.1202, of bearish pressure is strong. On the other hand, if the employment data disappoints, EUR/USD will rise back to the resistance at 1.1288, jump above the 50% Fibo level and go higher to the next resistance at 1.1319.

· GBP/USD has been testing the lower border of the consolidation range at 1.2556 on H4. If the USD gets stronger on the release, the fall towards the next support at 1.2510 will be possible. From the upside, pay attention to the resistance levels at 1.2589, 1.2604 and 1.2635.

· USD/JPY has jumped above the 100-period SMA on H4 in anticipation of the release. The next resistance levels for the pair lie at 108.12, 108.36 and 108.49. In case of a negative release, USD/JPY will fall back to 107.74. If this level is broken, the next support will lie at 107.56. Stochastic indicator is about to form a crossover within the oversold zone, which may provide us selling opportunity.
 
Market updates on July 8

Check the charts: http://bit.ly/2YACXyV

08.07.2019

Last Friday the NFP outperformed the estimates. It increased by 224 thousand jobs (vs. 162 thousand expected). As a result, the USD strengthened and pulled EUR/USD down. On H4, the pair has been making modest gains towards the 1.1232 level. If this level is broken, the next resistance will lie at 1.1246. RSI is moving close to the 30 level and may signal a buying opportunity if it crosses this level from bottom to top. If the USD gets stronger, there is a possibility for the pair to break the 1.1219 level. The next support will lie at 1.1202.

GBP/USD tested the lows at 1.2480 on Friday after the employment release for the US and stuck near the 1.2510 level. On H4, bulls need to push the pair above the 1.2541 level to confirm their strength. In that case, the cable will rise as far as the 1.2589 level will be reached. From the downside, pay attention to the 1.2510 and 1.2480 levels.

After the Turkish president Recep Tayyip Erdoğan fired the head of the central bank as the Governor had not cut the interest rate, the Turkish lira fell down. On H4, USD/TRY formed a gap up at the beginning of the trading day. The rise of the pair was limited by the 100-period SMA near the 5.7557 level. If the Turkish lira continues to weaken, the next resistance levels will lie at 5.7794 and 5.8. On the other hand, the pair may correct to the support at 5.6967. The next support will lie at 5.6616.

p2qe2yvhO--KRG4h_640x320_q80v3.jpg
 

Live Forex Chart

Currency
Rates
EUR / USD
1.13609
USD / JPY
157.469
GBP / USD
1.32404
USD / CHF
0.83346
USD / CAD
1.41855
EUR / JPY
178.899
AUD / USD
0.69933
Back
Top
Log in Register