radex78
Active+ Member
- Messages
- 2,984
- Joined
- Nov 22, 2014
- Messages
- 2,984
- Reaction score
- 6
- Points
- 35

Technical analysis of BTC/USD
Changes in prices on Wednesday on the crypto instrument BTCUSD pair experienced a sharp decline.
The price opened at 9327 with the highest level 9385, and the price closed 8813 and the lowest was 8652.
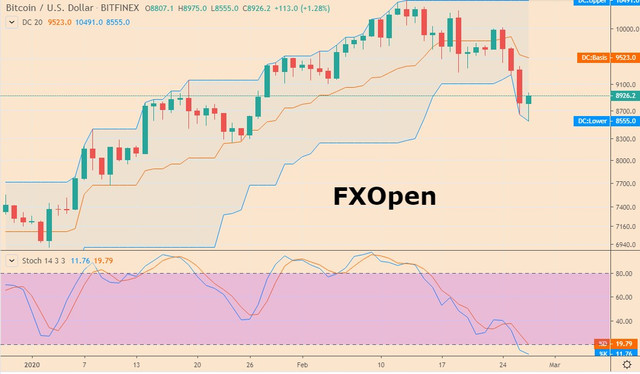
At this time the price has rebounded and one bulls candle starts to emerge indicating seller pressure is starting to weaken.
But the bullish journey doesn't seem strong enough to push this pair back up, it's still one third of the previous candle, so today's high is still below the previous daily high.
There we see the stochastic indicator has entered the oversold zone, an indication of the trend is probably over.
But to show a reversal of the trend, confirmation of the stochastic line has not crossed yet.
This is different from the indicator line on the H1 timeframe where prices are currently on the upper line of the channel Donchian, and enter the overbought zone on the stochastic indicator.
The closest support is at 5562, while the closest resistance is at 8963.
If the decline is still strong enough it can bring prices to fall even deeper
Read more...for LTC and EOS analysis
Subscribe our FXOpen Youtube Channel
FXOpen
FXOpen - one of the most successful and fastest-growing Forex brokers.
UK & AU regulated. ECN, STP, Crypto, Micro, PAMM accounts.
Open account//Join FXOpen