FXOpen Trader
Active+ Member
- Messages
- 2,765
- Joined
- Dec 4, 2020
- Messages
- 2,765
- Reaction score
- 4
- Points
- 35
AUDUSD Technical Analysis – 16th SEP, 2024
AUDUSD – Resistance of Channel is Broken
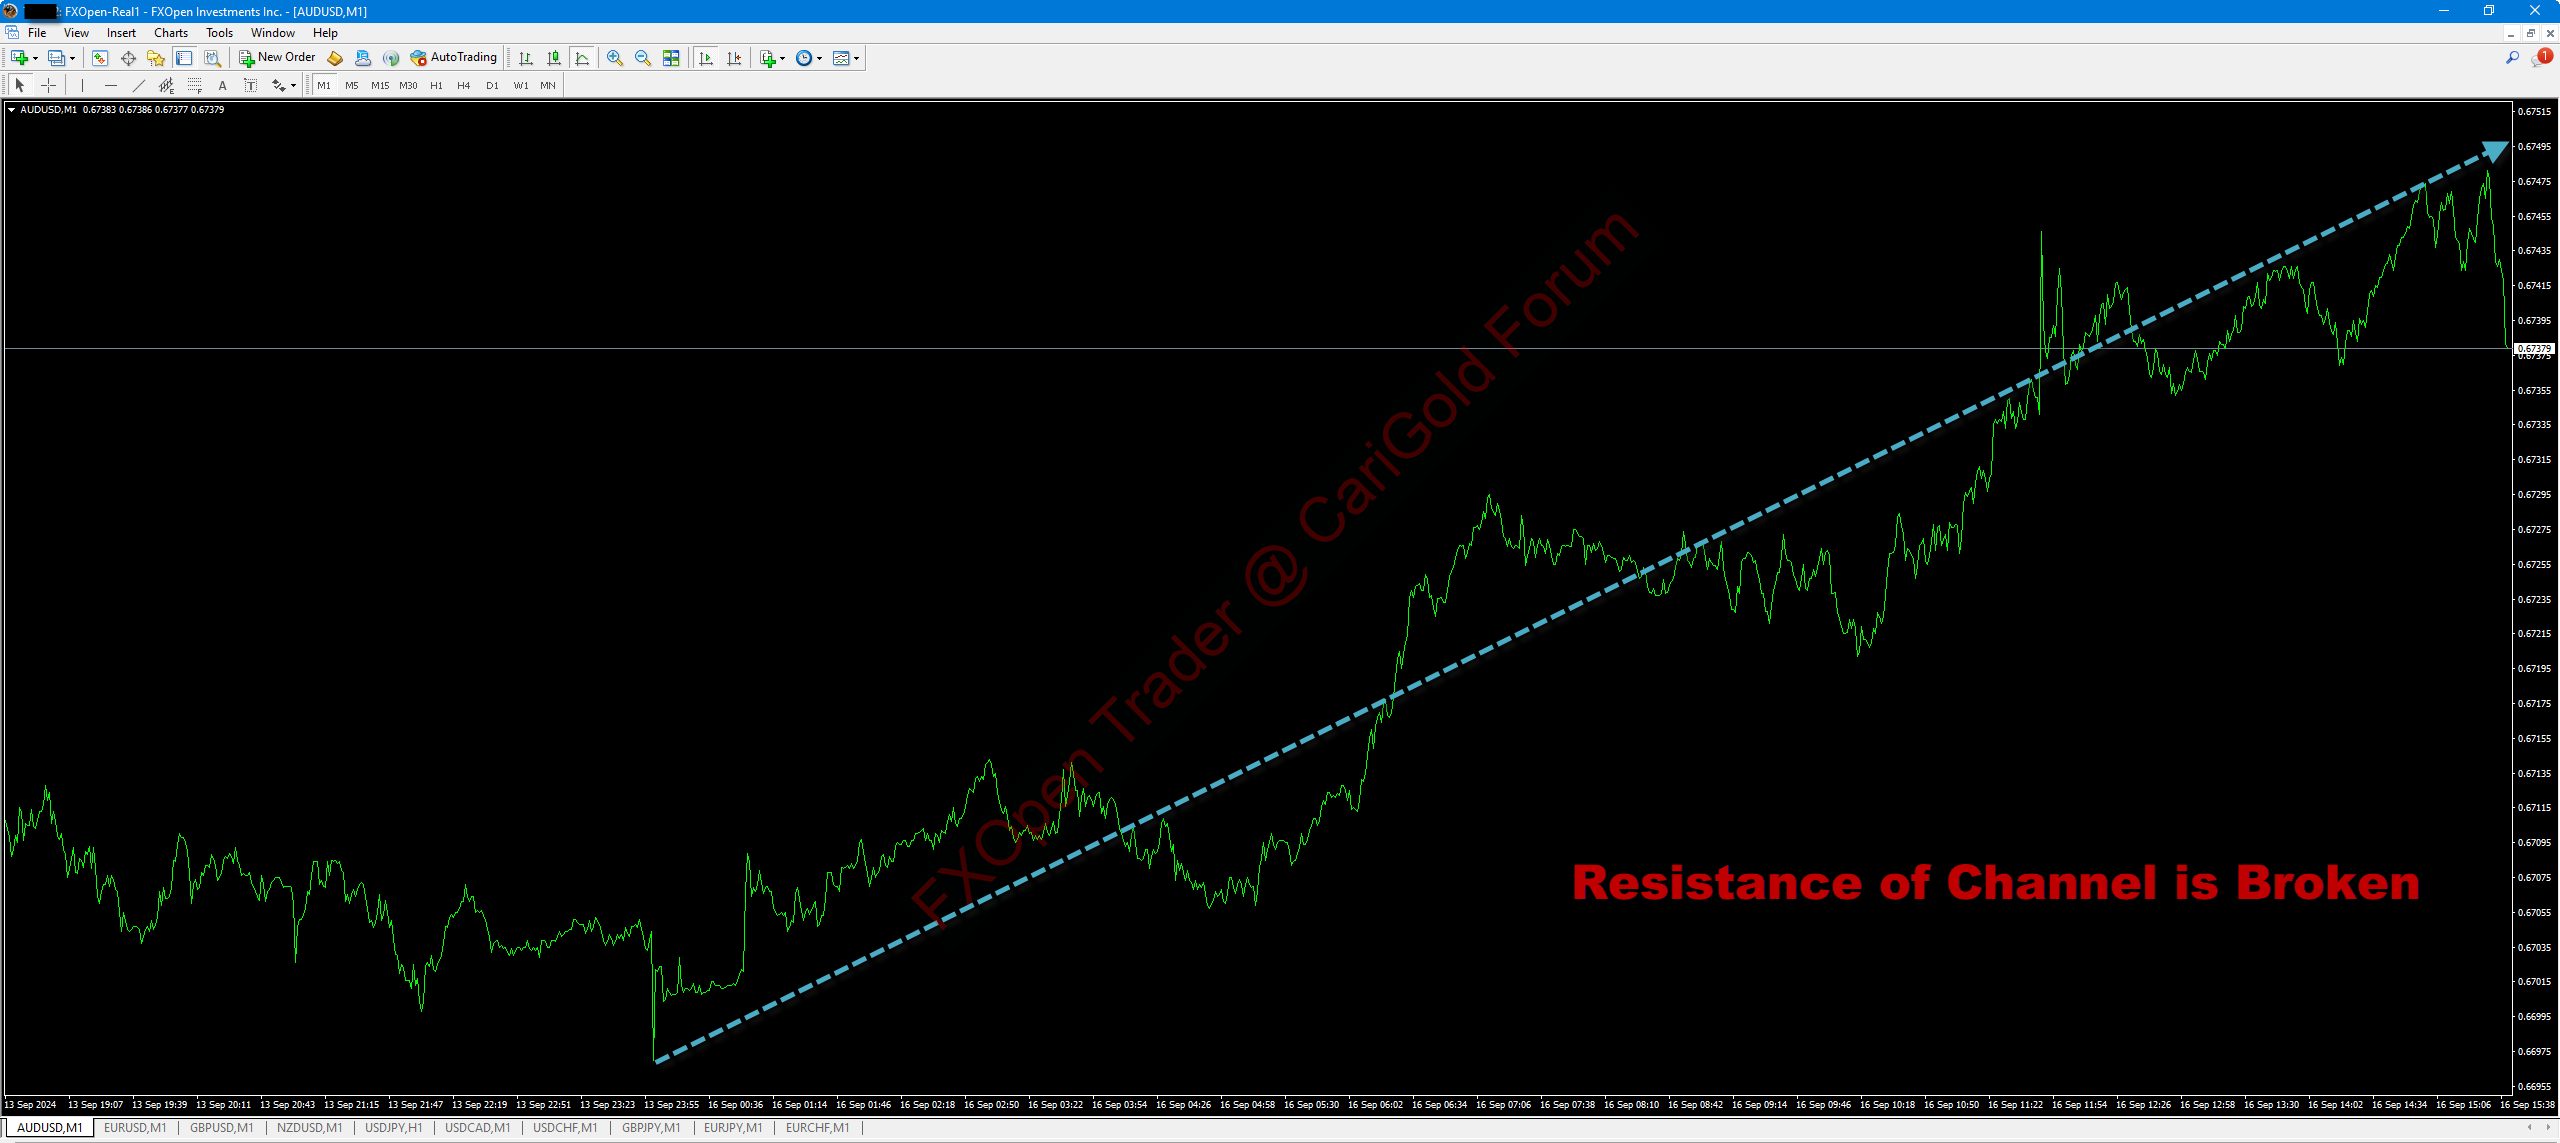
AUDUSD was unable to continue its bearish momentum and after touching a low of 0.6697 the prices started to rise upwards against the United States Dollar today in the European Trading session.
We can see that the Resistance of channel is broken in the 1-hourly timeframe.
We can detect Bullish price crossover with Moving Average 20 in the daily timeframe.
We have also seen Bullish price crossover with adaptative moving average 20 in the daily timeframe.
The Parabolic SAR indicator bullish reversal is visible in the daily timeframe.
Some of the technical indicators are giving a Neutral to Bearish stance in the markets which indicates the presence of the consolidation wave in the markets.
We can see Aussie is Near a new HIGH record (1 year) in the weekly timeframe.
AUDUSD is now trading above its 100-hour SMA and below its 200-hour SMA simple moving averages.
• Aussie Bullish reversal seen above the 0.6697 mark.
• Short-term range appears to be Strong Bullish.
• AUDUSD continues to remain above the 0.6740 levels.
• Average true range ATR is indicating Less market volatility.
The next resistance is located at 0.6746 which is a 38.2% Retracement From 4 Week High.
AUDUSD is now trading near to its Pivot levels of 0.6744 and is moving into a Strong Bullish channel.
The price of AUDUSD remains just above its Classic support levels of 0.6727 and is moving towards its next target of 0.6755 which is a Price 2 Standard Deviations Resistance.
Disclaimer: This analysis represents my own opinion only. It is not to be construed as an opinion, offer, solicitation, recommendation, or financial advice of the Companies operating under the FXOpen brand.
For in-depth analysis, please check FXOpen Blog
AUDUSD – Resistance of Channel is Broken
AUDUSD was unable to continue its bearish momentum and after touching a low of 0.6697 the prices started to rise upwards against the United States Dollar today in the European Trading session.
We can see that the Resistance of channel is broken in the 1-hourly timeframe.
We can detect Bullish price crossover with Moving Average 20 in the daily timeframe.
We have also seen Bullish price crossover with adaptative moving average 20 in the daily timeframe.
The Parabolic SAR indicator bullish reversal is visible in the daily timeframe.
Some of the technical indicators are giving a Neutral to Bearish stance in the markets which indicates the presence of the consolidation wave in the markets.
We can see Aussie is Near a new HIGH record (1 year) in the weekly timeframe.
AUDUSD is now trading above its 100-hour SMA and below its 200-hour SMA simple moving averages.
• Aussie Bullish reversal seen above the 0.6697 mark.
• Short-term range appears to be Strong Bullish.
• AUDUSD continues to remain above the 0.6740 levels.
• Average true range ATR is indicating Less market volatility.
The next resistance is located at 0.6746 which is a 38.2% Retracement From 4 Week High.
AUDUSD is now trading near to its Pivot levels of 0.6744 and is moving into a Strong Bullish channel.
The price of AUDUSD remains just above its Classic support levels of 0.6727 and is moving towards its next target of 0.6755 which is a Price 2 Standard Deviations Resistance.
Disclaimer: This analysis represents my own opinion only. It is not to be construed as an opinion, offer, solicitation, recommendation, or financial advice of the Companies operating under the FXOpen brand.
For in-depth analysis, please check FXOpen Blog


