BTC USD 61,295.5 Gold USD 4,328.60
Time now: Jun 1, 12:00 AM

ACY Daily Market Analyst

Looine Dropped as US Jobs Boost USD – 7 August, ACY Team

The loonie continued to lose its value for a fifth straight day on Friday from the high record since the July of 2015, and fell 1.7 percent against the U.S. dollar last week but is still up nearly 9 percent since early May.
With some positive signs that U.S. employers hired more workers than expected in July and raised their wages, the greenback rallied against a basket of major currencies last week. Rise in hiring data in July along with stronger household incomes and buoyant consumer confidence may put another plan of raising interest rates later this year conducted by the Federal Reserve into schedule as it seeks to normalize monetary policy.
Additionally good performance of change in non-farm payrolls which was beating the forecast propelled the recent growth. Although the corrective bounce in the U.S. dollar is happening, markets still show questioned about its long-term growth as President Donald Trump’s policy agenda has run aground.
The value decline of loonie can be seen as a corrective rally in the U.S. dollar, pushed mostly from the greenback side in relation to the U.S. jobs data. Jobs data showed that Canadian labor market starts to tighten, as Canada's economy added 10,900 jobs in July, mostly in full-time employment, Statistics Canada said, while the jobless rate fell to its lowest since October 2008.
The currency's strongest level of the session was C$1.24332, while it touched its weakest since July 18 at C$1.2667. Helped by the Bank of Canada raising interest rates last month for the first time in nearly seven years, the loonie surged more than 9 percent since early May.
Oil prices are one of Canada’s major exports and are playing an important role in its GDP, rising on Friday but were down on the week, pressured by rising OPEC exports and strong U.S. output.
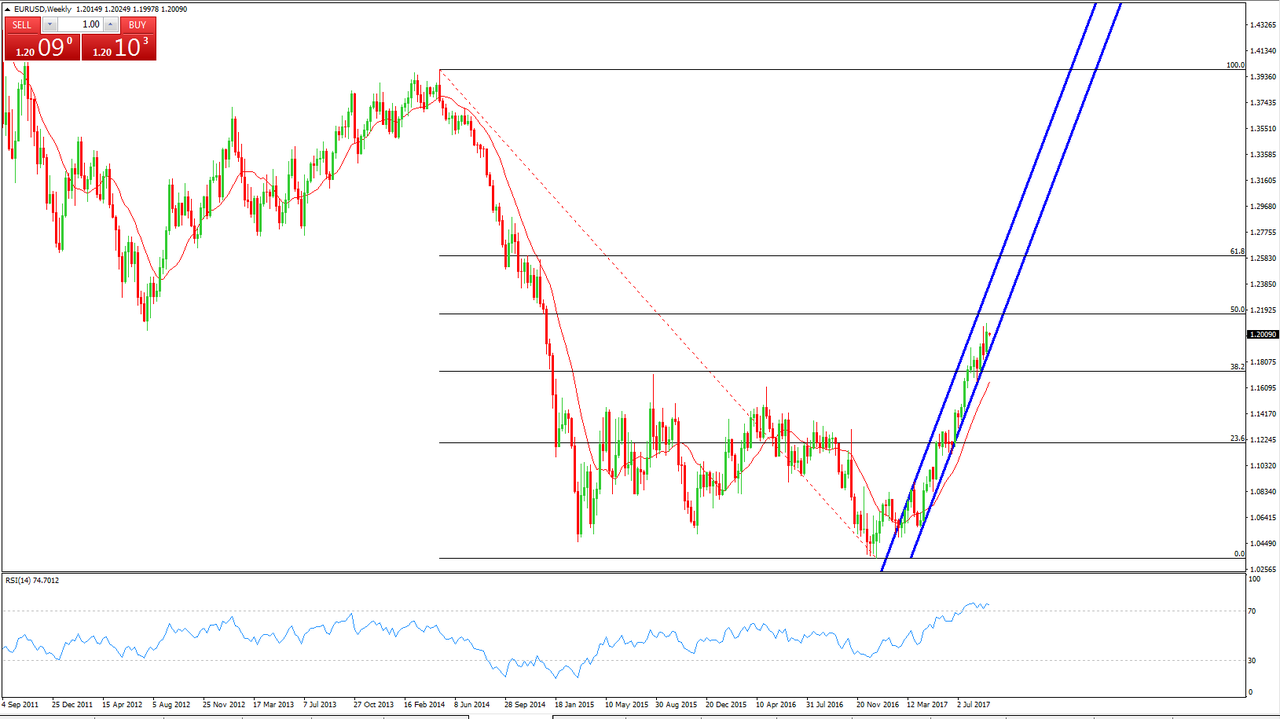
The USD/CAD declined slightly by nearly 0.1 percent to C$1.26342 as of 12:05 p.m. in Sydney. Technically with a sign of rising Relative Strength Index (RSI) of 44.8623, the USD/CAD is consolidating in a daily developing ascending channel. It may cease to rise after touching a key resistance found at a descending 20-day moving average.
In the event that the USD/CAD breaks lower propelled by MA5, traders should first watch for the pair to decline further. Alternatively if prices continue to edge higher, the USD/CAD must first break above Friday’s high of 1.26674, then test the ascending channel line near 1.26815.
When we analyse by Fibonacci retracement, 1.27370 (23.6% retracement) could be seen as another resistance if the pair continues to rise.


20690322_1973327092943957_1626606481059475686_o.png

Chart 1: USDCAD Daily


ACY, the Best Choice for Global Investors
We can Improve your Trading!

For more information, please visit us on www.acy.com
Or Facebook https://www.facebook.com/acy.capital/
 
Gold Kept Rising Despite a Weakening Fear on North Korea

Gold prices held on to their recent haven-driven gains last week with the precious metal up 2.3 percent to trade at 1287 ahead of the New York close on Friday, despite efforts from U.S. officials to tamp down fears of imminent nuclear war with North Korea. It hit tops on Friday since Jun. 8th, closed by 0.19 percent at $1288.11, while with some intraday volatilities.
The advance continues amid growing geopolitical tensions between the U.S. and North Korea with more hawkish voice on nuclear war by North Korean leader Kim Jong-Un. Nevertheless, two top U.S. national security officials sought to lower fears of this geopolitical risk by preparing to meet with South Korea’s leader. In a call with Trump on Saturday in Asia, Chinese President Xi Jinping called for all sides to maintain restraint and avoid inflammatory comments.
The latest reading on consumer price index in U.S. showed a below-forecast rise, lowering the possibilities for the central bank to stay on its tightening course for one more rate hike this year. The less-than-expected CPI has boosted gains on gold prices, continuing to drive investors out of investing U.S. dollar, and attracting them in the gold market instead.
The Consumer Price Index rose 0.1 percent seasonally adjusted; rising 1.7 percent over the last 12 months, not seasonally adjusted, a Labor Department report showed Friday. More specially, the index for shelter, medical care and food rose in July, leading to the overall increase. The index for natural gas declined, while the electricity index rose and the gasoline index was unchanged.
Highlighting the economic data this week will be the July retail sales and the release of the minutes from the latest FOMC policy meeting. Weakening price index dragged the expectation for a December rate-hike to just a 30 percent chance that the central bank will deliver on its promise for a final 25bps hike this year. There is a general expectation that coming with falling interest rate expectation, rising geo-political tensions, along with weakness in broader risk assets weighting on sentiment, gold is likely to remain well-supported in the medium term.
Technically gold prices have signs to slow down its increase in face of a key resistance above found at Jun 6th’s highs of 1296.06, with an intraday trading at 1287.72 as of 12:16 pm in Sydney. In this spot, investors should keep a close eye on next few days’ performance. If it is successfully breaking to the resistance, a bullish market for gold prices could be seen in the near term; otherwise, it likely retreats to find near support at May 9th’s low of 1214.25.

20746147_1976444382632228_2988178622635029783_o.png


Chart 1: XAUUSD Daily

A closer look at price action in 240-min chart shows prices attempt to approach the upper channel line, keeping gold within the ascending channel formation that we’ve tracking for weeks now. Any breakout of this channel will likely lead to a changing pattern afterwards.

20861726_1976444545965545_2619354543740467303_o.png


Chart 2: XAUUSD 240-min
 
Last edited:
Japanese Yen Dropped 1.3 Percent to Four Months Lowest


On Monday, Japan’s GDP came in at 4.0 percent which is much higher than forecasted 2.5 percent, making it the strongest growth in more than two years since the first quarter of 2015. The solid GDP data has shown signs of improvement of the Japanese economy, investor, the Nikkei 225 gained 0.9 percent intraday closed at 19590.0 while opening at 19405.0 on Monday.

The Japanese Yen was one of the winner in last week’s over North Korea crisis, as investors sought after safe-haven assets such as Yen and Gold because of the tightening tension between U.S. and North Korea. JPY has dropped 1.3 percent last week to 108.74, lowest since April

However, the concern over tensions between the U.S. and North Korea seems eased for now, after President Trump keeps quite on Monday, and North Korea signalled that it would delay plans to fire a missile near Guam.
The New York Fed President William Dudley’s hawkish statement about another interest rate hike this year also helped lifted the greenback, which made a slight change to JPY Monday.

Spot Gold price pulled back 0.5 percent on Monday after rising for four consecutive days, traded at 1281.33ounce. As of writing, gold is trading at 1274.49 per ounce, which have broken the key resistance of 1290 and 1280.
From chart 1, investors will need to be cautious on support level of 1270, because of the unpredictable situation between the U.S. and North Korea, and the upcoming US Fed Meeting, spot Gold is believed still have the chance to advance. In the meantime, 1282 is another key resistance which investors should keep a close eye in the next few days.

20748340_1976986945911305_6080734698675945810_o.png
 
Pound Extended Losses With a Weaker-Than-Estimated CPI

The pound extended losses and fell to the monthly lowest against the U.S. dollar after UK’s CPI released on Tuesday showed inflation is weaker than forecast, slowing down the path on interest rate hike by the Bank of England. Hence reduced expectations of tighter policy dragged the pound these days
.
Sterling was down for a second day, mainly influenced by its July inflation rate of 2.6 precent rise, the same pace as in June and missing market expectations of a 2.7 percent gain. While core inflation, which excludes volatile food and energy prices, remains unchanged at 2.4 percent, also below the expected.

More specifically, prices for housing, electricity, gas and other fuels rose 2.2 percent from 2 percent in June; food and non-alcoholic beverages jumped 2.6 percent from 2.3 percent; clothing and footwear increased 3.2 percent from 2.3 percent. While cost of transport, recreation and culture, and restaurants and hotels went up at a slower pace.

Despite CPI inflation growth held steady last month, prices are still rising well ahead of average wages, which means the speed-up inflation is squeezing on most peoples’ living standard. For example, commuters, as well as loan lenders, are set to bear the brunt of soaring costs linked to retail-price increases. However, pensioners will benefit most because their payments are based on the retail index.

U.S. retail sales rose by 0.6 percent, recording their biggest increase in seven months in July as sales on motor vehicles surged and consumers’ discretionary spending rose. It’s suggesting the economy continued to gain momentum early in the third quarter, and also boosting U.S. dollar.

The GBP/USD rose slightly by nearly 0.07 percent to $1.28690 as of 2:10 p.m. in Sydney. Technically even though with a sign of weak Relative Strength Index (RSI) of 38.9348, the GBP/USD is consolidating in a daily developing ascending channel in the medium term. It may cease to decline after touching a key support found at a lower channel line.
In the event that the GBP/USD breaks out the channel line, traders should first watch for the pair to decline further and look for another support at Jun 21st’s low. Alternatively if prices continue to reverse higher, the GBP/USD will test 20-day moving average.

20863610_1977349852541681_3844363104898198707_o.png


Chart 1: GBPUSD Daily
A glance in a longer term of weekly chart shows it’s now struggling to break out 1.29461 (23.6% retracement), which could be seen as an obstacle for further increase. If it fails to retreat, investors could see a long-buy before 1.37621 (38.2% retracement).

20819427_1977349915875008_5343795570876441286_o.png


Chart 2: GBPUSD Weekly
 
Crude Rises to 12-Week High Amid Tighter Supplies

The U.S. West Texas Intermediate crude September contract settled sharply higher on Friday, jumping about $1.8, or 3.84 percent to end at $48.654 a barrel. Despite its Friday’s rally, oil prices fell last week on signs that reports of weak Chinese demand deflated the market, but a rather bullish EIA report, a weaker dollar and a falling rig count provided some lifts.

Oil rose to the highest since late May amid tightening supplies and a broader market’s rally sparked by Steve Bannon’s departure from the White House. Government data earlier last week demonstrated that the stockpiles dropped the most since September last week, while U.S. crude production had the biggest weekly rise since June.

The removal of Bannon, the former chairman of Breitbart News, may calm the waters on Trump’s remarks on violence in Charlottesville, Virginia, which led to sustained questions about his ability to retain his team and implement his economic plans and U.S. energy strategy effectively.

A report updated by oilfield services firm Baker Hughes Friday morning, shows its weekly count of oil rigs operating in the U.S. last week fell by five rigs to a total of 763. A unit at Exxon (NYSE:XOM) Mobil’s Baytown, providing 584,000 barrel-a-day, the second largest refinery in the U.S., has been shut down. The reduced rigs are an important barometer for the drilling industry and serves as a proxy for decreased oil production supply.

Oil prices has lingered below $50 a barrel as the OPEC (Organization of Petroleum Exporting Countries) and its allies make efforts to cut supplies and help rebalance the market. Besides members in OPEC, 10 more producers outside the cartel, including Russia, agreed a deal to slash 1.8 million barrels per day in supply until March 2018.

In the week ahead, investors will keep a close eye on the weekly data on oil and gasoline stockpiles released by the U.S. Energy Information Administration.

Price of crude oil is currently trading slightly lower at 48.535 as of 12:16 p.m. in Sydney. With bullish signs that the Relative Strength Index (RSI 14) has been in a rise tendency at 53.9695, its price broke higher to a descending price channel, which was supposed to be a price formation in the last few months, after retreating from the breakout earlier this month. The second breakout is more likely to lead to further rise afterwards, but will face a resistance found at 50.271.

21015946_1979555102321156_67165281835086178_o.png


Chart 1: WTICOUSD Daily
 
NAS100 Soared Amid Big Step on Tax Reform

Nasdaq 100 Index rose the most in a week after a significant drop a week before, while Treasuries declined and the dollar rallied with growing expectation that Trump administration is making efforts to reform the tax plan.

NAS100 surged 1.46 percent or 84.5 points to close at 5818.3, rallying strongly back to 5-day moving average. The biggest gainers of the session on the NAS100 were Vertex Pharmaceuticals Inc (NYSE:VRTX), which rose 4.34 percent or 6.47 points to close at 155.48. Activision Blizzard Inc (NYSE:ATVI) gained 4.01 percent or 2.48 points to end at 64.26 and Fastenal Company (NYSE:FAST) was up 3.58 percent or 1.43 points to 41.40 in late trade.

However, The biggest losers included Ulta Beauty Inc (NYSE:ULTA), lost 1.09 percent or 2.56 points to end at 231.65, while Intel Corporation (NYSE:INTC) declined 0.77 percent or 0.27 points to 34.65 and Mattel Inc (NYSE:Mat) shed 0.67 percent or 0.11 points to close at 16.31.
Trump’s team and lawmakers are making significant strides in shaping a tax overhaul, moving far beyond the six-paragraph framework pushed out in July that stoked fears about their ability on one of the GOP’s top priorities. Nowadays there is broad consensus on some of ways to pay for cutting both the individuals and corporate tax rates, including capping the mortgage interest deduction for homeowners and scrapping people’s ability to deduct state and local taxes.

After the failure to repeal Obamacare, Repbulicans are under pressure and eager to make serious moves on tax reform, which area could animate the president, business community and rebuild public’s confidence in Republicans far more than the nuts and bolts of health care ever did.
Despite a continuous growth of stock market, HSBC Holdings Plc, Citigroup Inc. and Morgan Stanley see mounting sign that global markets are in the last stage of their rallies before a downturn in the business cycle.

Oxford Economics Ltd. marco strategist Gaurav Saroliya used an indicator -- the gross value-added of non-financial companies after inflation – for U.S. equity bulls, which shows negative on a year-on-year basis. Compared with former recession points, the positioning of U.S. real corporate surpluses showed that we are probably very late in the cycle.

21077515_1980434822233184_1667731189028848636_n.png


Chart 1: US Real Gross Corporate Surpluses
Technically even though with a sign of daily descending Relative Strength Index at 51.4429, NAS100 is still moving in a gaining momentum. Right after finding support at 5770.2 (50.0% retracement), it is now struggling right below 5885.1 (23.6% retracement), which can be regarded as a resistance. In the event of its breakout, further rise towards July 27’s high of 5988.7 would occur.

20989134_1980434882233178_8646605619825924750_o.png


Chart 2: NAS100 Daily
From a glance in a longer term of weekly chart, we could see a few long upper shadow in candle sticks for past few weeks. It probably shows that a high resistance above prevents the index from breaking out. If it fails to break higher, investors should be more cautious about a potentially downward risk.

21083079_1980434935566506_5520337396293247502_o.png


Chart 3: NAS100 Weekly
 
[Euro Strength Continues After Draghi Comments

The euro surged to the highest level since January 2015 against the U.S. dollar on Friday, by 1.03 percent to end at $1.19188 amid little mention about the single currency’s strength as had been expected by European Central Bank President Mario Draghi.

Speaking at the U.S. Federal Reserve’s annual conference in Jackson Hole, Wyoming, Draghi defended free trade and post-crisis financial regulation, while avoiding any comments on monetary-policy deliberates or the euro exchange rate, which was considered as a problem that he spoke out previously.

“Openness to trade is under threat, and this means that policies aimed at answering this backlash are a vital part of the policy mix for dynamic growth,” Draghi said in the published text of his speech at the event in Wyoming on Friday. “A turn towards protectionism would pose a serious risk for continued productivity growth and potential growth in the global economy.”

It is the fact that the euro has extended its gains to a fairly high level, and some investors had hoped Draghi would try to talk down the euro as the strong currency would undermine the euro-area economic recovery, reflected by losing strength in exports.

The euro gained significantly with euro-area’s recovery since early this year. Germany is a key driver in this upturn as it accounts for around 30 percent of euro-area output. A breakdown of gross domestic product, which is set to be 0.6 percent growth published Friday, revealed consumers and the government drove the expansion last quarter. Exports rose slightly, though imports climbed faster and made net trade a drag on growth.

The nation’s uncertainties currently are from domestic factors, such as its automaker scandal and next month’s elections, and the outlook may be positive to future economy. However, Ifo’s measure of current economic condition eased back from a record high in August showed slide in investor confidence in the nation.

The EUR/USD retreated slightly by 0.17 percent to $1.19224 as of 12:20 p.m. in Sydney. Technically with a sign of rising Relative Strength Index (RSI) of 65.9531, the USD/CAD is still consolidating in a daily developing ascending channel.

From the daily chart of EUR/USD, we can see that it already broke to Jun 6’s low of 1.18760 in 2010, showing that further rise would occur if it will not retreat in the following few days.

21199745_1983165181960148_7724640891395261489_o.png


Chart 1: EURUSD Daily
 
Gold Opens High Amid North Korea’s Bomb Test

The gold price hits 11-month high, expectedly opening high and continuing to rise at the moment after North Korea conducted hydrogen bomb test. Gold has been increasing for almost two months at a pretty high speed amid a launch of midrange ballistic missile designed to carry a nuclear payload that flew over Japan and splashed into the northern Pacific Ocean.

North Korea conducted its sixth and most powerful nuclear test on Sunday, announcing that was an advanced hydrogen bomb for a long-range missile, and resulting the threat of a massive military response from the United States and South Korea.

Early Monday in Seoul, South Korea’s military confirmed it had carried out missile drills in response to the bomb test. U.S. Treasury Secretary Steve Mnuchin said on Sunday that he would put together a package of new sanctions to potentially cut off all trade with North Korea, including banning Pyongyang’s textile exports and country’s national airline, stopping oil supplies to the government and military, preventing North Koreans from working abroad and top officials to a blacklist to subject them to an asset freeze and travel ban.

The latest nuclear test is likely to pile more pressure on China to take tough action against its neighbour, but Beijing questioned economic sanctions will work and says it is not its sole responsibility to rein in Pyongyang.

The U.S. dollar index continued to decline as reports showed employment situation in U.S. is not losing its gaining momentum. As the fact that it disappointed for those looking for higher inflation, the market and Fed will remain in “wait and see” mode for the course on rate hike.

On last Friday, Nonfarm payrolls rose by 156,000 below the median estimate of 180,000, and revisions for the prior two months subtracted 41,000 jobs, according to Labor Department data on Friday. The unemployment rate rose to 4.4 percent from 4.3 percent.

Technically the gold price is still in its gaining momentum amid North Korea’s bomb test but facing a key resistance ahead found at Nov. 9’s high of 1337.13. The formation of positive flag is showing an increasing trend. In the event that failing to break out of the key resistance ahead, it likely retreats to 5-day moving average.

27cc41nqf84r.png


Chart 1: XAUUSD Daily
 
EUR/USD Hits Yearly Highs as ECB Unveils Post-QE Plan

The Euro climbed to fresh 2017-highs against the U.S. dollar on Friday but closing with some retreats, as the European Central Bank (ECB) sticks to its current policy on Thursday. The pair is still at risk of extending the gaining momentum from earlier this month amid key data form the U.S. economy continued undermine expectations for the third Fed rate-hikes in late 2017.

Mario Draghi, the president of ECB, gave a soft euro talk in the press conference. Despite little mention of the currency’s appreciation from the ECB president’s opening statement, the euro continued rise. Aside from admitting that the exchange rate’s volatility is problematic, he declined to give any action to reverse the current course.

Evidence shows that the central bank is in no rush to remove the zero-interest rate policy as the current inflation level is still far from the target of 2.0 percent rate, meaning that loose monetary policy is still needed for building and supporting headline inflation developments in the medium term.

Even though the ECB appears to remain its present rate level for an extended period of time, it seems the Governing Council will start to wind down the quantitative easing (QE) program ahead of the December deadline.

The growing geopolitical tension over North Korea’s nuclear development already put some threats on the global financial market and inevitably dragged the U.S. dollar, which slumped in the previous week. Besides that, there was a strong storm threatening energy and agricultural markets.

Hurricane Irma has knocked out power to 2.4 million customers, paralyzed tanker traffic and shut about 6,000 gasoline stations around the Florida. Once the storm makes its way up Florida’s west coast, it’ll also threaten more than $1 billion worth of crops.

Fed Fund Futures highlight increasing expectations Chair Janet Yellen will stay on hold for the remainder of the year as inflation rate struggles to achieve the 2 percent target. The key economic data prints coming out ahead of the September 20 interest rate decision and lower expectation of rate hikes may produce headwinds for the dollar as the core CPI is projected to slowdown in August, while Retail Sales are forecasted to rise only 0.1 percent following a 0.6 percent growth in July.

Technically with no sign of showing any reversal of EUR/USD, the pair may continue to push to fresh 2017-highs as it remains its growth in an ascending price channel carried over from earlier this year. The outlook of EUR/USD remains positive in the near term with the strong weekly Relative Strength Index (RSI) of 74.7979 as of 12:20 p.m. in Sydney.

Investors should keep a close eye on the following performance ahead of the coming data for U.S. economy. In the event that the EUR/USD breaks lower, and approaches the lower channel, traders should look for more long position if it finds support on that channel; otherwise, they may look for selling it when it breaks out.

If we try to see the future trend for the near term by drawing Fibonacci retracement, there is a key resistance found at 1.21608 (50% retracement) right ahead of the current position.

9772119_20170911044956.png


Chart 1: EURUSD Weekly
 
[B]USDCAD Dropped After U.S. Non-farm Payrolls Data[/B]

The Canadian dollar bounced on Friday by nearly 0.27 percent or 0.00336 points, erasing part of losses in the previous day, amid tightening job market in Canada. It has been suffering significant loss for a month from the low record since May 2015, mainly due to a strong rebound of the U.S. dollar.

According to the Bureau of Labor Statistics reports, nonfarm payrolls released on Friday lost 33,000 jobs in September, which was the first monthly decline in seven years, even as the unemployment rate fell to 4.2 percent, the lowest since February 2001.

The loss of non-farm payrolls reflected the devastating effects from Hurricanes Harvey and Irma, which attacked Texas and Florida respectively. The number, however, was expected to be lower than usual, thus it may affect the right response in monetary policy from the Federal Reserve.

Economists surveyed by DailyFX expected payroll growth of 80,000 in September, compared with 169,000 in August. The unemployment rate was expected to hold steady at 4.4 percent. It declined even as the labor-force participation rate rose to 63.1 percent, its highest level all year and the best reading since March 2014.

As the tightening U.S. labor market that ought bring inflation back to its 2 percent target, New York Fed President William Dudley suggested that the Fed should keep gradually raising interest rates to tighten monetary policy.

Canada added 10,000 jobs in September as gains in full-time work of 112,000 offset a loss of part-time jobs of 102,000. It is the 10th straight month of employment gains the strongest wage increases in more than a year, showing that Canada’s labor market has more signs to be tightening.

Technically the USD/CAD has been in an ascending developing price channel, already breaking out 60-day moving average. This cannel as depicted below, has been created by connecting a series of swing highs and lows beginning with September 8’s price action. In the event that the USD/CAD breaks lower, traders should first watch for the pair to breakout beneath the lower channel. Alternatively if prices reverses higher, the USD/CAD must first break above Friday’s high of 1.25975, then test the ascending channel line near 1.26887.

The short-term outlook for USD/CAD can be seen from the Fibonacci retracement. At this moment, 1.25033 (61.8% retracement) is a support level for its current position, and there is still room for further rise.

22289896_122802665086788_7276229282492594726_o.png


Chart 1: USDCAD Daily
 

Live Forex Chart

Currency
Rates
EUR / USD
1.15134
USD / JPY
160.305
GBP / USD
1.33271
USD / CHF
0.79644
USD / CAD
1.39375
EUR / JPY
184.566
AUD / USD
0.70220
Back
Top
Log in Register